The footwear manufacturing industry operates in a highly competitive and fast-moving environment. Manufacturers must manage production efficiency, quality control, labor productivity, material usage, delivery timelines, and operational costs simultaneously. Because multiple departments work together, decision-makers often struggle to track performance using scattered spreadsheets or manual reports.
Therefore, companies need a centralized system that converts raw production data into meaningful insights. A Footwear Manufacturing KPI Dashboard in Power BI solves this challenge by transforming operational data into clear visuals, measurable KPIs, and real-time performance tracking.
Click to Purchases Footwear Manufacturing KPI Dashboard in Power BI
Instead of reviewing multiple files, managers can monitor factory performance, identify issues quickly, and improve decision-making using one interactive dashboard.
In this comprehensive guide, you will learn everything about the Footwear Manufacturing KPI Dashboard in Power BI, including its features, structure, benefits, implementation process, best practices, and frequently asked questions.
What Is a Footwear Manufacturing KPI Dashboard in Power BI?
A Footwear Manufacturing KPI Dashboard in Power BI is a ready-to-use analytical solution designed to track key manufacturing performance indicators using interactive visuals and automated calculations.
The dashboard captures data in an Excel file and connects it to Power BI for dynamic reporting. As a result, users can analyze Month-to-Date (MTD) and Year-to-Date (YTD) performance instantly.
Unlike traditional reporting systems, this dashboard allows managers to:
-
Monitor KPI performance in real time
-
Compare targets with actual results
-
Evaluate trends across months and years
-
Identify operational gaps quickly
-
Make data-driven production decisions
Because Power BI supports interactive slicers, drill-through pages, and visual analytics, users gain deeper insights without complex manual calculations.
Why Is KPI Tracking Important in Footwear Manufacturing?
Footwear manufacturing involves multiple production stages such as cutting, stitching, assembly, finishing, and packaging. Each stage directly affects quality, cost, and delivery timelines.
However, without structured KPI tracking:
-
Production delays remain unnoticed
-
Quality issues increase rejection rates
-
Resource utilization becomes inefficient
-
Managers rely on assumptions instead of data
Therefore, KPI dashboards help manufacturers maintain operational control while improving productivity.
Key Objectives of KPI Monitoring
-
Improve production efficiency
-
Reduce manufacturing defects
-
Control operational costs
-
Increase on-time delivery performance
-
Enhance workforce productivity
-
Maintain consistent product quality
Overview of the Footwear Manufacturing KPI Dashboard Structure
The dashboard includes three powerful pages inside the Power BI Desktop application. Each page focuses on a specific analytical purpose. Consequently, users can analyze performance from summary level to detailed KPI definitions.
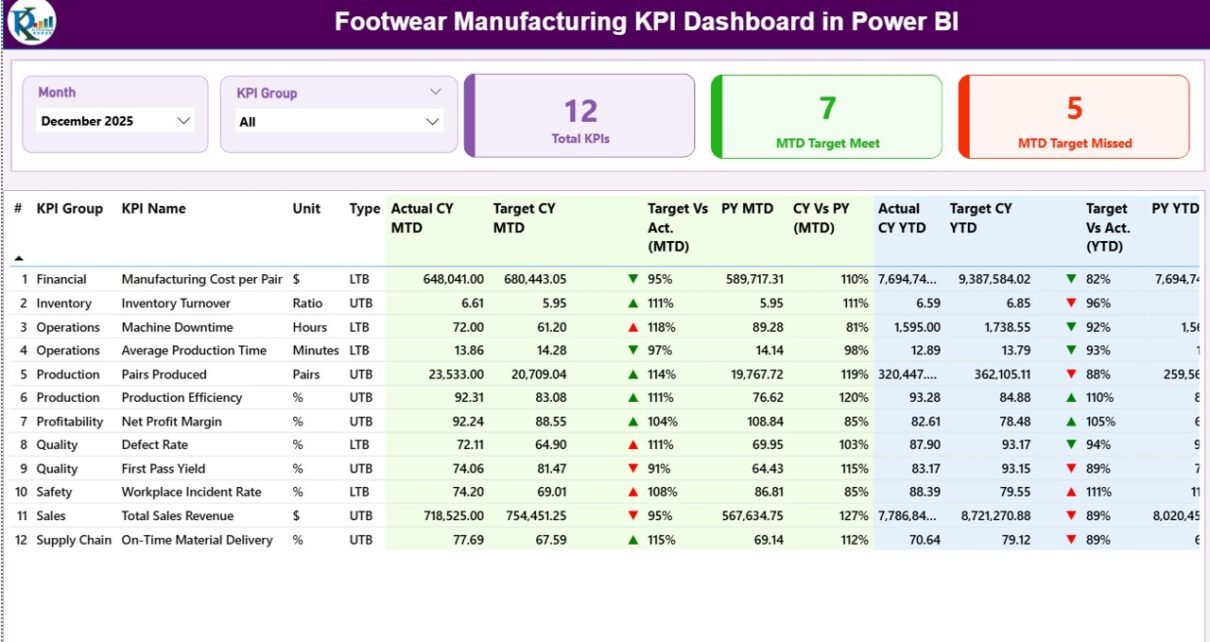
1️⃣ Summary Page – The Main Performance Control Center
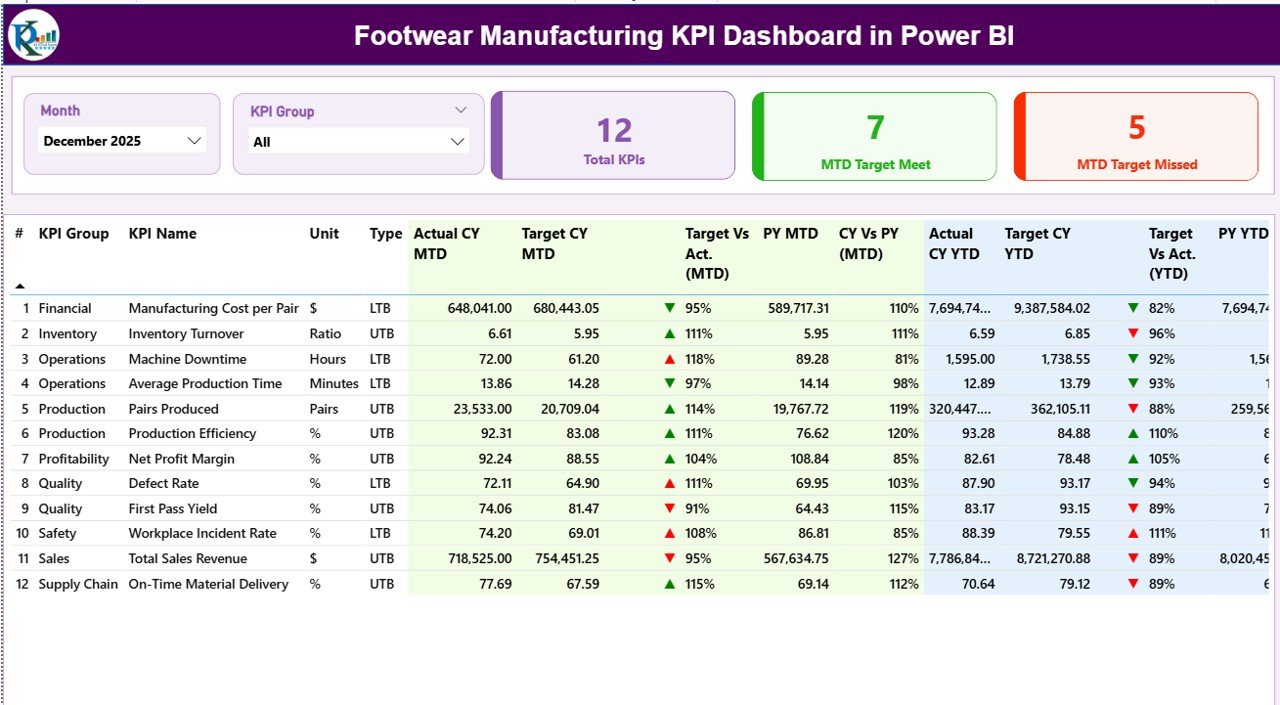
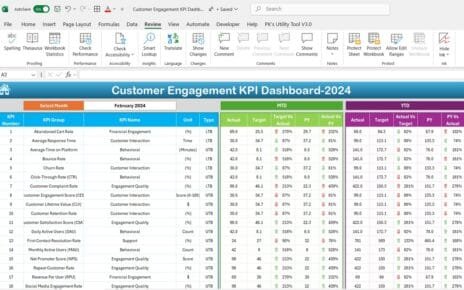
The Summary Page works as the central monitoring hub of the dashboard. It provides a complete overview of all KPIs in one place.
Top Section – Interactive Filters
At the top of the dashboard, users find:
-
Month Slicer – Select reporting month instantly
-
KPI Group Slicer – Filter KPIs by category
These slicers allow quick analysis without changing data manually.
KPI Performance Cards
The dashboard displays three important KPI cards:
-
Total KPI Count – Total number of monitored KPIs
-
MTD Target Meet Count – KPIs achieving targets
-
MTD Target Missed Count – KPIs below expectations
Because these cards update dynamically, managers instantly understand overall performance.
Detailed KPI Performance Table
Below the summary cards, a detailed table presents complete KPI analysis.
KPI Identification Columns
-
KPI Number – Sequential identifier
-
KPI Group – KPI category
-
KPI Name – Performance metric name
-
Unit – Measurement unit
-
Type –
-
LTB (Lower the Better)
-
UTB (Upper the Better)
-
MTD Performance Metrics
Click to Purchases Footwear Manufacturing KPI Dashboard in Power BI
-
Actual CY MTD – Current year MTD performance
-
Target CY MTD – MTD target value
-
MTD Icon – Visual indicator showing performance status
-
Target vs Actual (MTD) – Actual ÷ Target percentage
-
PY MTD – Previous year comparison value
-
CY vs PY (MTD) – Current vs previous performance comparison
These indicators help managers quickly evaluate monthly performance trends.
YTD Performance Metrics
Similarly, the dashboard tracks yearly progress:
-
Actual CY YTD
-
Target CY YTD
-
YTD Icon
-
Target vs Actual (YTD)
-
PY YTD
-
CY vs PY (YTD)
Because both MTD and YTD values appear together, decision-makers can analyze short-term and long-term performance simultaneously.
2️⃣ KPI Trend Page – Visual Performance Analysis
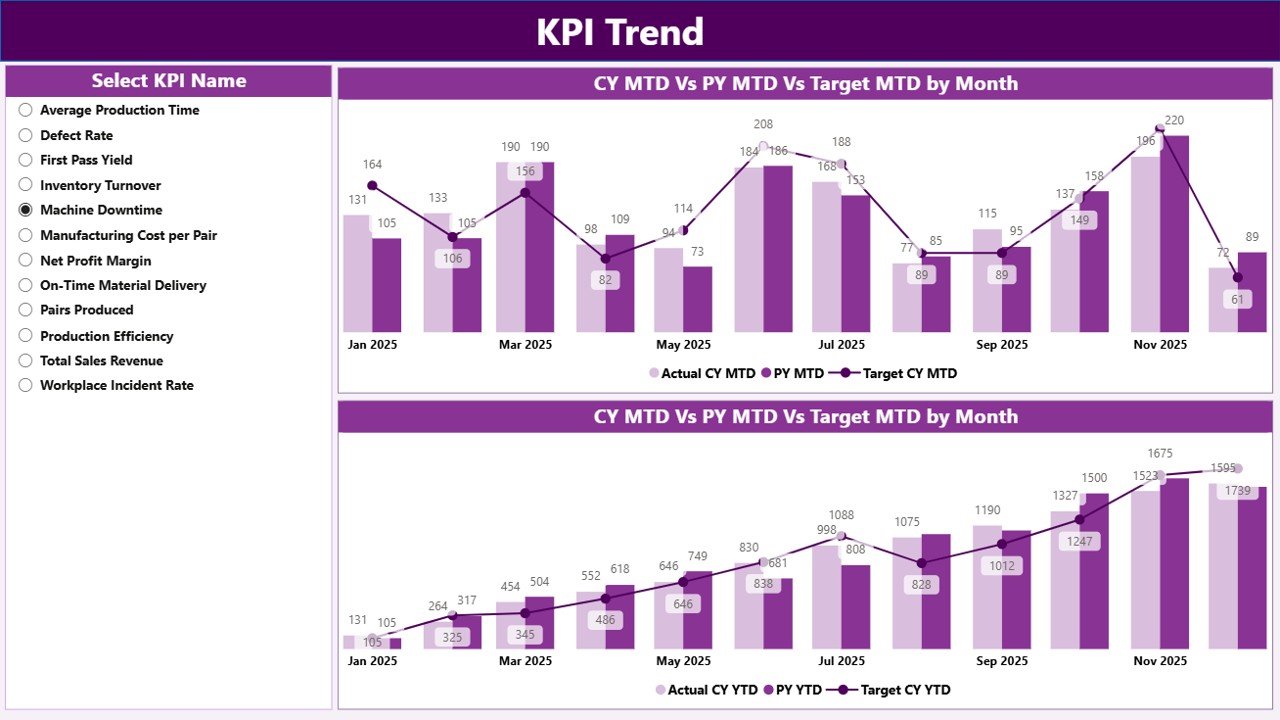
While the summary page shows status, the KPI Trend Page explains performance behavior over time.
Key Features
-
Two combo charts displaying:
-
Current Year Actuals
-
Previous Year Actuals
-
Target values
-
-
Separate visuals for:
-
MTD trends
-
YTD trends
-
A KPI selection slicer appears on the left side. Users simply choose a KPI to analyze performance trends instantly.
Why Trend Analysis Matters
Trend charts help managers:
-
Identify seasonal production patterns
-
Detect performance decline early
-
Evaluate improvement initiatives
-
Forecast future production outcomes
Therefore, teams can move from reactive decisions to proactive planning.
3️⃣ KPI Definition Page – Detailed KPI Explanation
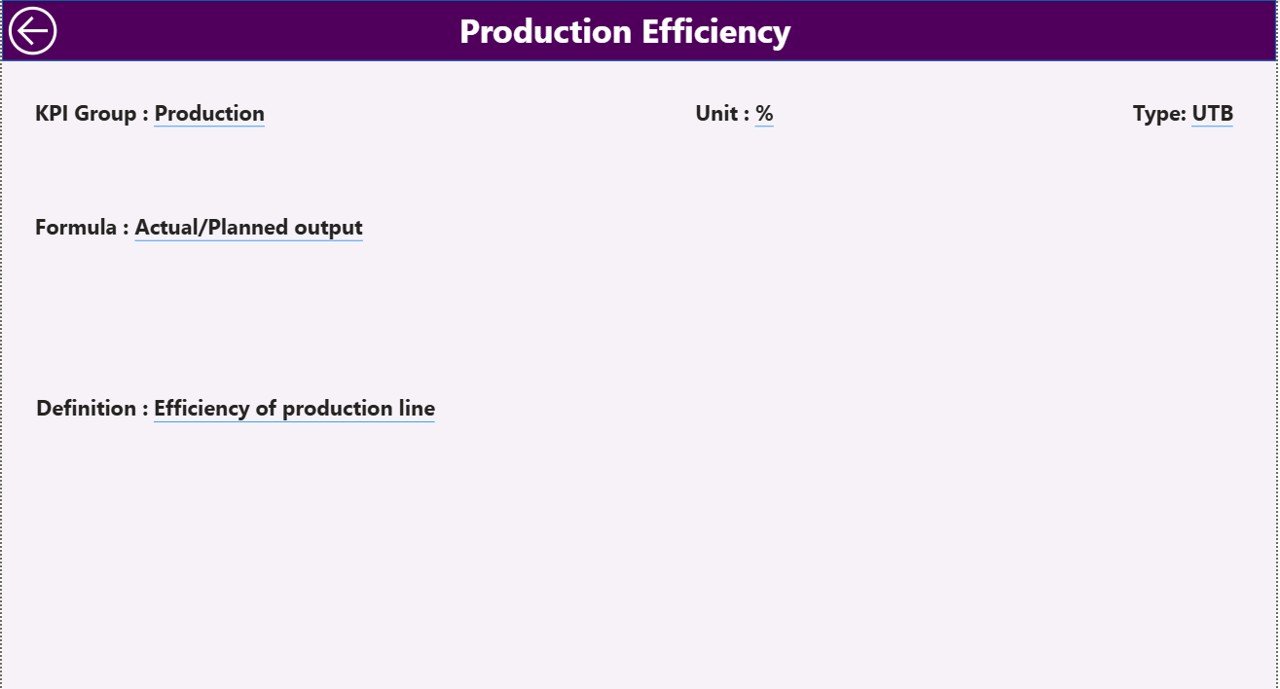
The KPI Definition Page acts as a drill-through page.
Users can access it directly from the summary page to view detailed KPI information such as:
-
KPI Formula
-
KPI Definition
-
Measurement logic
-
KPI Type (LTB or UTB)
The page remains hidden to maintain a clean interface. However, users can return easily using the back button located at the top left corner.
How Does the Excel Data Source Work?
Click to Purchases Footwear Manufacturing KPI Dashboard in Power BI
The dashboard uses an Excel file as the primary data source. This approach keeps data entry simple while maintaining analytical power.
The Excel file contains three worksheets.
1️⃣ Input_Actual Sheet
Users enter actual performance values here.
Required fields:
-
KPI Name
-
Month (first date of month)
-
MTD Value
-
YTD Value
Because Power BI refreshes automatically, updated numbers instantly reflect in the dashboard.
2️⃣ Input_Target Sheet
This sheet stores target values.
Users enter:
-
KPI Name
-
Month
-
Target MTD
-
Target YTD
Consequently, the dashboard compares performance against goals automatically.
3️⃣ KPI Definition Sheet
This sheet defines KPI structure.
Columns include:
-
KPI Number
-
KPI Group
-
KPI Name
-
Unit
-
Formula
-
Definition
-
Type (LTB or UTB)
Therefore, users maintain consistent KPI logic across departments.
What KPIs Can You Track in Footwear Manufacturing?
Manufacturers can track various KPIs such as:
-
Production Output Rate
-
Defect Percentage
-
Machine Utilization
-
Labor Productivity
-
Material Waste Ratio
-
Order Fulfillment Rate
-
On-Time Delivery Rate
-
Rework Percentage
-
Inventory Turnover
-
Cost per Pair Produced
Because the dashboard remains flexible, companies can customize KPIs based on factory goals.
Advantages of Footwear Manufacturing KPI Dashboard in Power BI
1. Centralized Performance Monitoring
Managers view all KPIs in one dashboard instead of multiple reports.
2. Faster Decision-Making
Visual indicators quickly highlight problems and opportunities.
3. Real-Time Insights
Data refresh enables up-to-date performance tracking.
4. Improved Productivity
Teams focus on measurable targets rather than assumptions.
5. Better Accountability
Departments clearly understand performance expectations.
6. Easy Comparison Analysis
Users compare:
-
Actual vs Target
-
Current Year vs Previous Year
-
Monthly vs Yearly performance
7. Scalable Solution
Organizations can add new KPIs anytime without redesigning reports.
How to Implement the Dashboard Successfully?
Step 1: Define Manufacturing KPIs
First, identify metrics aligned with production goals.
Step 2: Prepare Excel Data
Next, organize Actual and Target values properly.
Step 3: Connect Excel to Power BI
Import data using Power BI data connection.
Step 4: Validate Calculations
Ensure MTD and YTD formulas calculate correctly.
Step 5: Publish Dashboard
Share reports securely with stakeholders.
Step 6: Schedule Data Refresh
Maintain updated insights automatically.
Best Practices for the Footwear Manufacturing KPI Dashboard in Power BI
✅ Keep KPIs Relevant
Track only metrics that influence business decisions.
✅ Standardize KPI Definitions
Ensure every department understands measurement logic.
✅ Update Data Regularly
Frequent updates maintain dashboard reliability.
✅ Use Visual Indicators Wisely
Icons and colors should communicate status instantly.
✅ Monitor Trends, Not Just Numbers
Always analyze patterns over time.
✅ Train Users
Provide guidance so teams interpret data correctly.
✅ Review KPIs Periodically
Adjust metrics as business objectives evolve.
Common Challenges and How to Overcome Them
Click to Purchases Footwear Manufacturing KPI Dashboard in Power BI
Data Inconsistency
Create standardized input formats.
Too Many KPIs
Focus on critical performance indicators only.
Lack of User Adoption
Provide training and simplify dashboard navigation.
Manual Errors
Use validation rules in Excel sheets.
Who Can Benefit from This Dashboard?
-
Factory Managers
-
Production Supervisors
-
Operations Heads
-
Quality Control Teams
-
Supply Chain Managers
-
Business Analysts
-
Manufacturing Consultants
Because the dashboard simplifies analytics, both technical and non-technical users can benefit.
Why Choose Power BI for Manufacturing Analytics?
Power BI provides several advantages compared to traditional reporting tools:
-
Interactive visuals
-
Automatic data refresh
-
Drill-through analysis
-
Advanced calculations
-
Secure sharing options
-
Scalable reporting environment
Therefore, manufacturers gain enterprise-level analytics without expensive systems.
Future Scope of KPI Dashboards in Footwear Manufacturing
Manufacturing analytics continues evolving rapidly. Companies increasingly integrate dashboards with:
-
IoT production machines
-
ERP systems
-
Quality inspection software
-
Predictive analytics models
-
AI-based forecasting tools
As technology grows, KPI dashboards will become central to smart factories.
Conclusion
The Footwear Manufacturing KPI Dashboard in Power BI transforms complex manufacturing data into actionable insights. Instead of relying on manual analysis, manufacturers gain a structured system that monitors performance, tracks targets, and identifies improvement areas instantly.
Because the dashboard combines Excel data entry with Power BI visualization, organizations achieve both simplicity and analytical power. Moreover, interactive slicers, trend charts, and KPI comparisons allow leaders to make faster and smarter decisions.
Ultimately, companies that adopt KPI-driven monitoring improve efficiency, reduce costs, and maintain consistent product quality. Therefore, implementing a KPI dashboard becomes not just helpful but essential for modern footwear manufacturing operations.
Frequently Asked Questions (FAQs)
1. What is a KPI dashboard in footwear manufacturing?
A KPI dashboard tracks production performance metrics using visual analytics to improve decision-making.
2. Do I need advanced Power BI knowledge to use this dashboard?
No. Users only need to update Excel data, and the dashboard updates automatically.
3. Can I customize KPIs?
Yes. You can modify KPI definitions and add new metrics easily.
4. What does LTB and UTB mean?
-
LTB: Lower values indicate better performance.
-
UTB: Higher values indicate better performance.
5. How often should data be updated?
You should update data monthly or weekly depending on reporting needs.
6. Can this dashboard work for other manufacturing industries?
Yes. You can adapt it for apparel, textile, or assembly manufacturing.
7. Why compare current year with previous year?
Year-over-year comparison helps evaluate real performance improvement.
Visit our YouTube channel to learn step-by-step video tutorials