Freight forwarding plays a critical role in global trade and supply chain operations. Every day, freight forwarders manage shipments, coordinate with carriers, handle documentation, and ensure on-time delivery across borders. However, without proper performance tracking, even experienced logistics teams struggle to identify delays, cost overruns, and operational inefficiencies.
That is exactly why a Freight Forwarding KPI Dashboard in Excel becomes an essential management tool.
This article explains what a Freight Forwarding KPI Dashboard in Excel is, why it matters, how it works, its sheet-wise structure, data input process, advantages, best practices, and frequently asked questions. Moreover, the language remains easy to understand so that logistics managers, operations teams, and analysts can implement it without complexity.
Click to Purchases Freight Forwarding KPI Dashboard in Excel
What Is a Freight Forwarding KPI Dashboard in Excel?
A Freight Forwarding KPI Dashboard in Excel is a ready-to-use analytical template designed to track, monitor, and analyze key performance indicators of freight forwarding operations in one centralized Excel file.
Instead of working with multiple spreadsheets or manual reports, this dashboard consolidates all critical KPIs into a single, interactive view. As a result, users can instantly evaluate performance at both Month-to-Date (MTD) and Year-to-Date (YTD) levels.
Because this dashboard is built entirely in Excel, it remains cost-effective, flexible, and easy to customize for different freight forwarding businesses.
Why Do Freight Forwarders Need a KPI Dashboard?
Freight forwarding operations involve multiple moving parts such as shipments, transit times, costs, customer commitments, and compliance requirements. Therefore, managing everything without structured reporting becomes risky.
A Freight Forwarding KPI Dashboard in Excel helps because it:
-
Centralizes KPI tracking in one file
-
Shows MTD and YTD performance clearly
-
Compares actual vs target results
-
Highlights performance gaps instantly
-
Supports data-driven decisions
As a result, freight forwarders gain better control over operations and profitability.
How Does the Freight Forwarding KPI Dashboard in Excel Work?
This dashboard follows a simple and practical workflow.
-
Users enter actual, target, and previous year data in input sheets
-
The dashboard automatically calculates MTD and YTD values
-
Visuals update instantly when users change the selected month
Because of this structure, even users without advanced Excel skills can use the dashboard effectively.
What Are the Sheets Included in the Freight Forwarding KPI Dashboard in Excel?
This dashboard contains seven structured worksheets, each designed for a specific purpose.
What Is the Purpose of the Home Sheet?
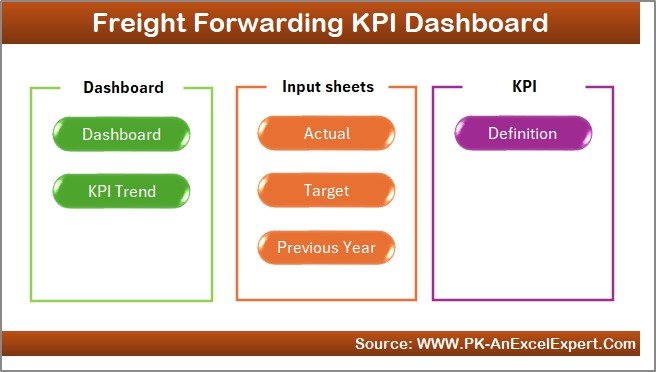
The Home Sheet acts as an index or navigation page.
Key Features of the Home Sheet
-
Clean and simple layout
-
Six navigation buttons
-
Quick access to all dashboard sections
Because of this design, users can move across the workbook easily without searching for sheet tabs.
Click to Purchases Freight Forwarding KPI Dashboard in Excel
What Does the Dashboard Sheet Show?
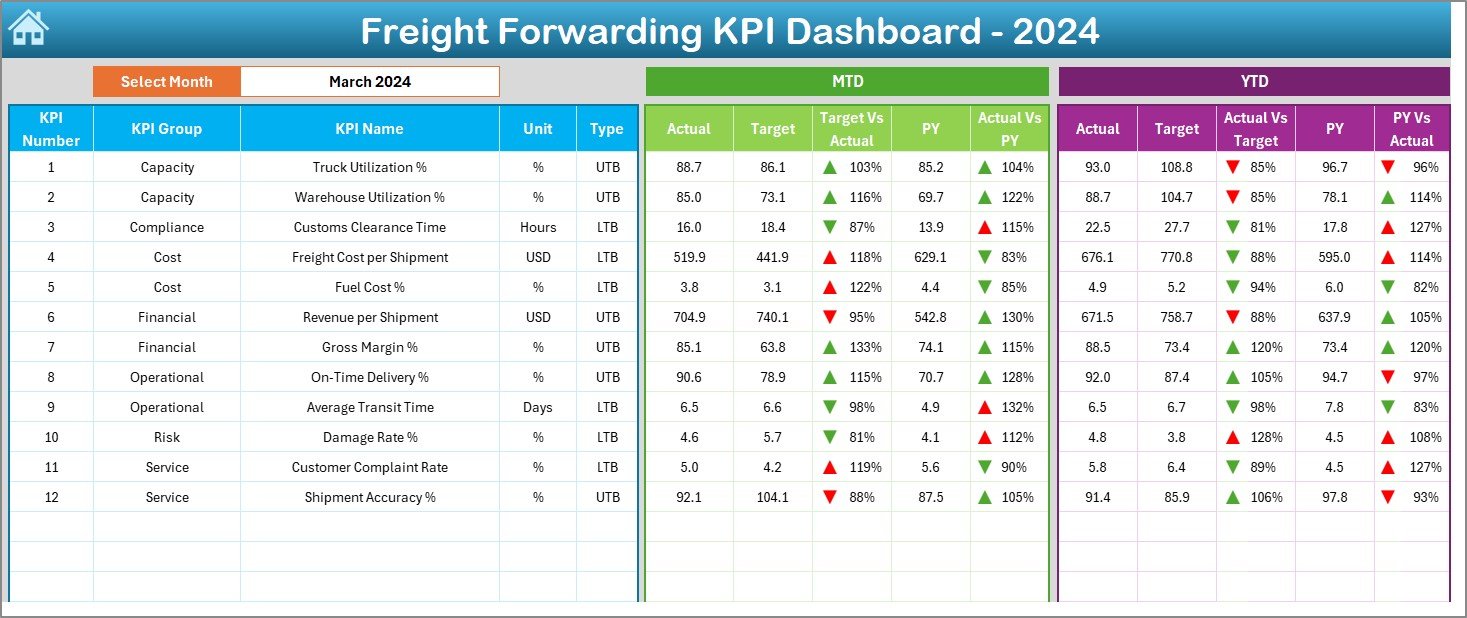
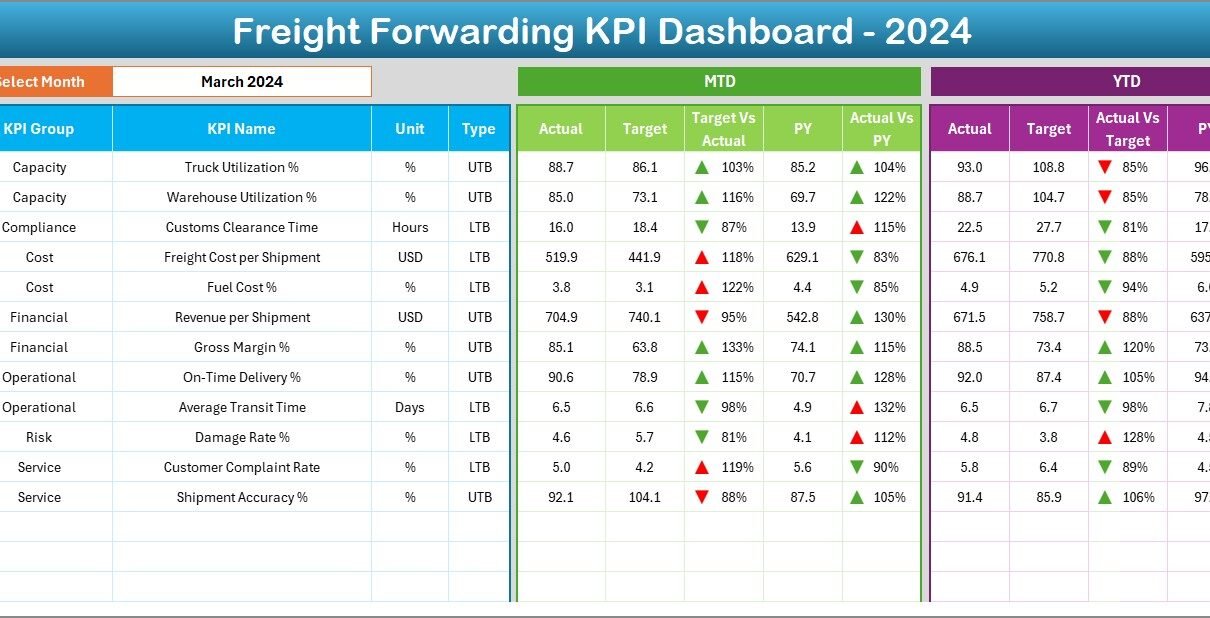
The Dashboard Sheet serves as the main performance overview page.
How Does the Month Selection Work?
On cell D3, users can select a month from a drop-down list. Once users change the month, the entire dashboard updates automatically.
This feature allows quick month-wise analysis without manual filtering.
What KPI Metrics Are Displayed on the Dashboard Sheet?
The dashboard displays detailed KPI performance using both MTD and YTD metrics.
What MTD Metrics Are Included?
For Month-to-Date analysis, the dashboard shows:
-
Actual MTD
-
Target MTD
-
Previous Year MTD
-
Target vs Actual (MTD %)
-
Previous Year vs Actual (MTD %)
-
Up and Down Arrows with Conditional Formatting
Green and red arrows help users identify performance status instantly.
What YTD Metrics Are Included?
For Year-to-Date analysis, the dashboard shows:
-
Actual YTD
-
Target YTD
-
Previous Year YTD
-
Target vs Actual (YTD %)
-
Previous Year vs Actual (YTD %)
-
Up and Down Arrows with Conditional Formatting
As a result, users can track both short-term execution and long-term trends together.
What Is the KPI Trend Sheet Used For?
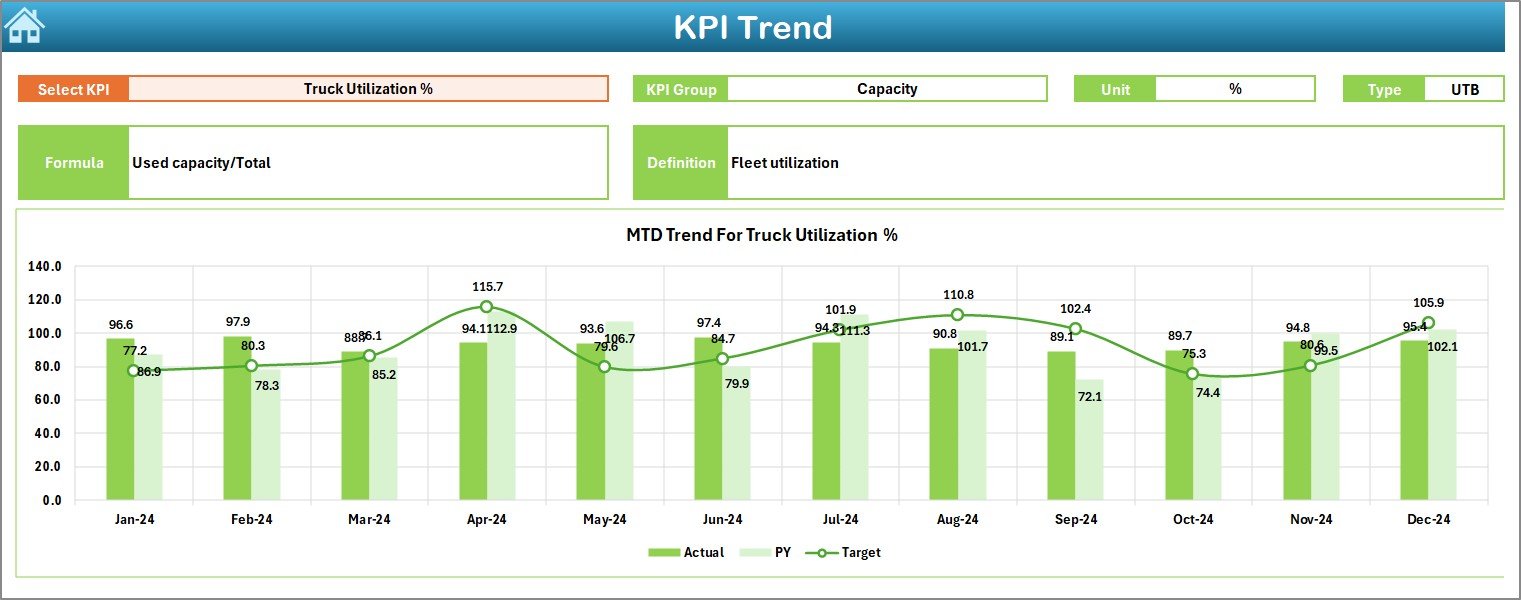
The KPI Trend Sheet focuses on trend analysis for individual KPIs.
How Do Users Select a KPI on the Trend Sheet?
On cell C3, users can select a KPI name from a drop-down list. Once selected, the sheet updates automatically.
What KPI Details Are Shown on the KPI Trend Sheet?
This sheet displays:
-
KPI Group
-
KPI Unit
-
KPI Type (Lower the Better or Upper the Better)
-
KPI Formula
-
KPI Definition
Because of this information, users clearly understand what the KPI measures and how it is calculated.
What Charts Are Displayed on the KPI Trend Sheet?
The sheet shows two key charts:
-
MTD Trend Chart for Actual, Target, and Previous Year
-
YTD Trend Chart for Actual, Target, and Previous Year
These charts help users analyze performance behavior over time.
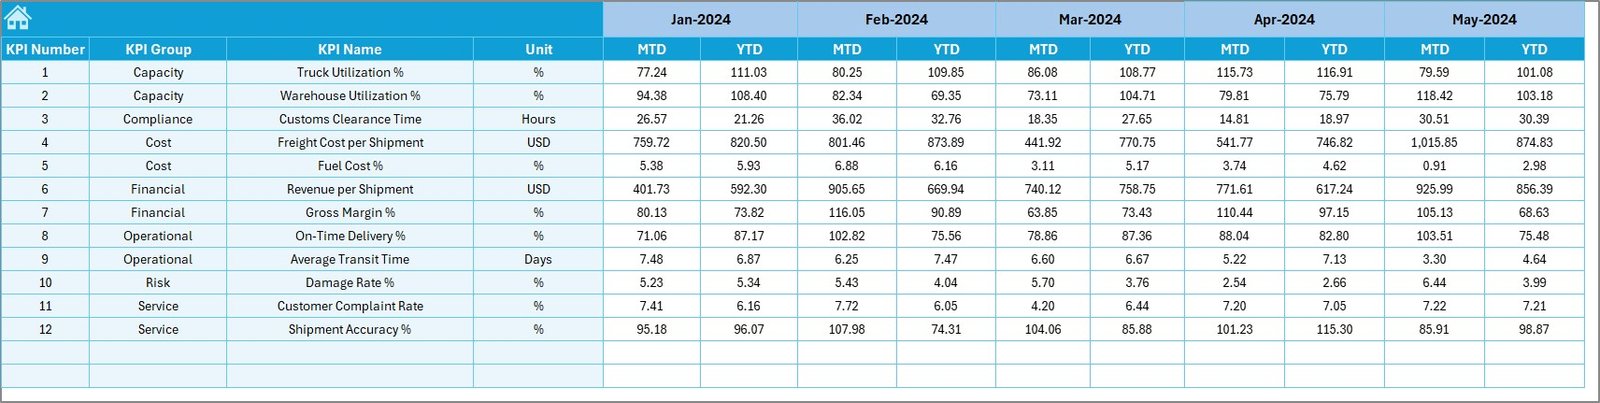
What Is the Actual Numbers Input Sheet?
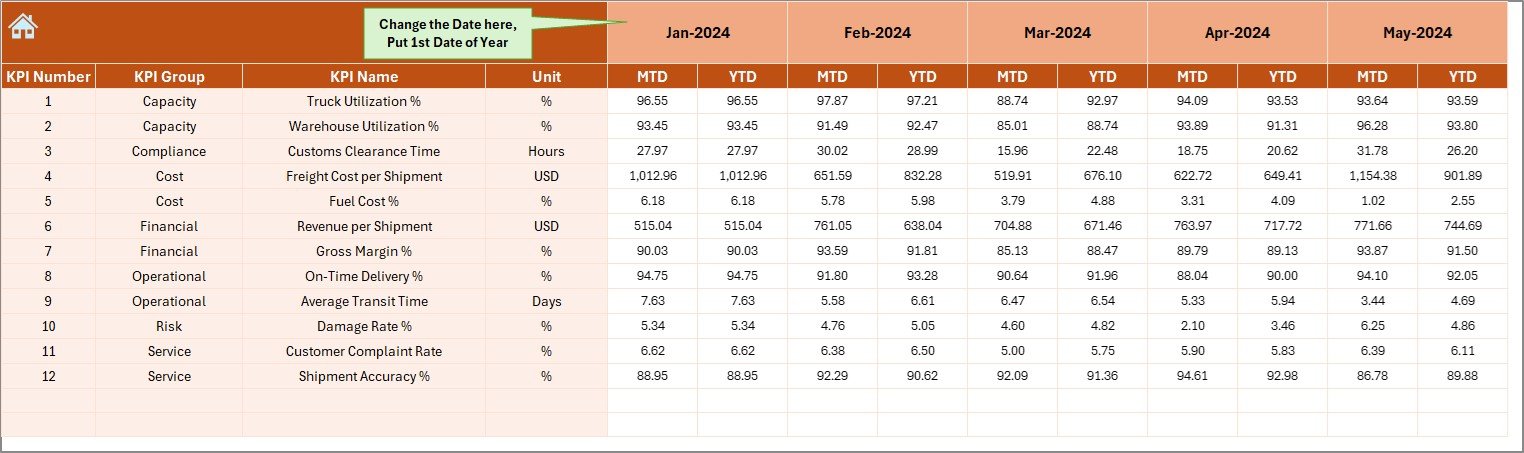
The Actual Numbers Input Sheet stores actual performance values.
How Do Users Enter Actual Data?
Users must:
-
Enter the first month of the year in cell E1
-
Select the month using the provided control
-
Enter MTD and YTD actual values for each KPI
Once users update this sheet, the dashboard updates automatically.
What Is the Target Sheet Used For?
The Target Sheet stores target values for each KPI.
What Data Is Entered in the Target Sheet?
Users must enter:
-
KPI-wise MTD target values
-
KPI-wise YTD target values
-
Data for each relevant month
This structure allows accurate comparison between actual and target performance.
What Is the Previous Year Number Sheet?
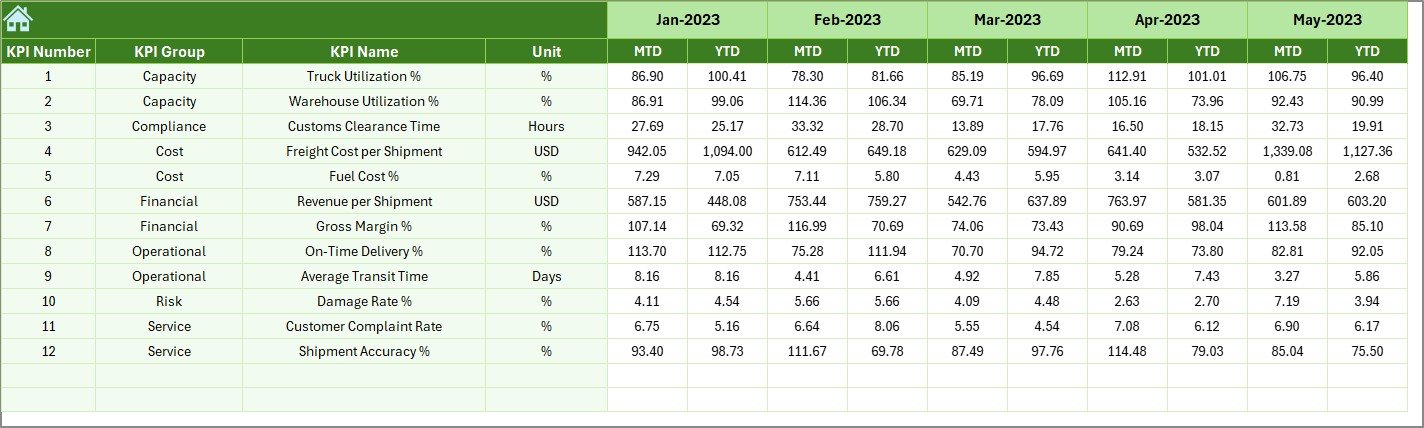
The Previous Year Number Sheet stores historical data.
Why Is Previous Year Data Important?
Previous year data allows users to:
-
Compare current performance with last year
-
Identify growth or decline patterns
-
Understand seasonal effects
Users must enter data in the same format as the current year.
What Is the KPI Definition Sheet?
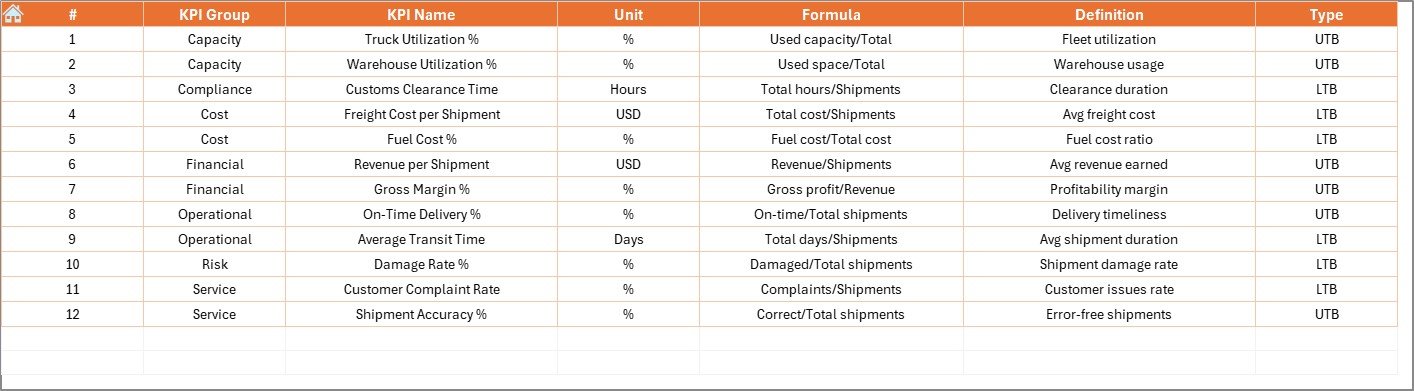
The KPI Definition Sheet acts as a master reference table.
What Information Is Stored in the KPI Definition Sheet?
Users must enter:
-
KPI Name
-
KPI Group
-
Unit of Measurement
-
KPI Formula
-
KPI Definition
Because of this structure, the dashboard remains standardized and easy to understand.
Click to Purchases Freight Forwarding KPI Dashboard in Excel
Advantages of Freight Forwarding KPI Dashboard in Excel
Using a Freight Forwarding KPI Dashboard in Excel offers several practical advantages.
Centralized Performance Tracking
All KPIs remain available in one Excel file. Therefore, users no longer manage multiple reports.
Faster Decision-Making
Automated calculations and visuals reduce reporting time significantly.
Clear Target Monitoring
MTD and YTD target comparisons highlight performance gaps clearly.
Trend-Based Insights
MTD and YTD trend charts help identify long-term patterns.
Easy Customization
Because the dashboard is built in Excel, users can modify KPIs easily.
Cost-Effective Solution
The dashboard does not require expensive BI tools or licenses.
Best Practices for the Freight Forwarding KPI Dashboard in Excel
Follow these best practices to get maximum value from the dashboard.
Define KPIs Clearly
Always document KPI formulas and definitions in the KPI Definition sheet.
Update Data Regularly
Enter actual, target, and previous year data on a fixed schedule.
Maintain Consistent Units
Use standardized units across all KPIs to avoid confusion.
Review Trends Monthly
Monthly reviews help detect delays and inefficiencies early.
Train Operations Teams
Train users to interpret KPIs correctly and consistently.
Who Should Use a Freight Forwarding KPI Dashboard in Excel?
This dashboard benefits:
-
Freight Forwarding Companies
-
Logistics Managers
-
Operations Teams
-
Supply Chain Analysts
-
Finance and Cost Control Teams
-
Business Owners
Both small freight forwarders and large logistics firms can use it effectively.
How Does This Dashboard Improve Freight Forwarding Operations?
This dashboard converts raw operational data into actionable insights. As a result:
-
Managers detect delays early
-
Teams control costs better
-
Service levels improve
-
Customer satisfaction increases
Over time, data-driven decisions lead to stronger operational performance.
Conclusion: Why Choose a Freight Forwarding KPI Dashboard in Excel?
A Freight Forwarding KPI Dashboard in Excel provides a simple yet powerful way to monitor logistics performance. It combines structured data input, automated calculations, and visual insights into one easy-to-use file.
For freight forwarders who want better visibility, accountability, and performance control, this dashboard becomes an essential operational tool.
Click to Purchases Freight Forwarding KPI Dashboard in Excel
Frequently Asked Questions (FAQs)
What is a Freight Forwarding KPI Dashboard in Excel?
It is an Excel-based dashboard that tracks freight forwarding KPIs using MTD and YTD metrics.
Can non-technical users use this dashboard?
Yes. Users only need basic Excel knowledge to enter data.
Does the dashboard support trend analysis?
Yes. It includes MTD and YTD trend charts for each KPI.
Can I add new KPIs later?
Yes. The dashboard supports easy KPI expansion.
Is this dashboard suitable for small freight forwarders?
Yes. It works well for both small and large logistics operations.
Does it support previous year comparison?
Yes. The dashboard compares current year data with previous year performance.
Click to Purchases Freight Forwarding KPI Dashboard in Excel
Visit our YouTube channel to learn step-by-step video tutorials