The esports industry grows faster than ever before. Teams, tournament organizers, gaming platforms, sponsors, and analysts now rely heavily on data to stay competitive. However, raw data alone does not create impact. You need structure, clarity, and actionable insights. That is exactly where a Gaming Esports KPI Dashboard in Excel becomes essential.
In this detailed guide, you will learn what a Gaming Esports KPI Dashboard in Excel is, why it matters, how it works, and how each worksheet supports smarter decision-making. Moreover, you will explore its advantages, best practices, and real-world use cases. Finally, you will find answers to the most frequently asked questions.
If you want a practical, ready-to-use, and professional solution for esports performance tracking, this article will guide you step by step.
Click to Purchases Gaming Esports KPI Dashboard in Excel
What Is a Gaming Esports KPI Dashboard in Excel?
A Gaming Esports KPI Dashboard in Excel is a structured performance management tool that tracks key performance indicators (KPIs) related to esports teams, players, tournaments, and operations. Instead of managing scattered spreadsheets and manual reports, you can monitor all KPIs in one interactive Excel dashboard.
This dashboard converts raw gaming and esports data into:
-
Clear KPIs
-
Month-to-date (MTD) and year-to-date (YTD) performance
-
Target vs Actual analysis
-
Previous year comparisons
-
Visual trends and indicators
Because Excel powers this dashboard, it remains flexible, scalable, and easy to customize for different esports formats and organizations.
Why Do Gaming and Esports Organizations Need KPI Dashboards?
Esports operates in a highly competitive and fast-moving environment. Therefore, decision-makers need instant clarity. A KPI dashboard supports that need in several ways.
Key Reasons Esports Teams Use KPI Dashboards
-
They track player and team performance consistently
-
They compare targets against actual results easily
-
They identify trends before problems escalate
-
They support data-driven coaching and strategy decisions
-
They provide professional reporting for sponsors and stakeholders
Moreover, Excel-based dashboards offer affordability and accessibility, which makes them ideal for startups and established esports organizations alike.
What KPIs Can You Track in a Gaming Esports KPI Dashboard?
A Gaming Esports KPI Dashboard in Excel supports a wide range of KPIs. Although the exact KPIs vary by organization, common categories include:
Performance KPIs
-
Win rate
-
Kill/death ratio
-
Average match duration
-
Accuracy percentage
-
Objectives completed
Engagement KPIs
-
Viewer growth
-
Stream watch time
-
Fan engagement rate
-
Social media reach
Financial KPIs
-
Tournament earnings
-
Sponsorship revenue
-
Cost per event
-
Prize distribution efficiency
Operational KPIs
-
Match participation rate
-
Training hours
-
Team availability
-
Event scheduling efficiency
Because the dashboard uses a KPI definition sheet, you can add or modify KPIs anytime without redesigning the entire system.
How Does the Gaming Esports KPI Dashboard in Excel Work?
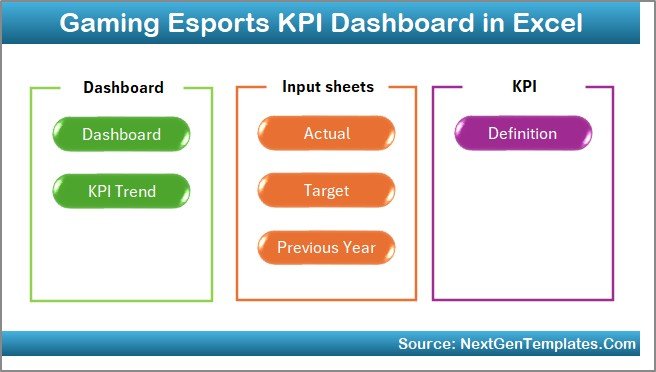
The Gaming Esports KPI Dashboard in Excel works through a structured worksheet design. Each sheet has a specific purpose. Together, they create a complete performance monitoring system.
Let’s break down all 7 worksheets in detail.
What Is the Purpose of the Home Sheet?
The Home Sheet acts as the navigation center of the dashboard.
Key Features of the Home Sheet
-
Acts as an index page
-
Contains 6 navigation buttons
-
Allows quick movement between sheets
-
Improves user experience and accessibility
Because esports managers often switch between analysis views, this centralized navigation saves time and avoids confusion.
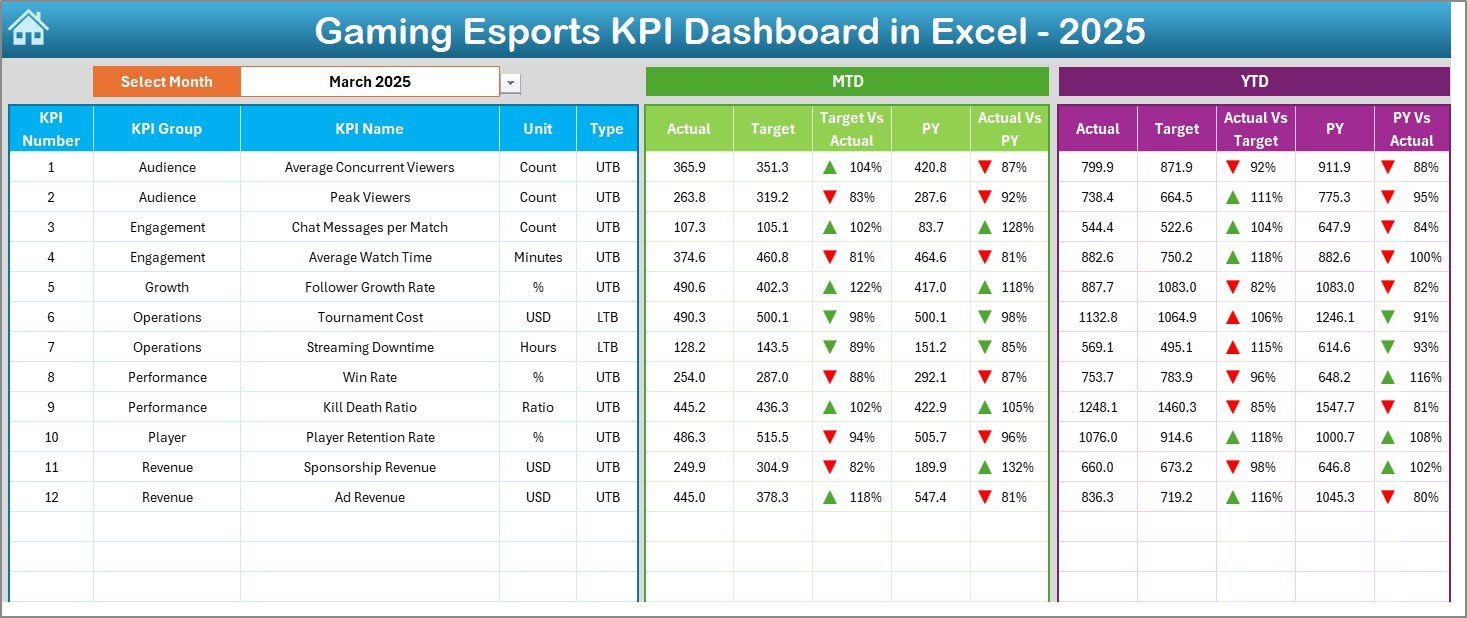
How Does the Dashboard Sheet Tab Show KPI Performance?
The Dashboard Sheet Tab serves as the main analytical view of the entire system.
Core Features of the Dashboard Sheet
-
Month selection drop-down at cell D3
-
Dynamic refresh of all KPIs based on selected month
-
Display of MTD Actual, Target, and Previous Year values
-
Display of YTD Actual, Target, and Previous Year values
-
Conditional formatting with up and down arrows
-
Target vs Actual comparison
-
Previous Year vs Actual comparison
-
Click to Purchases Gaming Esports KPI Dashboard in Excel
Why This Sheet Matters
Because everything updates automatically when you change the month, decision-makers instantly see performance changes. As a result, they can react faster and plan smarter.
How Does the KPI Trend Sheet Help Performance Analysis?
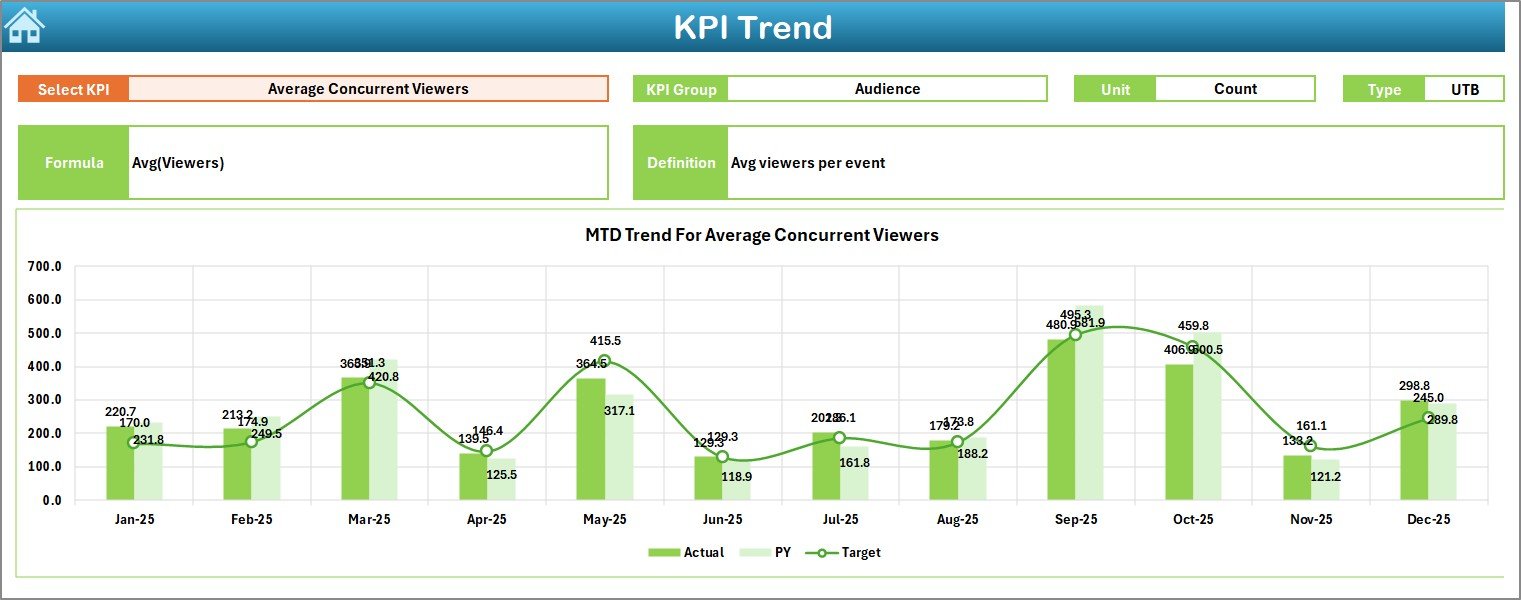
The KPI Trend Sheet Tab focuses on detailed KPI-level analysis.
What Can You Do on the KPI Trend Sheet?
-
Select KPI name from a drop-down at cell C3
-
View KPI Group
-
Check KPI Unit
-
Identify KPI Type:
-
Upper the Better (UTB)
-
Lower the Better (LTB)
-
-
Review KPI Formula
-
Understand KPI Definition clearly
Visual Insights
-
MTD trend chart for Actual, Target, and Previous Year
-
YTD trend chart for Actual, Target, and Previous Year
Because trends reveal performance direction, this sheet helps coaches, analysts, and managers understand whether performance improves or declines over time.
Why Is the Actual Numbers Input Sheet Important?
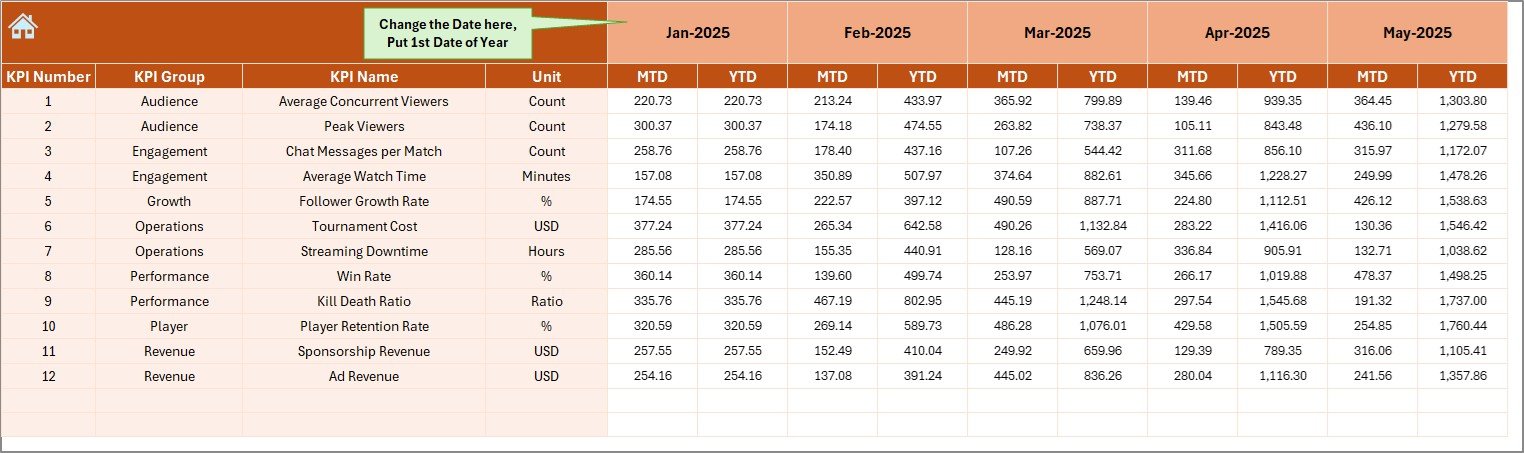
The Actual Numbers Input Sheet is the foundation of accurate reporting.
Key Functions
-
Enter actual KPI values for each month
-
Control the financial or performance year start from cell E1
-
Automatically calculate MTD and YTD values
Because clean input ensures reliable output, this sheet keeps your dashboard accurate and trustworthy.
What Is the Role of the Target Sheet Tab?
The Target Sheet Tab defines success benchmarks.
Why Targets Matter
Targets guide teams toward measurable goals. Without targets, performance lacks direction.
Features of the Target Sheet
-
Enter monthly MTD targets
-
Enter cumulative YTD targets
-
Align team goals with organizational strategy
Once targets exist, the dashboard automatically compares them against actual results.
How Does the Previous Year Number Sheet Improve Analysis?
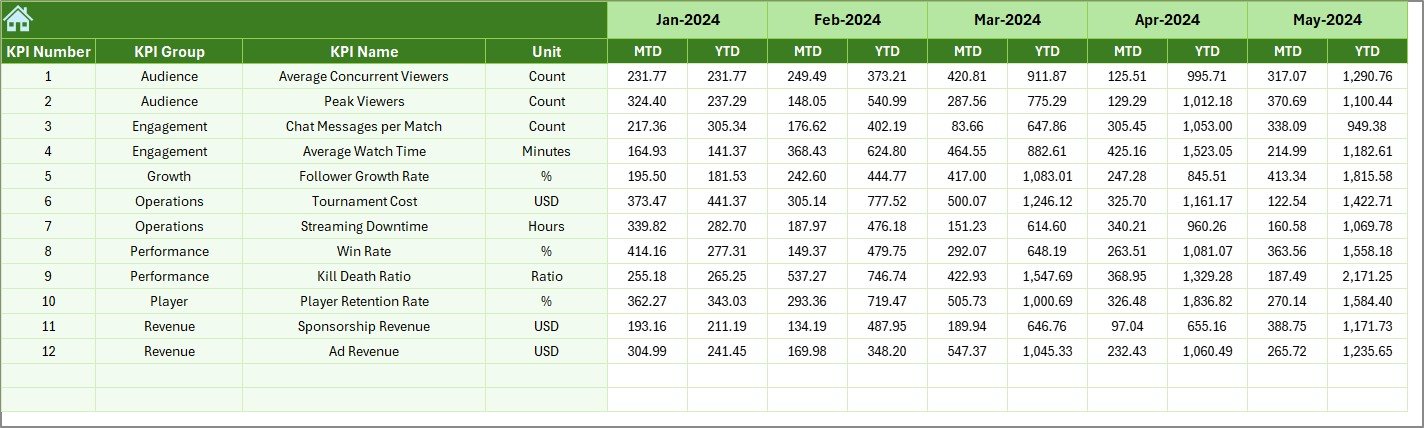
The Previous Year Number Sheet Tab allows year-over-year performance comparison.
Click to Purchases Gaming Esports KPI Dashboard in Excel
Benefits of Previous Year Comparison
-
Identify growth trends
-
Detect seasonal performance patterns
-
Evaluate long-term improvement
-
Provide context for current performance
By entering historical data once, you unlock deeper insights across all dashboard views.
Why Is the KPI Definition Sheet Critical?
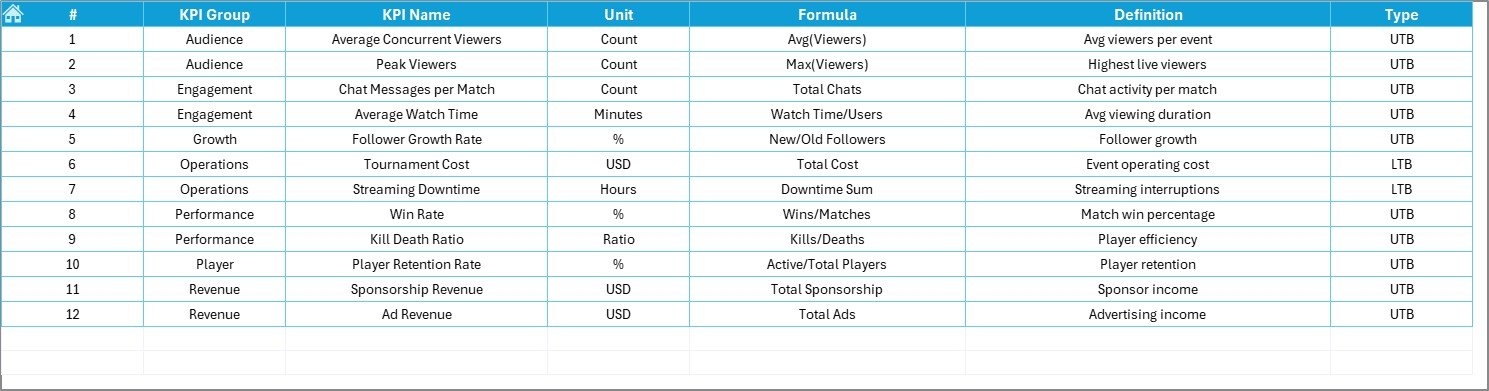
The KPI Definition Sheet Tab ensures clarity and consistency.
What You Define Here
-
KPI Name
-
KPI Group
-
KPI Unit
-
KPI Formula
-
KPI Definition
Because everyone views KPIs differently, this sheet creates a single source of truth across teams and stakeholders.
Advantages of Gaming Esports KPI Dashboard in Excel
Using a Gaming Esports KPI Dashboard in Excel offers multiple advantages.
Strategic Advantages
-
Centralized KPI tracking
-
Faster decision-making
-
Improved performance visibility
-
Consistent reporting standards
Operational Advantages
-
Easy data input
-
Automated calculations
-
Flexible KPI management
-
No coding required
Financial Advantages
-
No expensive software licenses
-
Reduced reporting effort
-
Higher ROI on analytics
Because Excel already exists in most organizations, this dashboard delivers value immediately.
Who Can Benefit from a Gaming Esports KPI Dashboard?
This dashboard serves multiple stakeholders across the esports ecosystem.
Ideal Users
-
Esports team managers
-
Coaches and analysts
-
Tournament organizers
-
Gaming startups
-
Sponsorship managers
-
Content and community managers
Because each role focuses on different KPIs, the dashboard adapts easily to varied needs.
How Can You Customize a Gaming Esports KPI Dashboard in Excel?
Click to Purchases Gaming Esports KPI Dashboard in Excel
Customization plays a key role in long-term usability.
Customization Options
-
Add new KPIs
-
Modify KPI formulas
-
Adjust targets by season
-
Change chart formats
-
Rebrand with team colors and logos
Because the dashboard structure remains flexible, it grows with your organization.
Best Practices for the Gaming Esports KPI Dashboard in Excel
To maximize value, follow these best practices.
1. Define KPIs Clearly
Always write clear definitions in the KPI Definition sheet. This practice avoids confusion and misinterpretation.
2. Keep Data Entry Consistent
Enter data regularly and follow the same units and formats every month.
3. Review Trends Monthly
Do not wait until the season ends. Instead, analyze trends every month to act early.
4. Align KPIs with Goals
Ensure every KPI supports a strategic or operational objective.
5. Avoid KPI Overload
Track what matters most. Too many KPIs reduce focus and clarity.
6. Validate Targets Periodically
Review targets quarterly and adjust them if conditions change.
Common Challenges in Esports KPI Tracking and How Excel Solves Them
Challenge 1: Scattered Data
Excel centralizes all KPIs in one dashboard.
Challenge 2: Manual Reporting
Automated calculations eliminate repetitive work.
Challenge 3: Lack of Trend Visibility
Trend charts reveal performance direction clearly.
Challenge 4: Inconsistent Definitions
The KPI Definition sheet enforces standardization.
How Does This Dashboard Support Data-Driven Esports Strategy?
A Gaming Esports KPI Dashboard in Excel transforms numbers into insights.
Because it combines:
-
Actual performance
-
Targets
-
Historical data
-
Visual trends
You gain a 360-degree view of esports performance. As a result, decisions become proactive instead of reactive.
Conclusion: Why Should You Use a Gaming Esports KPI Dashboard in Excel?
A Gaming Esports KPI Dashboard in Excel offers a powerful yet simple way to track, analyze, and improve esports performance. It replaces guesswork with data, confusion with clarity, and delays with timely insights.
Because it includes structured worksheets, dynamic visuals, and standardized KPIs, it supports smarter decisions across teams and organizations. Whether you manage a professional esports team or a growing gaming startup, this dashboard equips you with everything needed to stay competitive.
Frequently Asked Questions (FAQs)
What is a Gaming Esports KPI Dashboard in Excel?
It is an Excel-based performance tracking tool that monitors esports KPIs using MTD, YTD, target, and trend analysis.
Can beginners use this dashboard?
Yes. The dashboard uses simple Excel features and clear navigation, making it beginner-friendly.
Do I need advanced Excel skills?
No. Basic Excel knowledge is enough to operate and maintain the dashboard.
Can I add my own KPIs?
Yes. You can easily add or modify KPIs using the KPI Definition sheet.
Does the dashboard support multiple months?
Yes. You can select months dynamically and view both MTD and YTD performance.
Is this dashboard suitable for professional esports teams?
Absolutely. The structure supports professional-level analysis and reporting.
Can I use this dashboard for sponsors and reporting?
Yes. The visuals and comparisons make it ideal for stakeholder presentations.
Visit our YouTube channel to learn step-by-step video tutorials