Hospital Patient Flow Dashboard in Excel
Hospital Patient Flow Dashboard in Excel is a powerful, ready-to-use analytics template built for healthcare professionals who want to track, analyze, and optimize patient movement across hospital departments. Whether you are a hospital administrator monitoring treatment costs, a quality improvement manager tracking readmission rates, or a clinical operations lead comparing departmental wait times — this Excel dashboard delivers actionable insights across 5 interactive pages. It is designed with pivot tables and slicers so your data stays dynamic, filterable, and presentation-ready without writing a single formula.
This template is part of our growing library of Excel Dashboard Templates and Healthcare Templates at NextGenTemplates.com.
Key Features of Hospital Patient Flow Dashboard in Excel
- 5 interactive dashboard pages: Overview, Department Analysis, Patient Demographics, Capacity Flow, and Quality Metrics
- 5 KPI cards on the Overview page: Total Treatment Cost, Total Records, Avg. Length of Stay, Avg. Wait Time, and Avg. Satisfaction
- 20+ charts and visualizations across all pages for comprehensive hospital analytics
- Dynamic slicers for instant filtering by department, admission type, ward, date range, and more
- Pivot table architecture — all charts refresh automatically when data is updated
- Dedicated Data Sheet for plug-and-play data entry
- Hidden Support Sheet containing all pivot tables that power the dashboard
- Professional healthcare-themed design suitable for board meetings and quality reviews
Dashboard Pages Explained
1. Overview Page
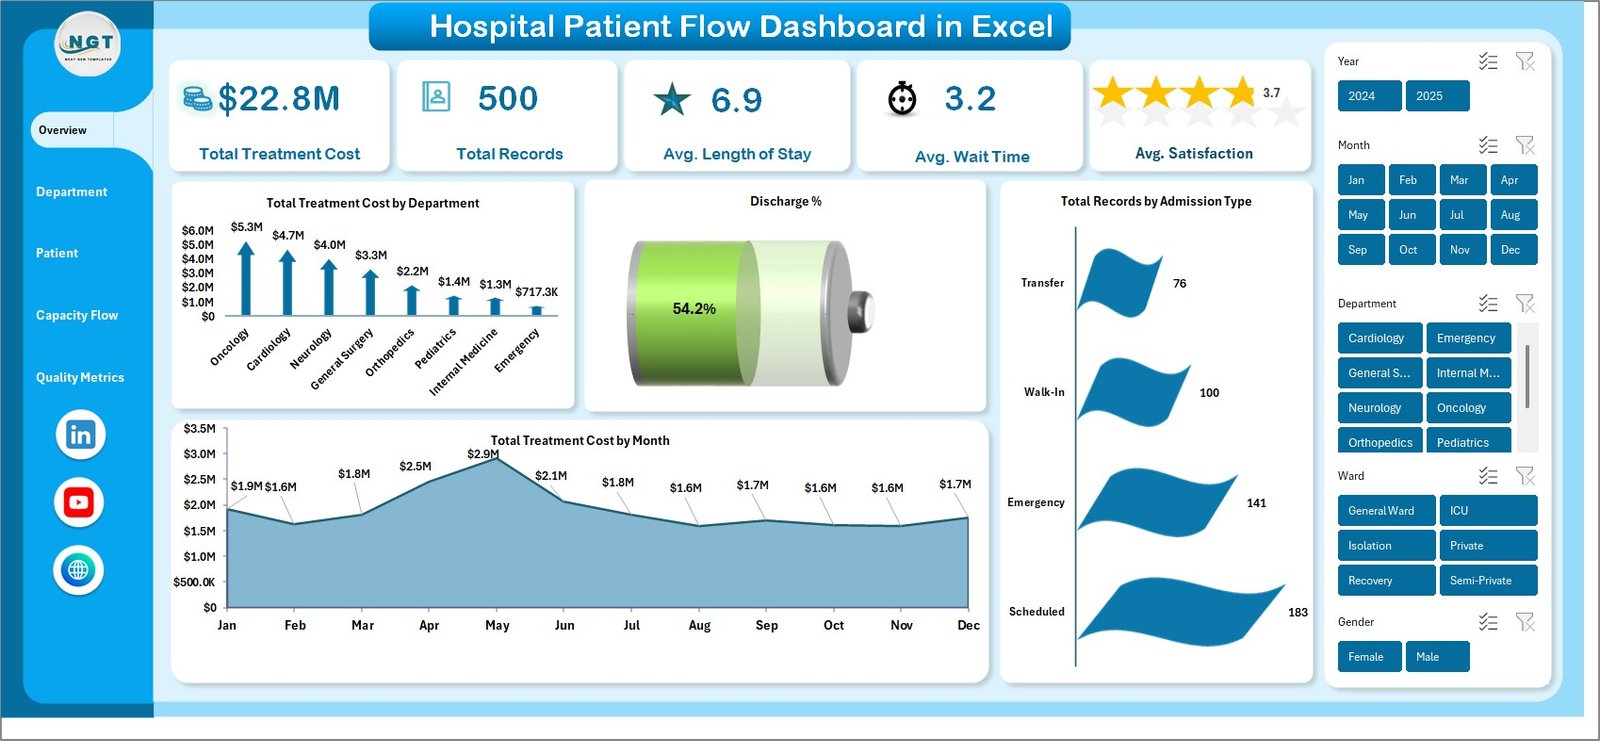
The Overview page serves as the command center of the Hospital Patient Flow Dashboard. At the top, you will find 5 key metric cards that give you a quick snapshot of hospital performance: Total Treatment Cost, Total Records, Avg. Length of Stay, Avg. Wait Time, and Avg. Satisfaction. These cards provide high-level numbers so leadership can assess hospital operations at a glance.
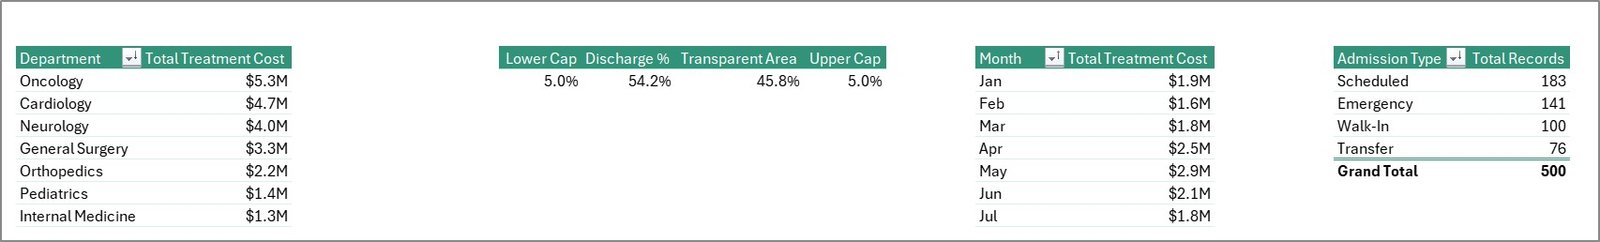
Below the cards, the page features several analytical charts. The Total Treatment Cost by Department chart breaks down spending across hospital departments, helping you identify where costs are concentrated. The Discharge Percentage visualization shows the proportion of patients discharged versus those still admitted or transferred. The Total Treatment Cost by Month chart reveals seasonal or monthly spending trends. Finally, Total Records by Admission Type helps you understand the mix of emergency, elective, and urgent admissions flowing through the hospital.
Multiple slicers are positioned on this page so you can instantly filter all data by department, date, admission type, or other dimensions.
Overview Page
2. Department Analysis
The Department Analysis page dives deeper into how each hospital department performs across critical operational metrics. The Avg. Length of Stay vs Avg. Wait Time by Department chart lets you compare which departments keep patients longer and which have bottlenecks in wait times — a crucial metric for identifying process inefficiencies.
The Avg. Satisfaction by Department chart reveals patient experience scores across units, helping quality teams prioritize improvement initiatives. Total Records by Ward shows patient volume distribution, while Total Treatment Cost by Diagnosis Category breaks down spending by medical conditions treated — essential for financial planning and resource allocation.

Department Analysis
3. Patient Demographics
Understanding your patient base is essential for strategic planning. The Patient Demographics page breaks down hospital records across four dimensions. Total Records by Gender shows the male-female distribution of patients. Total Treatment Cost by Insurance Type helps you understand payer mix and revenue streams from different insurance providers.
Total Records by Discharge Status tracks outcomes — how many patients were discharged home, transferred, or had other dispositions. Total Treatment Cost by Admission Type compares costs across emergency, elective, and urgent admissions, giving finance teams the data needed for budgeting and forecasting.
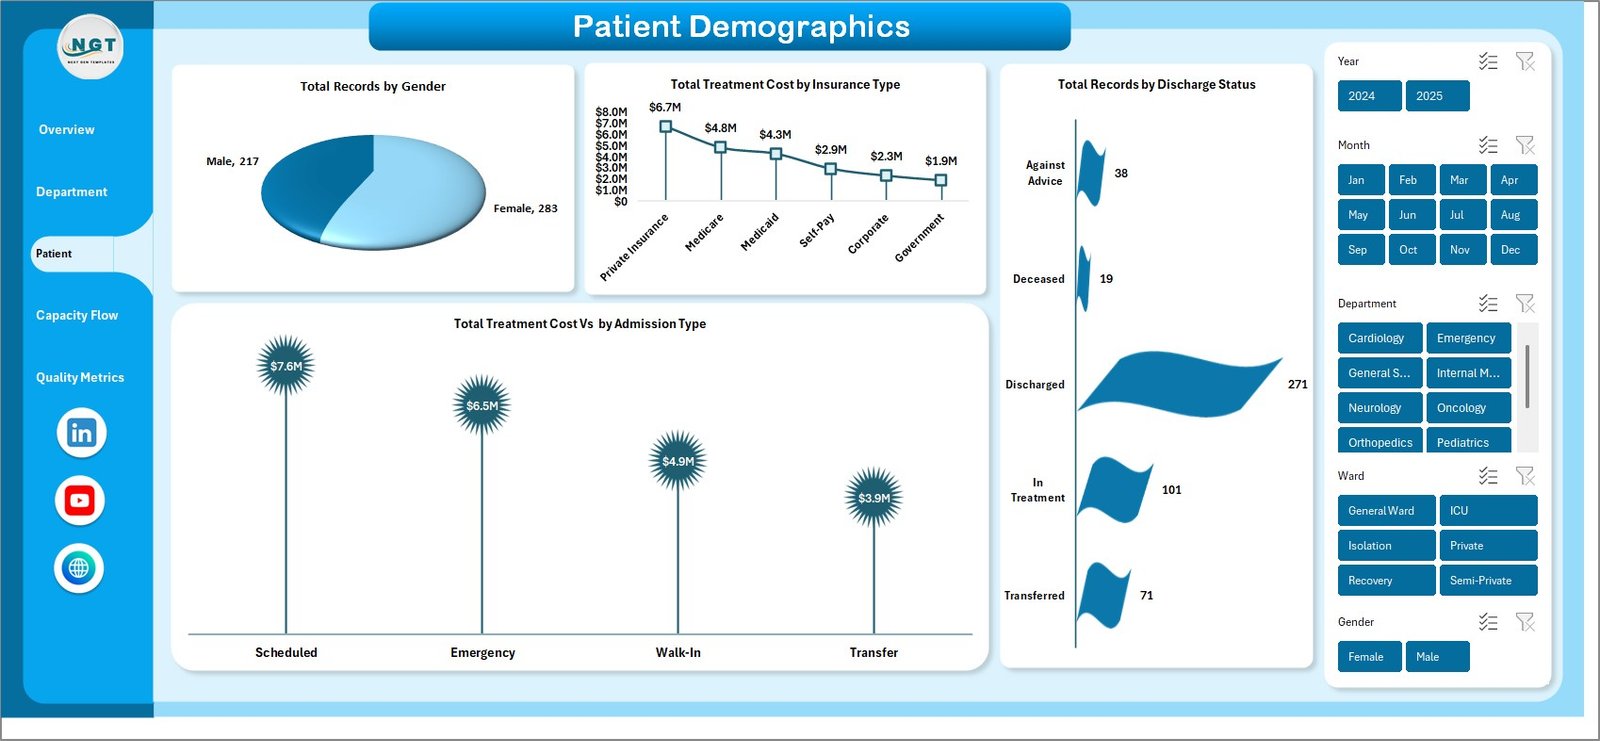
Patient Demographics
4. Capacity Flow
The Capacity Flow page focuses on hospital resource utilization and throughput. Total Treatment Cost by Bed Type reveals spending patterns across ICU beds, general beds, and specialty beds. Total Treatment Cost Percentage by Ward shows which wards consume the largest share of hospital costs.
The Total Treatment Cost by Year chart provides a longitudinal view of spending trends, helping administrators spot growth patterns. Total Records vs Total Discharge by Month compares intake against outflow, highlighting months where capacity strain is highest — critical for staffing and bed management decisions.
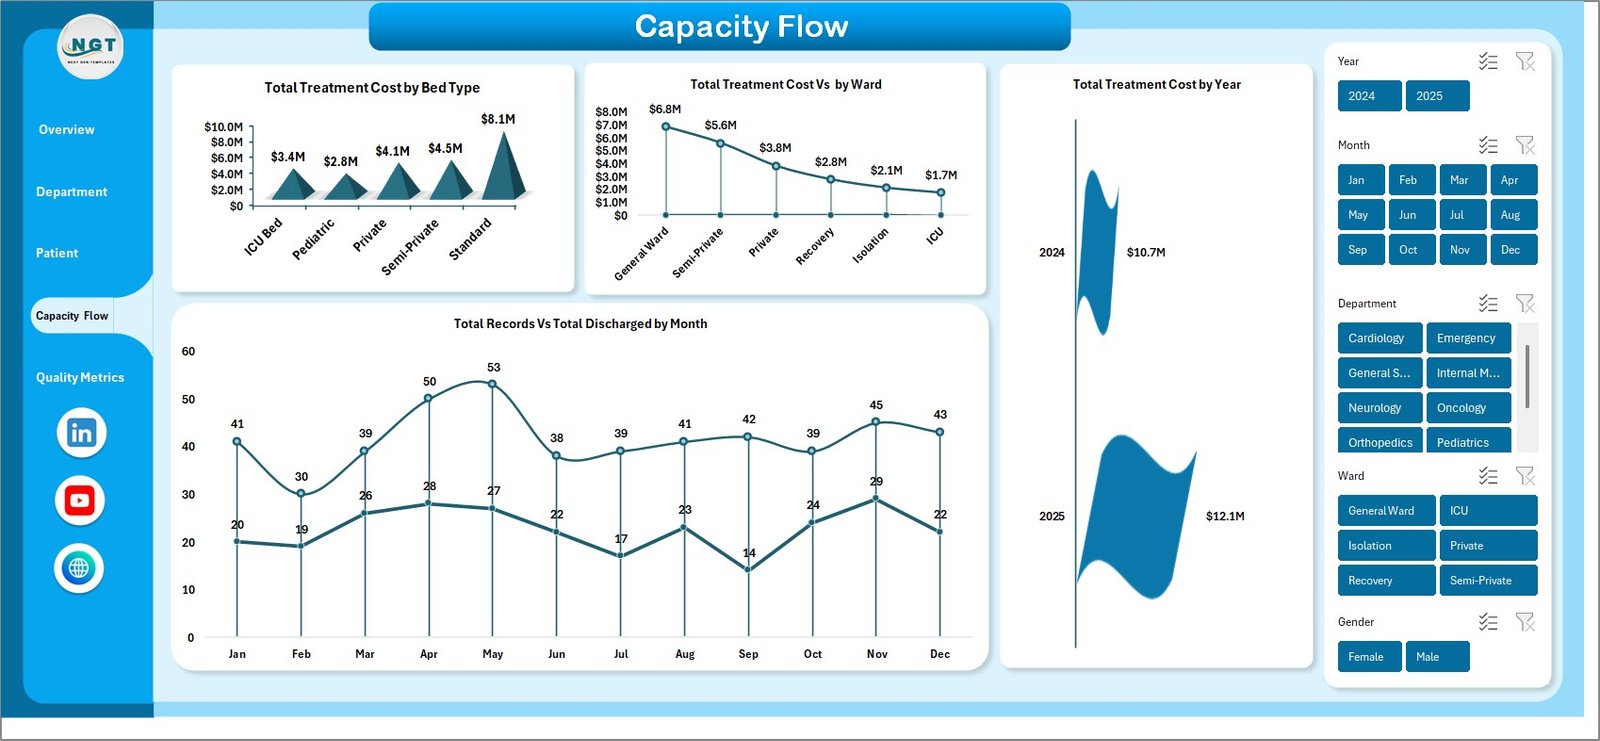
Capacity Flow
5. Quality Metrics
Quality of care is the cornerstone of hospital operations. This page tracks Total Readmissions by Department, shining a light on which departments have the highest return rates — a key indicator of care quality and discharge planning effectiveness. Avg. Satisfaction by Attending Physician gives granular feedback on individual physician performance.
Avg. Length of Stay by Diagnosis Category helps clinical teams benchmark treatment timelines. Total Treatment Cost by Readmission separates first-visit costs from readmission costs, enabling administrators to quantify the financial impact of preventable readmissions.
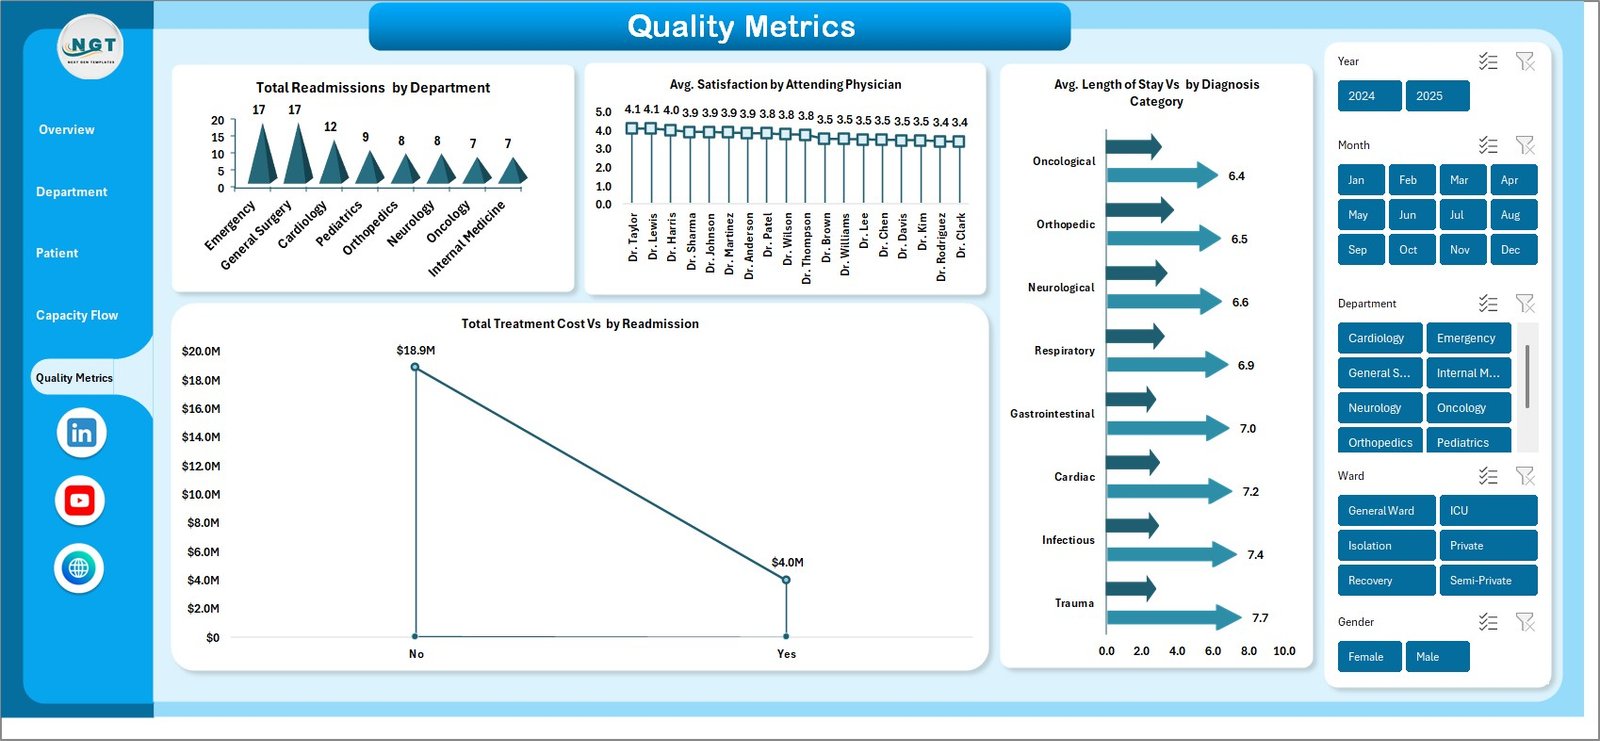
Quality Metrics
6. Data Sheet
The Data Sheet is where you input your hospital patient records. The template comes pre-loaded with sample data so you can explore the dashboard immediately. When you are ready to use your own data, simply replace the sample records keeping the same column structure. Fields typically include patient ID, admission date, discharge date, department, diagnosis, ward, bed type, insurance type, treatment cost, satisfaction score, and readmission status.
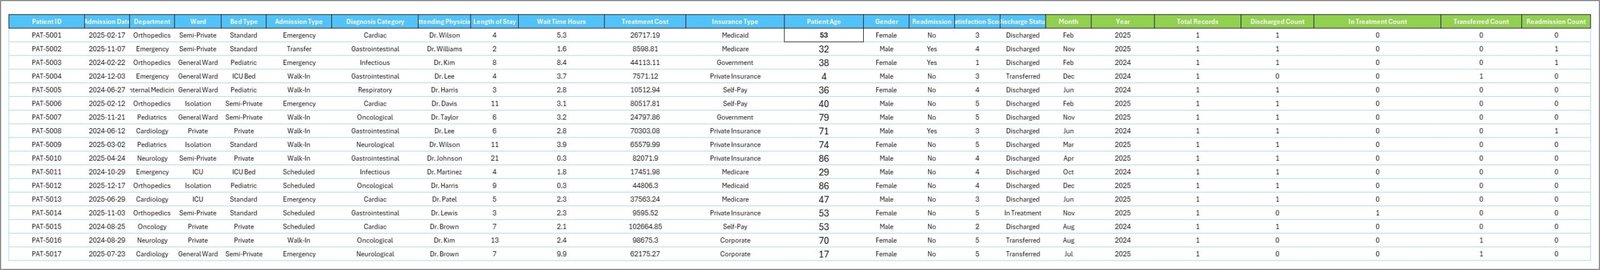
Data Sheet Tab
7. Support Sheet
The Support Sheet contains all the pivot tables that power every chart and KPI card in the dashboard. After updating your data in the Data Sheet, navigate to the Data tab in the Excel Ribbon and click Refresh All. Every pivot table recalculates, and every chart across all 5 dashboard pages updates automatically. You can keep this sheet hidden during presentations for a clean user experience.
Support Sheet Tab
Advantages of Hospital Patient Flow Dashboard in Excel
- No coding or VBA required — everything runs on native Excel pivot tables and slicers
- Instant data refresh — update your data sheet and click Refresh All for real-time analytics
- Multi-dimensional analysis — slice data by department, ward, admission type, insurance, gender, bed type, and more
- Presentation-ready — professional design suitable for hospital board meetings and quality reviews
- Cost tracking — detailed treatment cost analysis by department, diagnosis, year, and readmission status
- Quality monitoring — built-in readmission tracking and physician satisfaction analysis
Opportunities for Improvement
- Adding a predictive analytics layer using Excel’s FORECAST functions could help estimate future patient volumes and treatment costs
- Integration with hospital EHR/EMR export formats would streamline data import and reduce manual entry
- A real-time connection to a database (using Power Query) could automate data refreshes beyond manual Refresh All clicks
- Adding conditional formatting alerts for KPIs exceeding thresholds (e.g., readmission rate above 15%) would improve proactive management
Best Practices for Using This Dashboard
- Refresh regularly — update the data sheet weekly or monthly and always click Refresh All before reviewing charts
- Maintain data consistency — keep department names, ward names, and diagnosis categories consistent to avoid pivot table fragmentation
- Use slicers strategically — combine multiple slicer selections to drill into specific patient cohorts or time periods
- Present one page at a time — each dashboard page tells a different story; present them sequentially in meetings
- Benchmark over time — compare monthly or yearly data to identify trends rather than looking at snapshots in isolation
Explore Relevant Templates
If you found this Hospital Patient Flow Dashboard useful, explore these related healthcare templates from NextGenTemplates:
- Dental Practice Dashboard in Excel — Track dental clinic KPIs including patient visits, revenue, and treatment outcomes
- Blood Banks Dashboard in Excel — Monitor blood inventory, donor activity, and collection analytics
- Cardiology Institutes Dashboard in Excel — Analyze cardiology department performance with interactive Excel charts
- Clinical Trials Management Dashboard in Excel — Track clinical trial progress, enrollment, and site performance
- Healthcare KPI Dashboard Ultimate Kit — Bundle of 8 healthcare dashboard templates at a massive discount
Also read our related blog posts:
- Dental Practice Dashboard in Excel
- Clinical Trials Management Dashboard in Excel
- Blood Banks Dashboard in Power BI
- Cardiology Institutes Dashboard in Excel
Frequently Asked Questions
What is the best Excel dashboard for tracking hospital patient flow?
The Hospital Patient Flow Dashboard in Excel from NextGenTemplates is a purpose-built template with 5 interactive pages covering departmental analysis, patient demographics, capacity flow, and quality metrics. It tracks KPIs like treatment cost, length of stay, wait time, satisfaction, and readmissions — all powered by pivot tables that update automatically when you refresh your data.
How do I add my own hospital data to this Excel dashboard?
Go to the Data Sheet tab, replace the sample records with your own patient data keeping the same column format, then navigate to the Data tab in the Excel ribbon and click Refresh All. All pivot tables, charts, and KPI cards across all 5 dashboard pages will update instantly.
Can this dashboard track hospital readmission rates?
Yes. The Quality Metrics page includes Total Readmissions by Department and Total Treatment Cost by Readmission status. These charts help you identify which departments have the highest readmission rates and quantify the financial impact of preventable readmissions.
Do I need Excel macros or VBA to run this dashboard?
No. The Hospital Patient Flow Dashboard is built entirely on native Excel pivot tables and slicers. No macros, VBA, or advanced Excel skills are required. Simply update your data and click Refresh All.
What KPIs does this hospital dashboard track?
The dashboard tracks 5 primary KPIs: Total Treatment Cost, Total Records, Average Length of Stay, Average Wait Time, and Average Satisfaction. It also provides detailed breakdowns by department, ward, bed type, insurance type, diagnosis category, gender, admission type, discharge status, attending physician, and readmission status across 5 analytical pages.
Is this template suitable for multi-department hospitals?
Yes. The dashboard includes slicers and department-level analysis across all pages. You can filter by individual departments or compare multiple departments simultaneously. The Department Analysis page specifically benchmarks length of stay, wait times, satisfaction, and treatment costs across all your hospital departments.
Conclusion
The Hospital Patient Flow Dashboard in Excel is a comprehensive, plug-and-play analytics template that transforms raw hospital data into actionable insights across 5 professionally designed pages. From tracking treatment costs and patient satisfaction to monitoring readmission rates and capacity flow — this dashboard equips healthcare administrators, quality teams, and operations managers with the visual analytics they need to make data-driven decisions.
Click here to Purchase Hospital Patient Flow Dashboard in Excel
Visit our YouTube channel for step-by-step video tutorials on Excel dashboards and templates: