Managing investor services requires clarity, accuracy, and continuous monitoring. However, many organizations still rely on scattered Excel files, static reports, and manual analysis. As a result, decision-makers struggle to get real-time insights into investor satisfaction, transaction performance, and portfolio growth. That is exactly why an Investor Services Dashboard in Excel becomes a powerful and practical solution.
In this comprehensive article, you will learn what an Investor Services Dashboard in Excel is, why it matters, how it works, and how it supports data-driven decisions. Moreover, you will explore its pages, features, advantages, best practices, and frequently asked questions in a simple and actionable way.
Click to Purchases Investor Services Dashboard in Excel
What Is an Investor Services Dashboard in Excel?
An Investor Services Dashboard in Excel is a ready-to-use analytical tool designed to track, monitor, and analyze key investor-related metrics in one centralized file. Instead of reviewing multiple reports, you get a single interactive dashboard that presents all critical insights visually.
Because Excel supports formulas, pivot tables, slicers, and charts, this dashboard allows investor service teams to monitor transaction amounts, portfolio values, service levels, and satisfaction scores efficiently.
Most importantly, the dashboard updates automatically when you enter new data. Therefore, accuracy improves while manual effort reduces significantly.
Why Is an Investor Services Dashboard Important?
Investor trust and satisfaction depend heavily on transparency and service quality. Without structured analytics, identifying gaps becomes difficult.
Here is why an Investor Services Dashboard in Excel is essential:
-
It centralizes investor service data
-
It improves visibility across transactions and portfolios
-
It supports better service-level monitoring
-
It enables faster and more confident decisions
-
It saves time spent on manual reporting
As a result, organizations improve both operational efficiency and investor confidence.
How Does an Investor Services Dashboard in Excel Work?
First, the dashboard uses a structured data sheet where users enter transactional and service-related data. Then, Excel processes this data using formulas and pivot tables. Finally, charts, cards, and slicers display insights dynamically.
Because everything remains connected, any update in the data sheet immediately reflects across all dashboard pages. Consequently, users always work with the latest information.
Key Features of the Investor Services Dashboard in Excel
The Investor Services Dashboard in Excel includes several powerful features that enhance usability and analysis.
Page Navigator for Easy Navigation
A page navigator located on the left side allows users to move seamlessly between dashboard pages. Instead of scrolling through sheets, users jump directly to the required analysis page. As a result, usability improves significantly.
Right-Side Slicers for Dynamic Filtering
Each analytical page includes right-side slicers. These slicers enable filtering by date, region, service type, investor type, and more. Therefore, users analyze specific segments without altering data.
Automated KPI Cards
Click to Purchases Investor Services Dashboard in Excel
The dashboard displays card visuals that summarize key metrics instantly. Because these cards update automatically, users quickly understand overall performance.
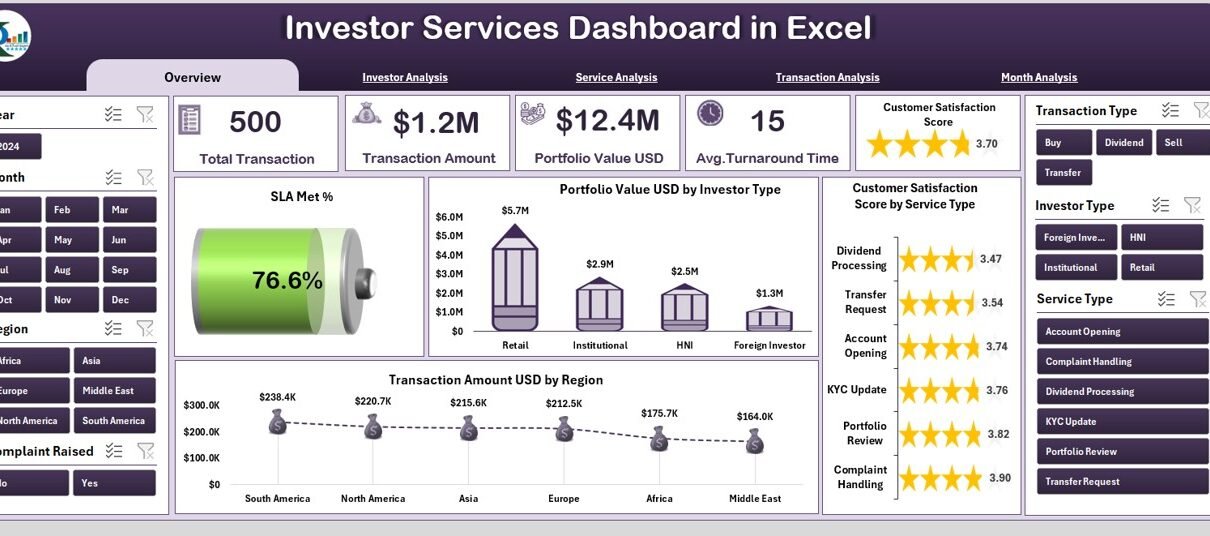
Overview Page: What Does the Investor Services Overview Show?
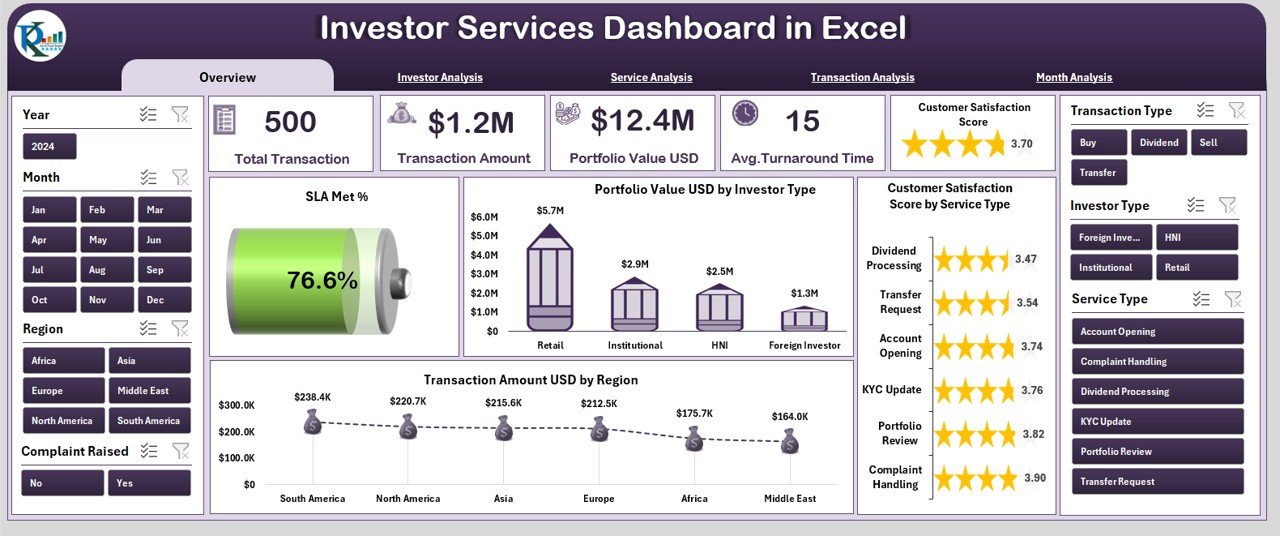
The Overview Page acts as the main snapshot of investor service performance.
Key Elements of the Overview Page
-
Five KPI Cards providing quick performance indicators
-
Right-side slicers for filtering views
-
Four interactive charts showing high-level insights
Charts on the Overview Page
-
SLA Met % – Measures service efficiency and compliance
-
Portfolio Value (USD) by Investee Type – Shows portfolio distribution
-
Customer Satisfaction Score by Service Type – Highlights service quality
-
Transaction Amount (USD) by Region – Tracks regional transaction volume
Because all visuals respond to slicers, users gain instant context. Therefore, strategic reviews become faster and clearer.
Investor Analysis Page: How Is Investor Performance Analyzed?
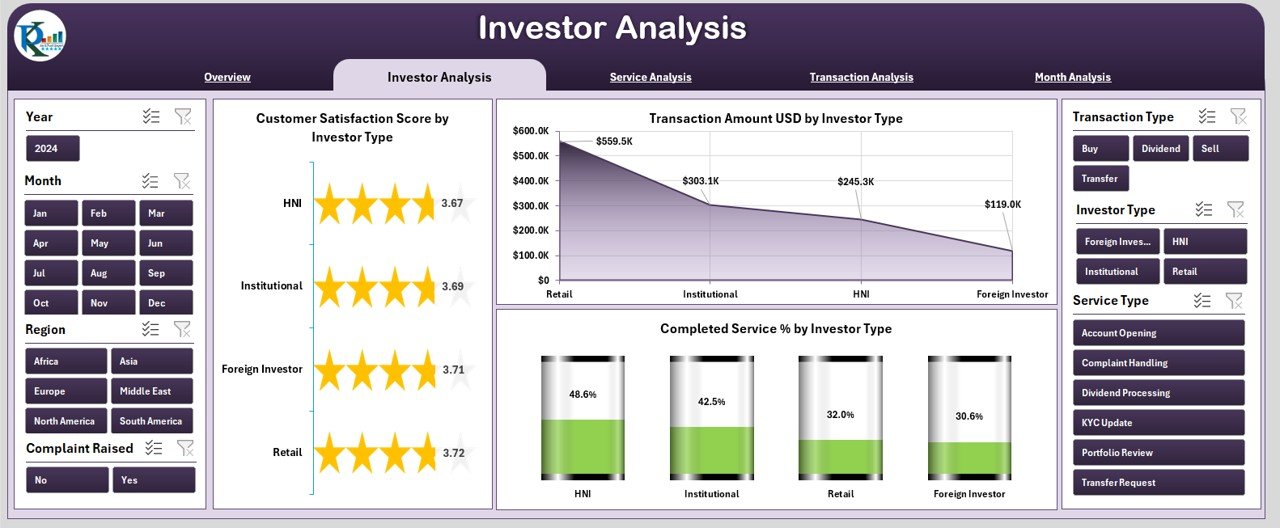
The Investor Analysis Page focuses on performance by investor type.
What Does This Page Help You Understand?
-
Which investor types generate higher transaction value
-
Which investor groups show higher satisfaction
-
How service completion rates vary by investor type
Charts on the Investor Analysis Page
-
Satisfaction Score by Investor Type
-
Transaction Amount (USD) by Investor Type
-
Completed Service % by Investor Type
As a result, teams identify high-value investor segments and improve service allocation.
Service Analysis Page: How Do Different Services Perform?
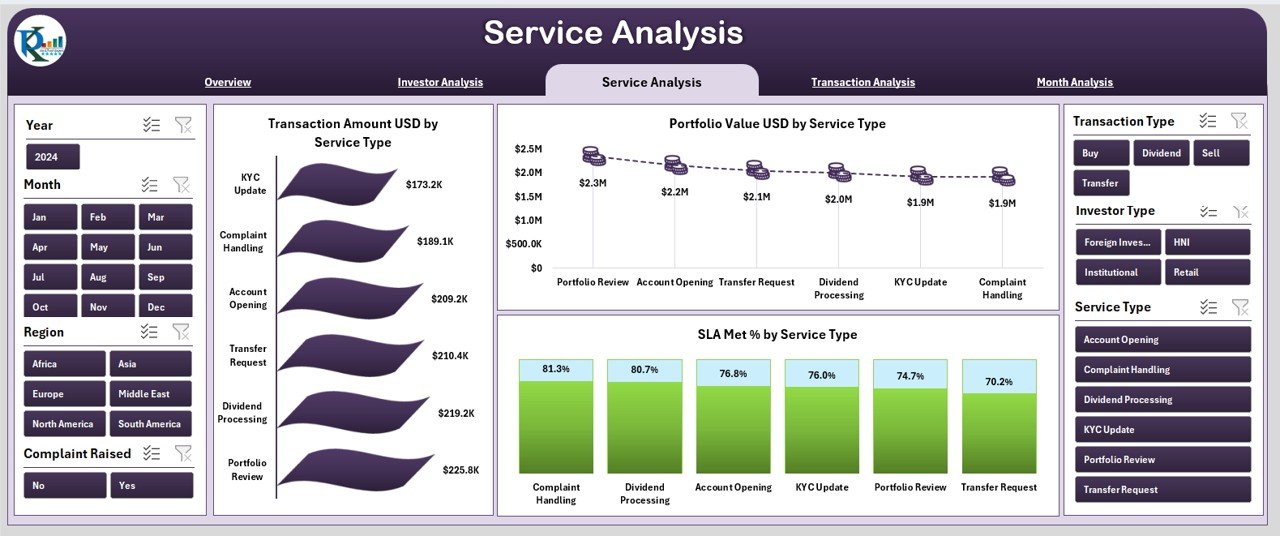
The Service Analysis Page evaluates performance across service categories.
Key Insights from This Page
-
Service demand and transaction value
-
Portfolio contribution by service type
-
SLA compliance by service category
Charts on the Service Analysis Page
-
Transaction Amount (USD) by Service Type
-
Portfolio Value (USD) by Service Type
-
SLA Met % by Service Type
Because services directly affect investor satisfaction, this analysis supports service optimization decisions.
Transaction Analysis Page: What Do Transactions Reveal?
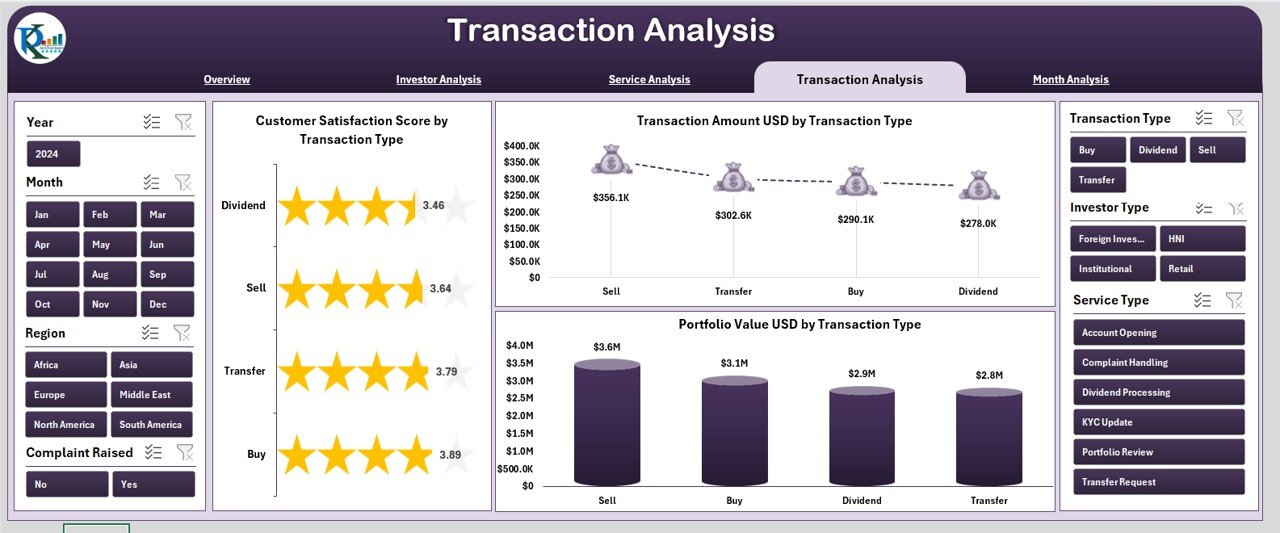
The Transaction Analysis Page breaks down performance by transaction type.
Purpose of the Transaction Analysis Page
-
Identify high-value transaction types
-
Assess satisfaction across transaction categories
-
Understand portfolio exposure by transaction type
Charts Included
-
Transaction Amount (USD) by Transaction Type
-
Portfolio Value (USD) by Transaction Type
-
Customer Satisfaction Score by Transaction Type
Therefore, operations teams improve processes for critical transaction categories.
Click to Purchases Investor Services Dashboard in Excel
Month Analysis Page: How Do Trends Change Over Time?
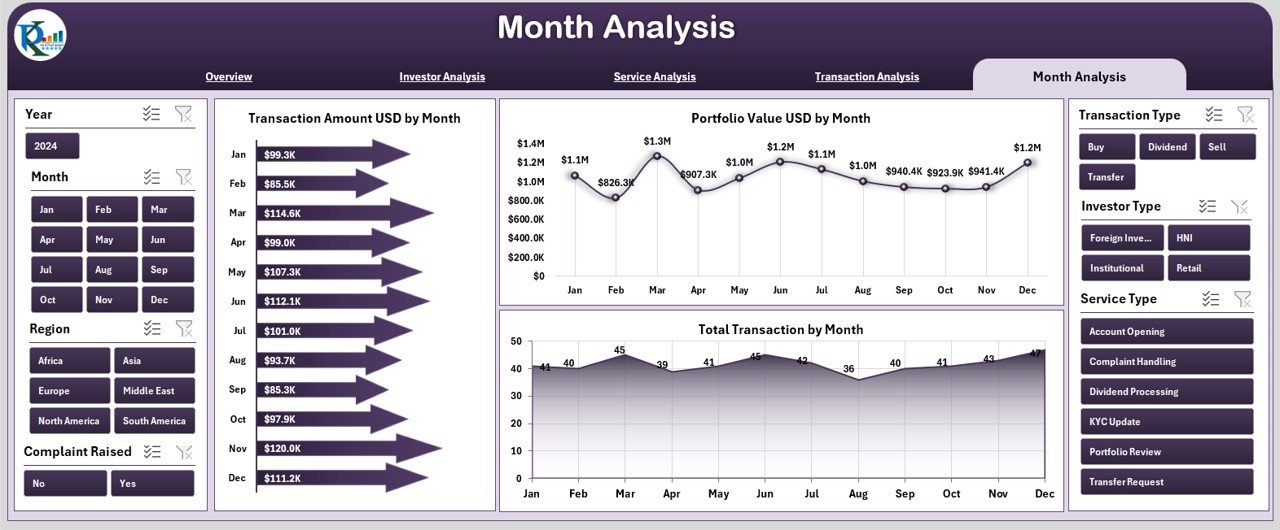
The Month Analysis Page focuses on time-based performance tracking.
Why Monthly Analysis Matters
-
It reveals seasonal trends
-
It supports capacity planning
-
It identifies growth or decline patterns
Charts on the Month Analysis Page
-
Transaction Amount (USD) by Month
-
Portfolio Value (USD) by Month
-
Total Transactions by Month
As a result, organizations forecast demand and plan resources more accurately.
Support Sheet and Data Sheet: Why Are They Important?
Data Sheet
The Data Sheet stores all raw data in a structured format. It includes columns for investor type, service type, region, transaction amount, satisfaction score, and SLA status. Because this sheet feeds all dashboards, accuracy here ensures reliable insights.
Support Sheet
The Support Sheet contains lookup tables, helper formulas, and mapping values. It improves data consistency and reduces errors during data entry.
What KPIs Can You Track Using an Investor Services Dashboard?
An Investor Services Dashboard in Excel supports tracking essential KPIs, including:
-
SLA Met Percentage
-
Transaction Amount (USD)
-
Portfolio Value (USD)
-
Customer Satisfaction Score
-
Completed Service Percentage
-
Total Number of Transactions
Because KPIs remain configurable, organizations customize them based on business needs.
Advantages of Investor Services Dashboard in Excel
Using an Investor Services Dashboard in Excel offers several clear benefits.
1. Centralized Reporting
Instead of multiple files, all insights stay in one dashboard. As a result, reporting becomes faster and more reliable.
2. Improved Decision-Making
Visual insights highlight trends and gaps instantly. Therefore, leaders make informed decisions confidently.
3. Cost-Effective Solution
Excel eliminates the need for expensive BI tools. Yet, it still delivers professional-level analytics.
4. Easy Customization
Users modify KPIs, charts, and slicers without technical complexity. Consequently, flexibility remains high.
5. Time Savings
Automated calculations and visuals reduce manual effort. Hence, teams focus on strategy instead of reporting.
Who Should Use an Investor Services Dashboard in Excel?
This dashboard suits many professionals, including:
-
Investor Relations Teams
-
Portfolio Managers
-
Financial Analysts
-
Service Operations Managers
-
Executive Leadership
Because Excel remains widely accessible, adoption remains smooth across teams.
Best Practices for the Investor Services Dashboard in Excel
To maximize dashboard value, follow these best practices.
Maintain Clean and Consistent Data
Always validate data before entry. Consistent naming and formats ensure accurate results.
Update Data Regularly
Schedule monthly or weekly updates. Regular updates keep insights relevant.
Use Slicers Strategically
Avoid overcrowding slicers. Instead, focus on key filters that support analysis.
Review KPIs Periodically
Business priorities change. Therefore, review KPIs quarterly to ensure alignment.
Protect Formula Sheets
Lock support and calculation sheets to prevent accidental changes.
Common Challenges and How to Overcome Them
Even though Excel remains powerful, challenges may arise.
Data Errors
Use data validation rules to reduce mistakes.
Performance Issues
Limit excessive formulas and optimize pivot tables.
User Adoption
Provide basic training so users understand slicers and navigation.
By addressing these challenges early, organizations maintain dashboard effectiveness.
Conclusion: Why You Should Use an Investor Services Dashboard in Excel
An Investor Services Dashboard in Excel transforms raw investor data into actionable insights. It simplifies reporting, enhances transparency, and supports better service delivery. Moreover, its flexibility and cost-effectiveness make it suitable for organizations of all sizes.
When teams track investor satisfaction, transaction performance, and portfolio value in one structured dashboard, decision-making improves significantly. Therefore, adopting this dashboard becomes not just beneficial—but essential.
Frequently Asked Questions (FAQs)
What is an Investor Services Dashboard in Excel used for?
An Investor Services Dashboard in Excel tracks investor satisfaction, transactions, portfolio value, and service performance in one interactive dashboard.
Can non-technical users use this dashboard?
Yes. The dashboard uses slicers, charts, and simple data entry, making it easy for non-technical users.
How often should data be updated?
Most teams update the dashboard monthly. However, high-volume environments may update weekly.
Can I customize KPIs in the dashboard?
Absolutely. Users can add, modify, or remove KPIs based on business requirements.
Does the dashboard support large datasets?
Yes. Excel handles large datasets efficiently when structured and optimized properly.
Is this dashboard suitable for financial organizations?
Yes. It fits investor services teams, asset managers, financial institutions, and advisory firms.
Visit our YouTube channel to learn step-by-step video tutorials