Managing IT infrastructure without clear performance visibility often leads to downtime, inefficiencies, and rising operational risks. IT Infrastructure KPI Scorecard in Excel However, modern IT teams no longer rely on scattered reports or manual tracking methods. Instead, they use structured performance tools that deliver instant insights and support faster decisions.
IT Infrastructure KPI Scorecard in Excel That is exactly where an IT Infrastructure KPI Scorecard in Excel becomes a powerful and practical solution.
In this detailed guide, you will learn what an IT Infrastructure KPI Scorecard in Excel is, why it matters, how it works, its key features, advantages, best practices, and frequently asked questions. By the end of this article, you will clearly understand how this ready-to-use Excel scorecard helps IT teams monitor performance, improve reliability, and align infrastructure operations with business goals.
Click to Purchases IT Infrastructure KPI Scorecard in Excel
What Is an IT Infrastructure KPI Scorecard in Excel?
An IT Infrastructure KPI Scorecard in Excel is a structured and interactive performance tracking tool designed to monitor key performance indicators related to IT systems, networks, servers, applications, and support services.
Instead of reviewing multiple spreadsheets or static reports, IT managers can track all critical infrastructure KPIs in one centralized Excel file. As a result, teams gain instant visibility into performance gaps, risks, and trends.
Moreover, because Excel powers this scorecard, it offers flexibility, accessibility, and ease of use without the need for expensive software or complex setups.
Why Do IT Teams Need an IT Infrastructure KPI Scorecard?
IT infrastructure plays a critical role in business continuity. However, without proper KPI tracking, teams often react to problems instead of preventing them. Therefore, organizations need a structured system that provides clarity and accountability.
An IT Infrastructure KPI Scorecard in Excel helps because:
-
It centralizes all infrastructure KPIs in one place
-
It improves transparency across teams and management
-
It supports proactive issue identification
-
It enables data-driven decision-making
-
It aligns IT operations with business objectives
As a result, IT teams move from reactive firefighting to proactive performance management.
How Does an IT Infrastructure KPI Scorecard in Excel Work?
An IT Infrastructure KPI Scorecard in Excel works by combining structured data entry, KPI definitions, performance calculations, and visual analysis within a single workbook.
Typically, the scorecard follows a logical flow:
-
Define KPIs and targets
-
Enter actual performance data
-
Compare actuals with targets
-
Visualize performance using indicators and charts
-
Analyze trends over time
Because Excel supports formulas, dropdowns, charts, and conditional formatting, the scorecard delivers powerful insights without complexity.
Click to Purchases IT Infrastructure KPI Scorecard in Excel
What Are the Key Worksheets in the IT Infrastructure KPI Scorecard in Excel?
This ready-to-use IT Infrastructure KPI Scorecard template includes four well-designed worksheets, each serving a specific purpose.
What Is the Scorecard Sheet and How Does It Help?
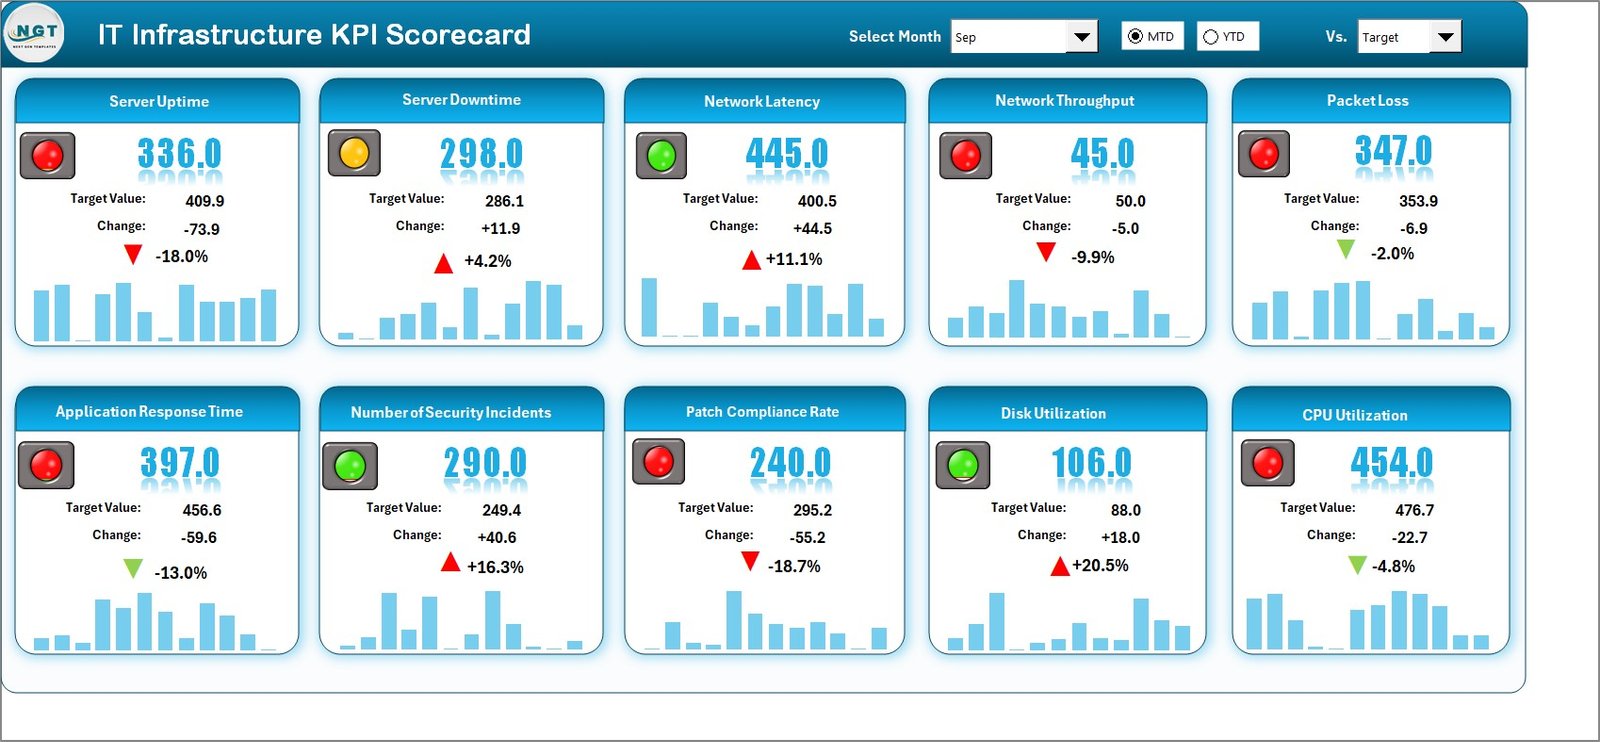
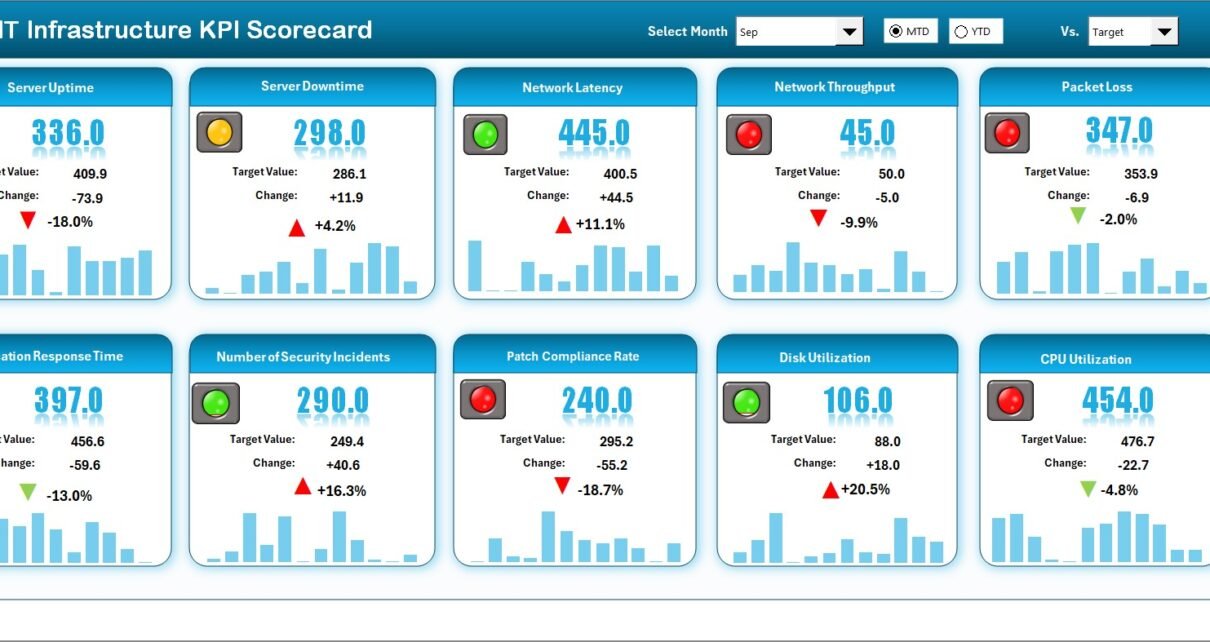
The Scorecard Sheet acts as the main interface of the IT Infrastructure KPI Scorecard in Excel. It allows users to review overall performance at a glance.
Key Features of the Scorecard Sheet
-
Dropdown Menus for Period Selection
Users can select the required month, MTD (Month-to-Date), or YTD (Year-to-Date) for performance analysis. This flexibility ensures quick period-based insights. -
Actual vs Target Comparison
The scorecard displays actual performance values alongside predefined targets. As a result, performance gaps become immediately visible. -
Visual Performance Indicators
Color-coded indicators and conditional formatting highlight whether KPIs meet, exceed, or miss targets. Therefore, decision-makers quickly identify problem areas. -
Comprehensive KPI Overview
Each KPI displays complete details, including KPI group, unit, type, MTD values, and YTD values, ensuring clarity and consistency.
Because of this structure, the Scorecard Sheet becomes a powerful executive-level dashboard for IT performance.
How Does the KPI Trend Sheet Improve Analysis?
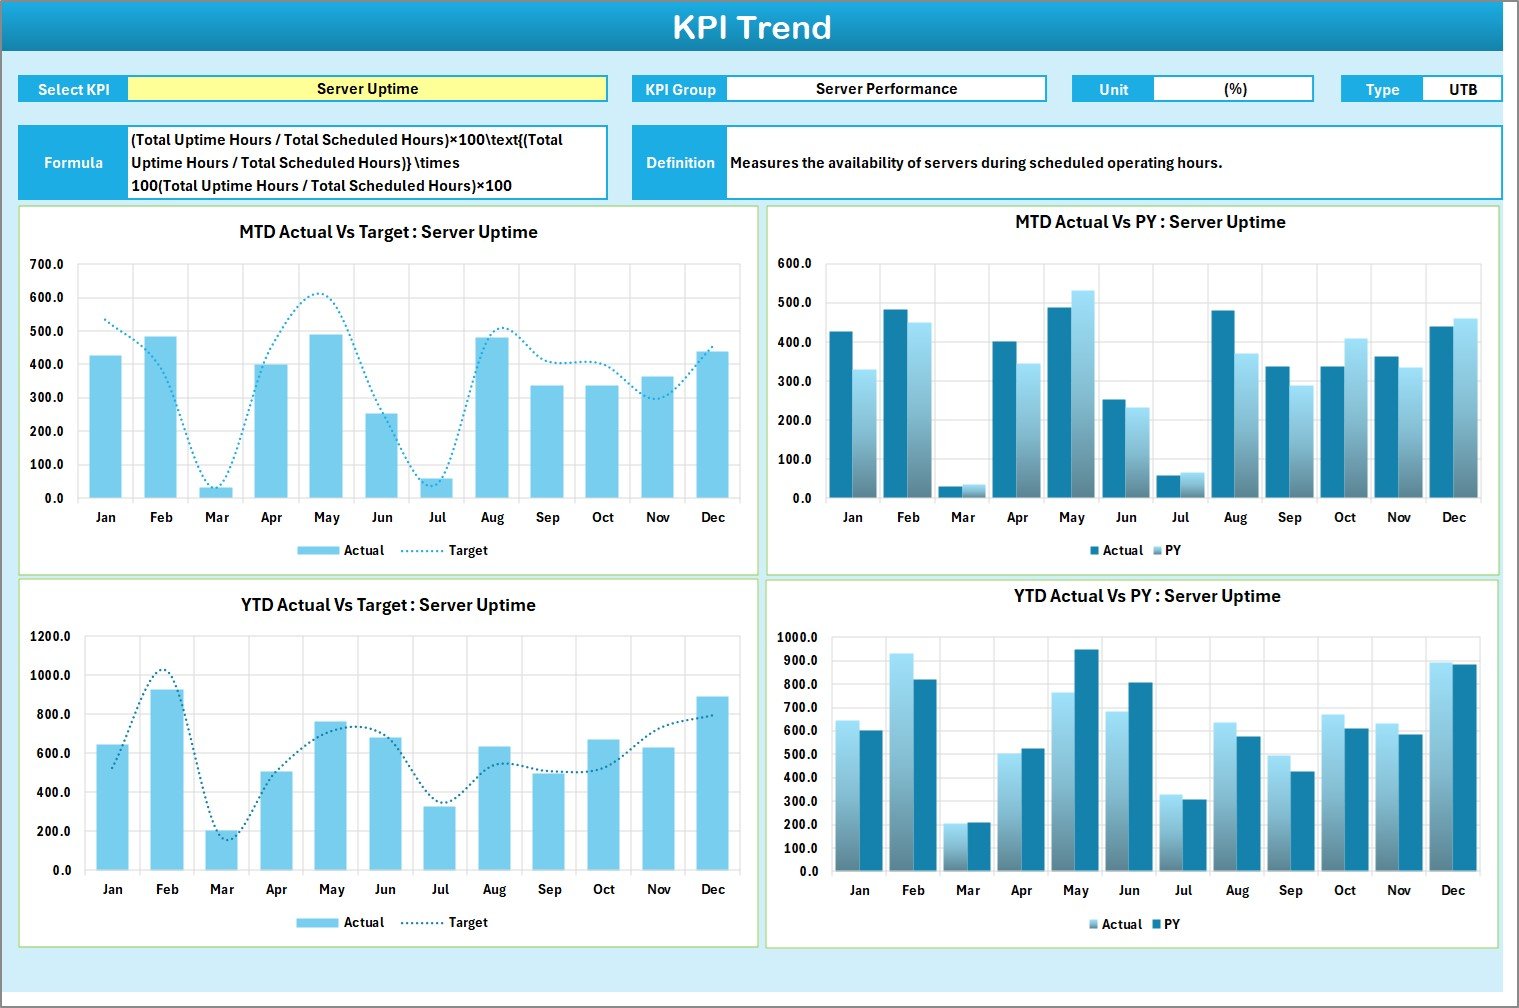
The KPI Trend Sheet focuses on detailed performance analysis for individual KPIs over time.
Key Capabilities of the KPI Trend Sheet
-
KPI Selection Dropdown
Users can select any KPI name from the dropdown available in cell C3. This feature ensures dynamic analysis without manual filtering. -
Detailed KPI Information Display
The sheet displays:-
KPI Group
-
Unit of measurement
-
KPI Type (Lower the Better or Upper the Better)
-
KPI Formula
-
KPI Definition
-
-
MTD and YTD Trend Charts
The sheet shows trend charts for Actual, Target, and Previous Year (PY) values. As a result, users can compare current performance against historical benchmarks.
Because trends reveal patterns, this sheet helps IT teams understand performance behavior instead of just reviewing numbers.
Click to Purchases IT Infrastructure KPI Scorecard in Excel
Why Is the Input Data Sheet Critical?
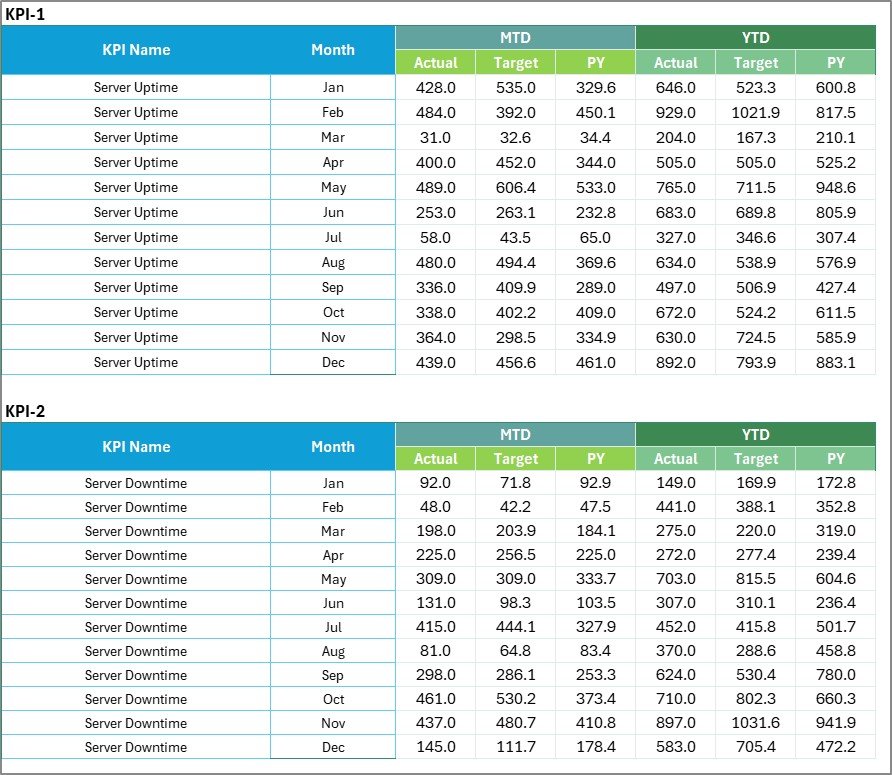
The Input Data Sheet serves as the foundation of the IT Infrastructure KPI Scorecard in Excel.
What Happens in the Input Data Sheet?
-
Data Entry for KPIs
Users enter actual values, targets, and related metrics for each KPI. -
Ongoing Updates
Teams can easily update data as new results become available. Therefore, the scorecard always reflects the latest performance. -
Flexible Structure
The sheet supports multiple KPIs, periods, and metrics, making it scalable for growing IT environments.
Without accurate input data, performance analysis loses value. Hence, this sheet plays a vital role in the scorecard’s effectiveness.
What Is the KPI Definition Sheet and Why Is It Important?
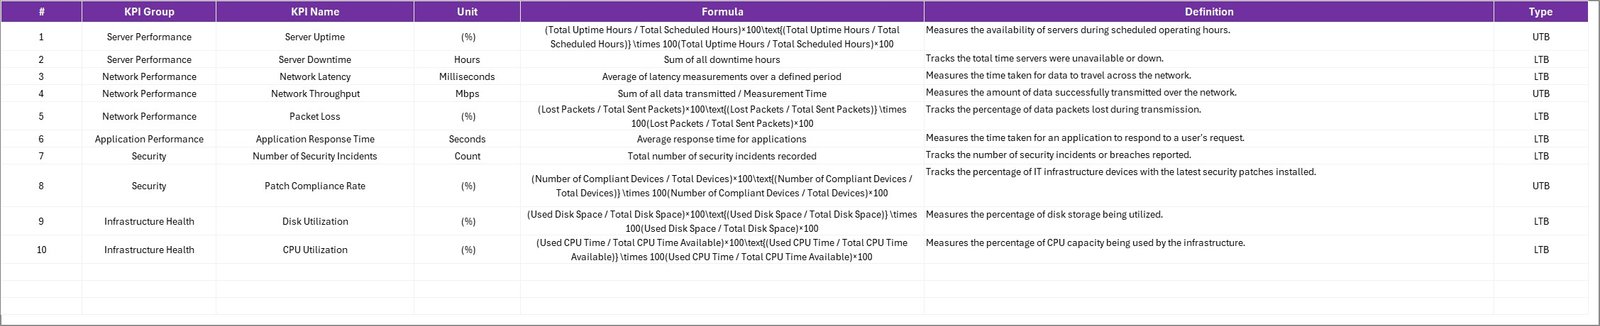
The KPI Definition Sheet ensures clarity, consistency, and governance across IT performance measurement.
Key Elements of the KPI Definition Sheet
-
KPI Name
-
KPI Group
-
Unit of Measurement
-
KPI Formula
-
KPI Definition
Because all KPIs follow standardized definitions, teams avoid confusion, misinterpretation, and reporting errors.
Which KPIs Can You Track Using an IT Infrastructure KPI Scorecard?
Click to Purchases IT Infrastructure KPI Scorecard in Excel
An IT Infrastructure KPI Scorecard in Excel supports a wide range of infrastructure-related KPIs, such as:
-
Server uptime percentage
-
Network availability
-
Mean time to resolve incidents (MTTR)
-
Mean time between failures (MTBF)
-
Patch compliance rate
-
Backup success rate
-
Storage utilization
-
System response time
-
Incident volume
-
Change success rate
By tracking these KPIs, IT teams maintain control over system reliability and service quality.
Click to Purchases IT Infrastructure KPI Scorecard in Excel
Advantages of IT Infrastructure KPI Scorecard in Excel
Using an IT Infrastructure KPI Scorecard in Excel delivers several practical and strategic benefits.
Key Advantages
-
Centralized Performance Monitoring
Track all IT infrastructure KPIs in one organized Excel file. -
Cost-Effective Solution
Excel eliminates the need for expensive tools or licenses. -
Easy to Use and Customize
Teams can modify KPIs, targets, and visuals without technical expertise. -
Improved Decision-Making
Clear visuals and comparisons support faster and better decisions. -
Trend-Based Insights
MTD, YTD, and historical trends highlight improvement areas. -
Management-Ready Reporting
The scorecard presents professional and presentation-ready insights.
Because of these advantages, Excel remains a preferred platform for IT KPI tracking.
How Does This Scorecard Support IT Governance and Compliance?
Strong IT governance requires accurate performance measurement and documentation. An IT Infrastructure KPI Scorecard in Excel supports governance by:
-
Standardizing KPI definitions
-
Maintaining performance history
-
Enabling audit-ready reporting
-
Supporting SLA and compliance tracking
As a result, organizations strengthen accountability and transparency.
Best Practices for the IT Infrastructure KPI Scorecard in Excel
To get maximum value from your IT Infrastructure KPI Scorecard in Excel, follow these best practices.
Best Practices
-
Define KPIs clearly before implementation
-
Align KPIs with business and IT objectives
-
Update data regularly and consistently
-
Review MTD and YTD trends during IT meetings
-
Use realistic and achievable targets
-
Limit KPIs to those that drive action
-
Train teams on KPI definitions and usage
-
Periodically review and refine KPIs
When teams follow these practices, the scorecard becomes a strategic asset instead of just a reporting tool.
How Does Excel Compare to Other KPI Tracking Tools?
Although many tools exist, Excel remains popular because:
-
It offers unmatched flexibility
-
It supports customization without coding
-
It integrates easily with existing data sources
-
It requires minimal training
Therefore, an IT Infrastructure KPI Scorecard in Excel suits organizations of all sizes.
Click to Purchases IT Infrastructure KPI Scorecard in Excel
Who Should Use an IT Infrastructure KPI Scorecard in Excel?
This scorecard benefits:
-
IT managers and infrastructure leads
-
System administrators
-
Network operations teams
-
IT service management teams
-
CIOs and IT leadership
Because the scorecard adapts to different roles, it supports both operational and strategic needs.
Conclusion: Why Choose an IT Infrastructure KPI Scorecard in Excel?
An IT Infrastructure KPI Scorecard in Excel offers a practical, flexible, and powerful way to monitor IT performance. Instead of relying on fragmented reports or reactive approaches, teams gain real-time visibility into infrastructure health.
Moreover, with structured worksheets, trend analysis, clear definitions, and visual indicators, this ready-to-use scorecard supports better decisions, stronger governance, and improved service reliability.
For organizations seeking clarity without complexity, Excel remains a trusted and effective solution.
Frequently Asked Questions About IT Infrastructure KPI Scorecard in Excel
What is the purpose of an IT Infrastructure KPI Scorecard in Excel?
The scorecard helps track, analyze, and improve IT infrastructure performance using structured KPIs and visual insights.
Can I customize the IT Infrastructure KPI Scorecard?
Yes, Excel allows full customization of KPIs, targets, formulas, and visuals.
Is this scorecard suitable for small and large organizations?
Yes, the scorecard scales easily and suits organizations of all sizes.
How often should I update the KPI data?
You should update KPI data regularly, such as daily, weekly, or monthly, depending on the KPI.
Does this scorecard support MTD and YTD analysis?
Yes, the scorecard includes MTD and YTD comparisons for better trend analysis.
Do I need advanced Excel skills to use this scorecard?
No, basic Excel knowledge is enough to use and maintain the scorecard.
Click to Purchases IT Infrastructure KPI Scorecard in Excel
Visit our YouTube channel to learn step-by-step video tutorials