In today’s competitive business world, employee development plays a vital role in organizational growth. Learning and Development (L&D) teams focus on enhancing workforce capabilities through structured training programs, skills assessments, and performance evaluations. However, measuring the effectiveness of these efforts can be challenging. That’s where the Learning and Development (L&D) KPI Dashboard in Excel comes in — a powerful, ready-to-use performance management tool that turns raw data into actionable insights.
This article explains everything about the L&D KPI Dashboard — its structure, features, advantages, and best practices to make the most of it.
Click to Purchases Learning and Development (L&D) KPI Dashboard in Excel
What Is a Learning and Development (L&D) KPI Dashboard in Excel?
A Learning and Development (L&D) KPI Dashboard is an analytical tool designed to track, measure, and visualize key performance indicators (KPIs) related to employee training and development.
Using Microsoft Excel, this dashboard helps HR and L&D professionals monitor how effectively their training initiatives align with business goals. It provides a clear view of metrics such as:
-
Training completion rates
-
Learning hours per employee
-
Training cost per employee
-
Employee satisfaction with training
-
Skill improvement levels
-
ROI of learning programs
With this dashboard, you can easily evaluate both Month-to-Date (MTD) and Year-to-Date (YTD) performance trends and compare them with previous years — all within a few clicks.
Why Every Organization Needs an L&D KPI Dashboard
Measuring learning outcomes isn’t just about tracking attendance in training sessions. It’s about understanding the impact of learning on performance, productivity, and retention.
A well-structured L&D dashboard in Excel allows HR and management teams to:
-
Identify which training programs deliver measurable outcomes.
-
Track performance gaps and take corrective actions.
-
Optimize training budgets by analyzing cost vs benefit.
-
Demonstrate ROI of learning investments to leadership.
-
Improve employee engagement through data-driven insights.
Without a dashboard, organizations rely on assumptions — with it, they make decisions backed by data.
Click to Purchases Learning and Development (L&D) KPI Dashboard in Excel
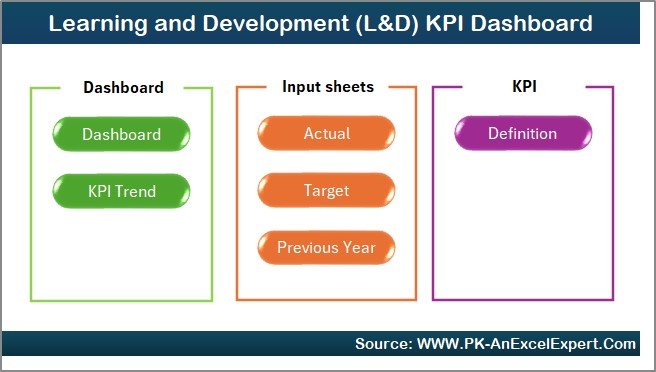
Structure of the L&D KPI Dashboard in Excel
The Learning and Development KPI Dashboard is built around seven well-organized worksheets, each with a specific purpose. Let’s look at what each sheet does.
1. Home Sheet
The Home Sheet acts as the index page of the dashboard. It includes navigation buttons that help users jump to other sheets instantly.
This ensures a user-friendly experience and helps even non-technical users explore the dashboard efficiently.
Typical buttons include:
-
Dashboard
-
KPI Trend
-
Actual Numbers Input
-
Target Sheet
-
Previous Year Data
-
KPI Definition
This layout saves time and provides a professional structure for easy reporting.
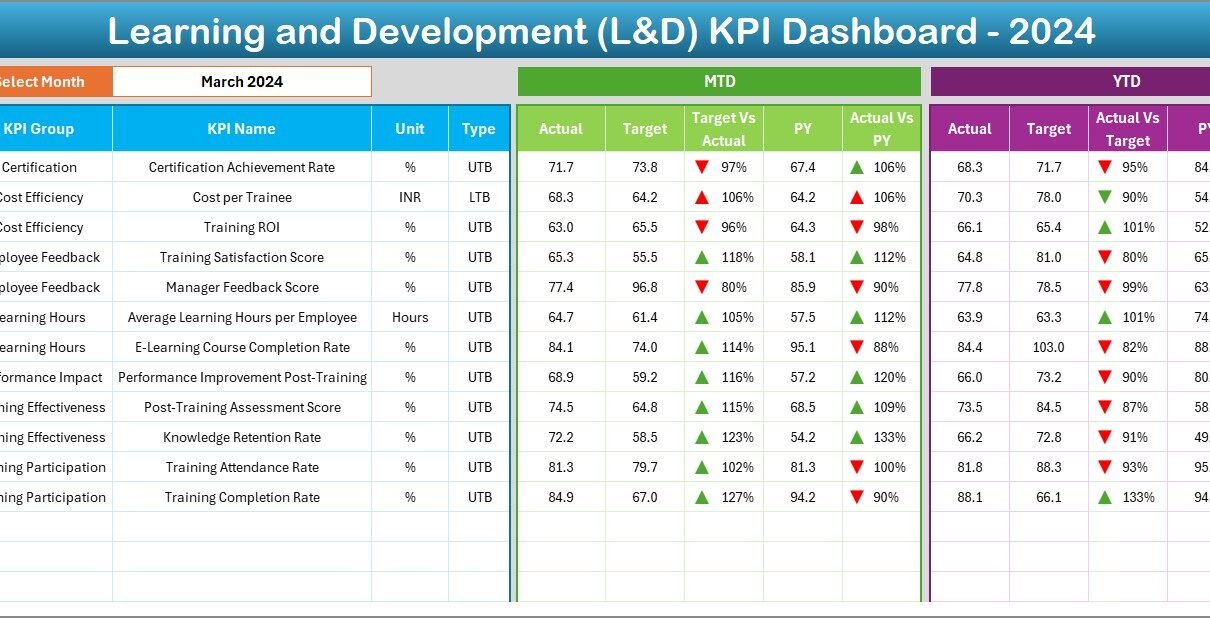
2. Dashboard Sheet Tab
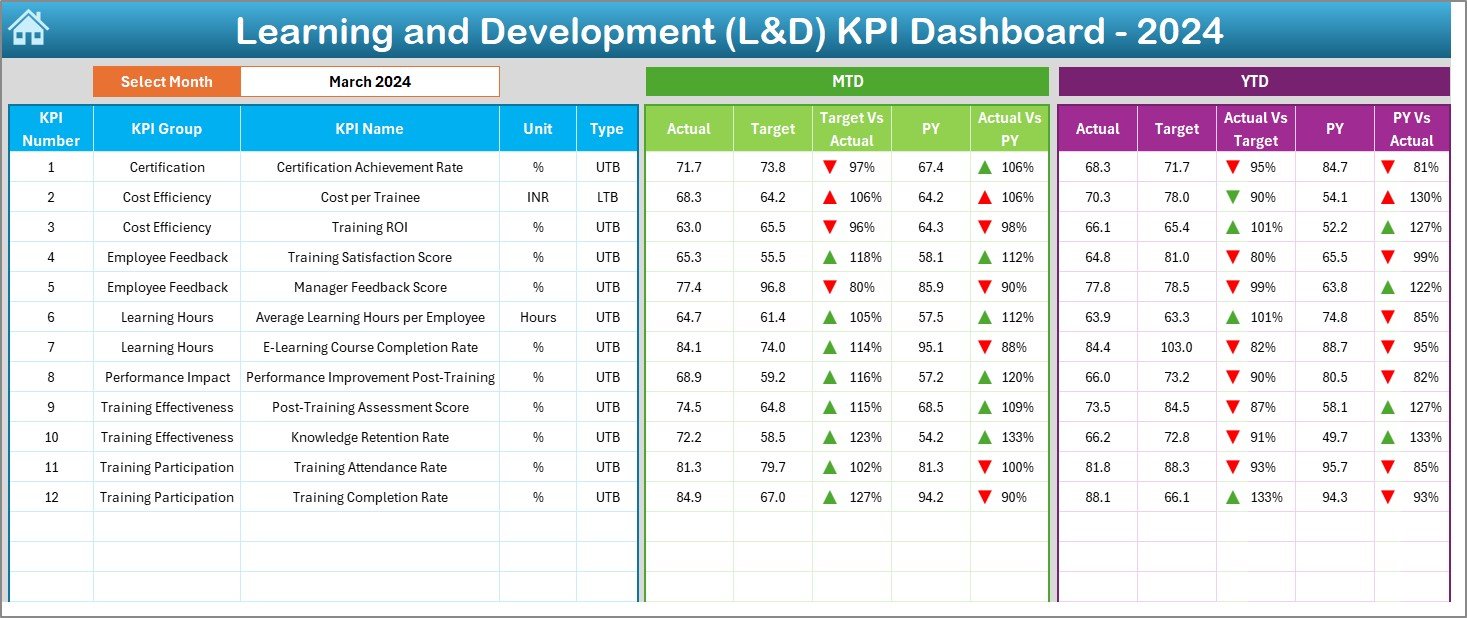
This is the main visualization sheet — the heart of your KPI analysis.
Here’s what makes it powerful:
-
A month selection dropdown (Cell D3) lets you choose any month to view performance.
-
The dashboard automatically updates MTD and YTD actuals, targets, and previous year comparisons.
-
Conditional formatting uses up/down arrows and color indicators to show performance status — instantly highlighting areas that need attention.
-
The layout displays both Actual vs Target and Actual vs Previous Year comparisons side by side, making it ideal for management reporting.
This sheet transforms static data into meaningful insights for leadership teams.
3. KPI Trend Sheet Tab
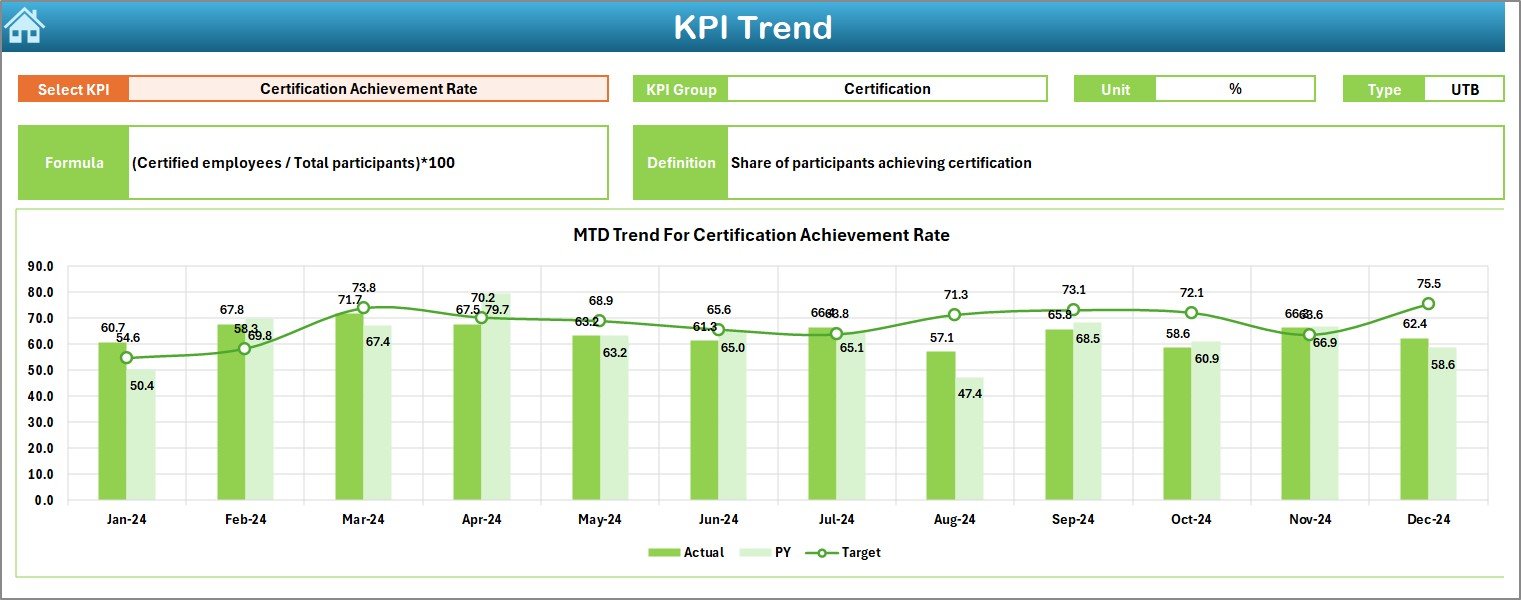
The KPI Trend Sheet focuses on historical and comparative performance tracking.
You can select any KPI name from the dropdown (Cell C3) to view detailed trends.
Once selected, the sheet displays:
-
KPI Group (e.g., Learning Effectiveness, Cost Efficiency)
-
Unit of KPI (%, Hours, Score, etc.)
-
KPI Type – Lower the Better (LTB) or Upper the Better (UTB)
-
Formula and Definition
It also includes MTD and YTD charts that visualize performance trends for Actual, Target, and Previous Year values.
This helps identify seasonal patterns, training effectiveness, and long-term learning progress.
Click to Purchases Learning and Development (L&D) KPI Dashboard in Excel
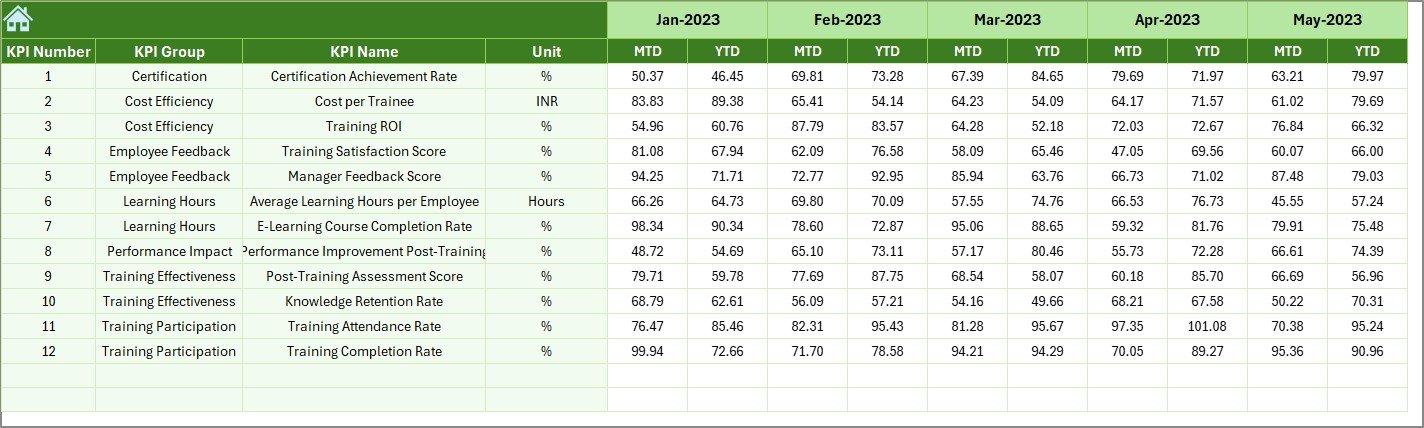
4. Actual Numbers Input Sheet
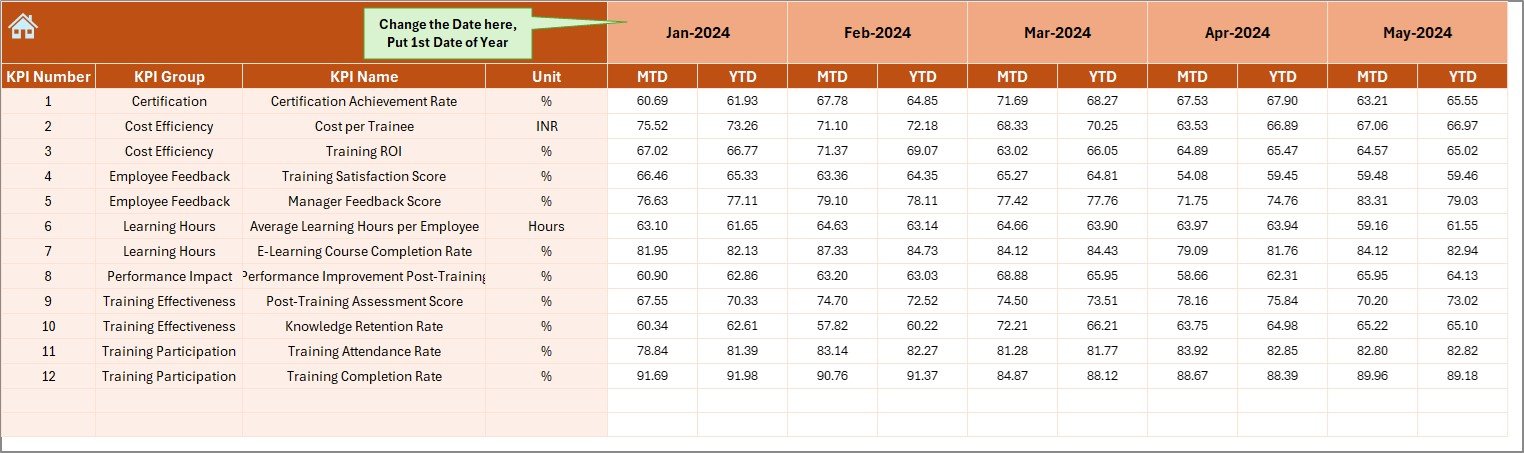
This sheet is where users input monthly actual performance data.
You can set the first month of the year in Cell E1, and the sheet will automatically structure the rest.
For example:
If January is entered in E1, then MTD and YTD data auto-align accordingly.
This sheet simplifies data entry while maintaining consistency across reports.
5. Target Sheet Tab
The Target Sheet defines expected values for each KPI.
Here, you enter the monthly targets (both MTD and YTD) for every KPI.
These targets become the benchmark for performance analysis.
Setting realistic targets ensures that performance trends remain actionable and measurable.
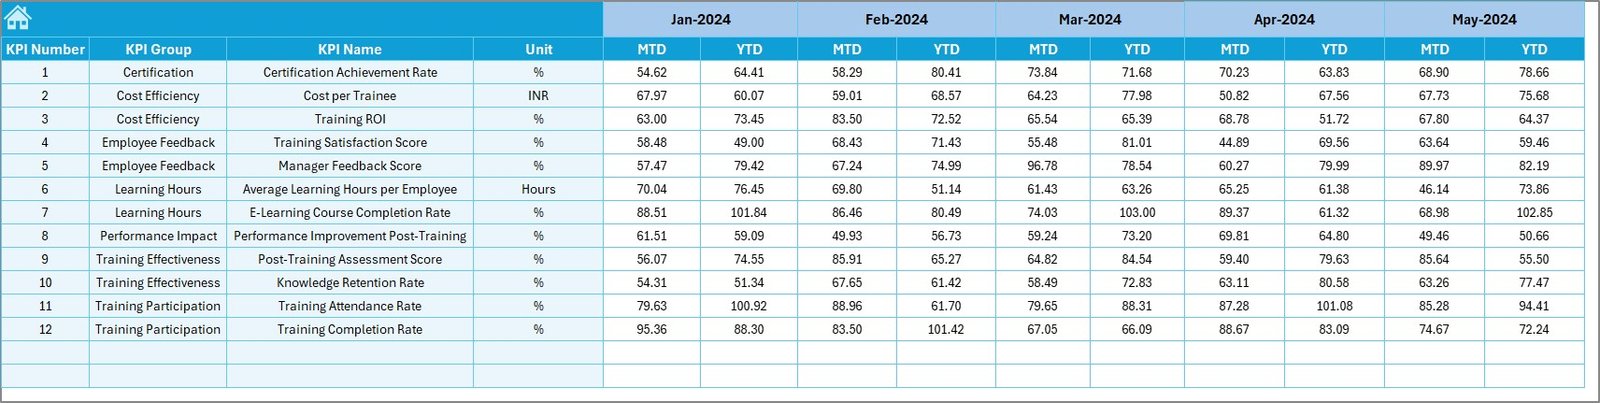
6. Previous Year Numbers Sheet Tab
This sheet stores the previous year’s KPI data, allowing comparative analysis.
You can review how current year performance stacks against last year’s — an essential step for measuring progress over time.
This data also supports trend forecasting and helps identify whether improvements result from training or other business factors.
7. KPI Definition Sheet Tab
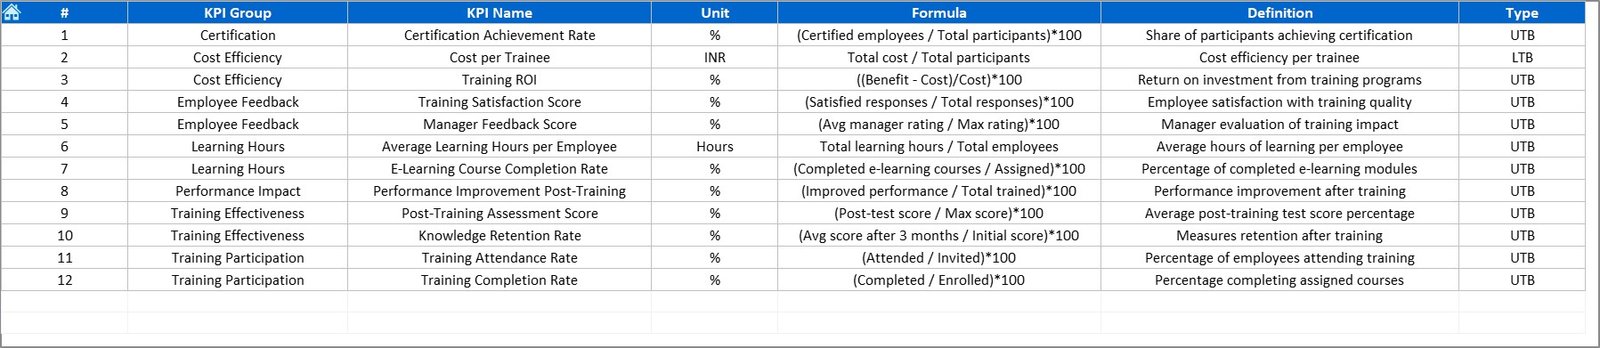
The KPI Definition Sheet provides transparency and clarity.
Each KPI entry includes:
-
KPI Name
-
KPI Group
-
Unit of Measurement
-
Formula Used
-
Definition
Having a centralized KPI definition ensures alignment across departments and minimizes confusion. It also serves as documentation for audit and reporting purposes.
Key Features of the L&D KPI Dashboard
✅ Interactive Dropdowns: Select months, KPI names, or categories for instant analysis.
✅ Dynamic Visuals: Auto-updating charts and indicators highlight trends clearly.
✅ MTD and YTD Comparisons: Track short-term and long-term learning effectiveness.
✅ Conditional Formatting: Visual cues instantly identify performance gaps.
✅ Target vs Actual vs PY Comparisons: Ensure continuous improvement.
✅ Easy Data Entry: Simplified structure for Actual, Target, and PY numbers.
✅ Self-Contained Excel File: No external data connections required.
This makes the dashboard both powerful and easy to use.
Advantages of the Learning and Development KPI Dashboard
A Learning and Development KPI Dashboard offers numerous benefits for HR and business leaders.
1. Real-Time Performance Visibility
You get an instant view of how your learning programs are performing. No more waiting for manual reports — the dashboard updates automatically.
2. Informed Decision-Making
With clear metrics, you can decide where to invest more training effort and where to cut back.
3. Improved Accountability
When KPIs are visible, team members take more responsibility for outcomes.
4. Resource Optimization
You can track cost per learner and optimize the budget for maximum ROI.
5. Alignment with Business Goals
The dashboard ensures L&D initiatives contribute directly to productivity, engagement, and retention metrics.
6. Simplified Reporting
With charts, indicators, and comparisons, management reports become clear, professional, and presentation-ready.
How to Use the L&D Dashboard Effectively
To get the most value from this dashboard, follow these simple steps:
-
Input Data Correctly: Enter accurate Actual, Target, and PY values in their respective sheets.
-
Define Clear KPIs: Ensure every KPI has a definition and formula for consistency.
-
Set Monthly Targets: Use historical data and organizational goals to set achievable targets.
-
Review Monthly Trends: Analyze KPI Trend Sheet regularly for improvement patterns.
-
Take Corrective Action: If actual values fall short, identify root causes and plan interventions.
Consistent usage ensures meaningful insights and better training outcomes.
Click to Purchases Learning and Development (L&D) KPI Dashboard in Excel
Best Practices for the Learning and Development KPI Dashboard
Following best practices can help you make the most of your Excel-based dashboard.
1. Use Drop-Down Menus Wisely
Keep the interface clean. Use dropdown lists for selecting months, KPIs, and categories. This reduces input errors and ensures smoother analysis.
2. Automate Calculations
Use Excel formulas such as SUMIFS, AVERAGEIFS, and IFERROR to automate data aggregation and avoid manual errors.
3. Implement Conditional Formatting
Apply red-yellow-green color coding or up/down arrows to show performance status visually.
4. Secure Data Entry Sheets
Protect formula cells and lock input ranges to prevent accidental overwriting.
5. Regularly Update KPI Definitions
Review and update KPI definitions annually to align with changing learning strategies.
6. Visualize Effectively
Use Excel charts — line charts for trends, bar charts for comparisons, and gauges for targets — to make your data visually engaging.
7. Backup and Version Control
Maintain version history and backups of your dashboard to safeguard data integrity.
8. Integrate Feedback Mechanisms
Link employee surveys or training feedback into your KPI measurement system for richer insights.
Common Challenges in Measuring Learning Effectiveness
Despite the best tools, L&D teams often face challenges like:
-
Lack of clear KPI definitions
-
Poor data collection consistency
-
Overemphasis on activity metrics instead of impact metrics
-
Limited integration with HR or performance data
-
Infrequent review cycles
An Excel-based L&D Dashboard helps overcome most of these issues through structure, automation, and visual tracking.
Click to Purchases Learning and Development (L&D) KPI Dashboard in Excel
Tips to Customize the Dashboard
You can personalize the dashboard based on your organizational needs:
-
Add a department filter to compare learning KPIs across business units.
-
Include gender, role, or location filters for deeper demographic insights.
-
Create a pivot summary for management-level reporting.
-
Integrate VBA macros to automate monthly data refreshes.
These customizations make the tool scalable and reusable for various departments.
Conclusion
The Learning and Development (L&D) KPI Dashboard in Excel is an indispensable tool for modern HR and training professionals. It transforms data into insights, enables continuous improvement, and demonstrates the tangible impact of learning programs on business success.
With its structured layout, interactive visuals, and ease of use, this dashboard empowers organizations to make informed, data-driven decisions about employee development.
In short — it’s not just a spreadsheet; it’s a strategic performance engine for learning excellence.
Frequently Asked Questions (FAQs)
1. What is the purpose of an L&D KPI Dashboard?
The main purpose is to monitor, measure, and visualize learning performance across employees, departments, and training programs. It ensures that learning activities deliver measurable outcomes.
2. Can I use this dashboard without advanced Excel skills?
Yes! The dashboard is fully user-friendly. Most functions run automatically once you input the actual and target data.
3. What types of organizations can use this dashboard?
Any organization — from startups to large enterprises — can use it to track employee training effectiveness.
4. How often should I update the dashboard?
It’s best to update it monthly or quarterly depending on your reporting cycle.
5. Can I customize KPIs in the dashboard?
Absolutely! You can add, remove, or modify KPIs based on your company’s learning priorities.
6. Does the dashboard calculate ROI automatically?
You can create an ROI formula using actual cost and benefit data, or modify the template to include it.
7. Can I use this dashboard in Google Sheets or Power BI?
Yes. While this version is Excel-based, you can replicate it in Google Sheets or connect it to Power BI for advanced visualization.
8. Is data security ensured in Excel dashboards?
Yes. You can lock formula cells, protect worksheets, and use password protection to secure your data.
9. What’s the best way to present L&D metrics to management?
Use the Dashboard and KPI Trend sheets for charts and visuals — they make presentations professional and easy to understand.
10. How can I download or use this template?
You can get the Learning and Development (L&D) KPI Dashboard in Excel from NextGenTemplates.com, ready to use with real data and dynamic analysis features.
Click to Purchases Learning and Development (L&D) KPI Dashboard in Excel
Visit our YouTube channel to learn step-by-step video tutorials