Modern leather processing industries operate in a highly competitive and quality-driven environment. Companies must manage raw material utilization, chemical processing, production efficiency, environmental compliance, and delivery timelines simultaneously. Therefore, businesses need a structured system that helps them measure performance clearly and consistently.However, many leather processing units still rely on manual reports, disconnected spreadsheets, or delayed performance reviews. As a result, managers struggle to identify inefficiencies, production losses, and quality issues on time.This is exactly where a Leather Processing KPI Dashboard in Excel becomes a powerful solution.In this comprehensive guide, you will learn everything about the Leather Processing KPI Dashboard in Excel, including its features, benefits, structure, implementation process, best practices, and frequently asked questions. Moreover, this article explains how leather manufacturers can transform raw operational data into actionable insights using Excel.
Click to buy Leather Processing KPI Dashboard in Excel
What Is a Leather Processing KPI Dashboard in Excel?
A Leather Processing KPI Dashboard in Excel is a performance monitoring tool designed to track key operational indicators across leather manufacturing processes such as soaking, liming, tanning, finishing, quality inspection, and dispatch.
Instead of analyzing multiple reports separately, teams can monitor all important KPIs in one interactive dashboard.
Because Excel supports formulas, charts, conditional formatting, and dropdown selections, users can instantly analyze performance without expensive software systems.
In simple terms, the dashboard helps you:
- Track production efficiency
- Monitor quality performance
- Compare targets vs actual results
- Analyze monthly and yearly trends
- Improve operational decision-making
Why Do Leather Processing Companies Need KPI Tracking?
Leather processing involves multiple stages, and each stage directly affects product quality and cost. Therefore, performance monitoring becomes essential.
Without KPI tracking:
- Production delays increase
- Material wastage goes unnoticed
- Quality defects rise
- Costs become difficult to control
- Management decisions rely on assumptions
On the other hand, when companies track KPIs regularly, they gain visibility into operations. Consequently, managers detect problems early and implement corrective actions quickly.
Overview of the Leather Processing KPI Dashboard in Excel
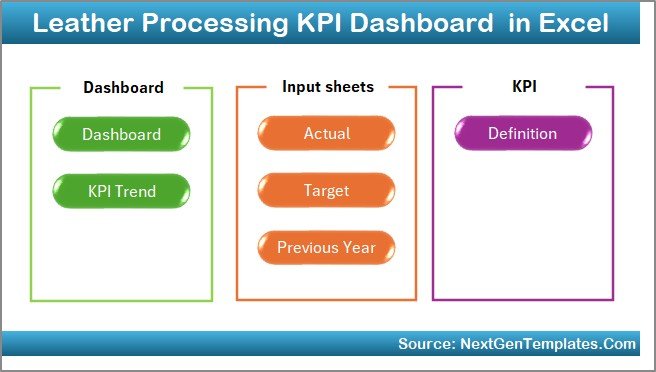
This ready-to-use dashboard provides a structured system for tracking leather industry KPIs efficiently. The workbook contains seven well-organized worksheets, each designed for a specific purpose.
Let’s explore each sheet in detail.
Summary Page – How Does Navigation Become Easier?
The Summary Page works as the dashboard index.
Here, users find six navigation buttons that allow instant movement between sheets. As a result, users do not waste time searching through tabs.
Key Benefits of the Summary Page
- Quick navigation across the dashboard
- User-friendly interface
- Structured workflow
- Improved usability for non-technical users
Therefore, even beginners can operate the dashboard easily.
Click to buy Leather Processing KPI Dashboard in Excel
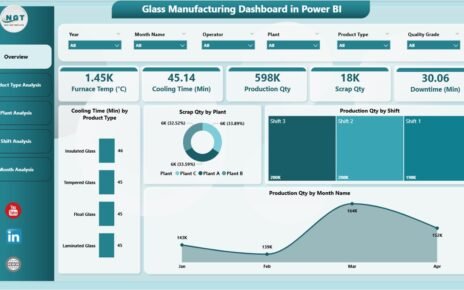
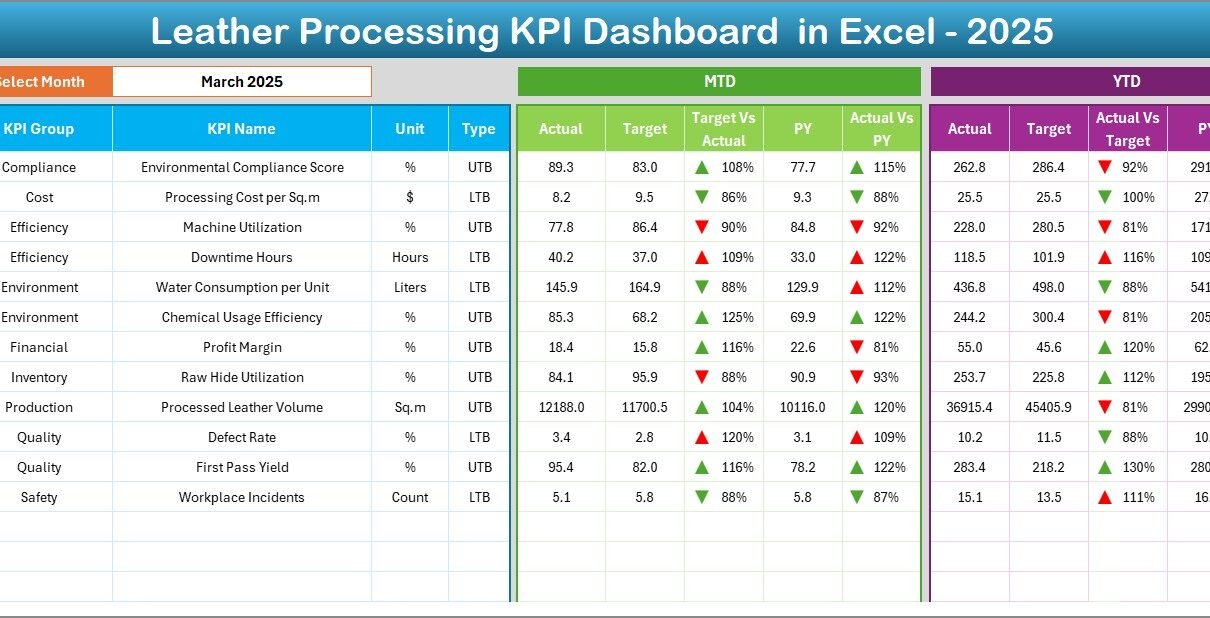
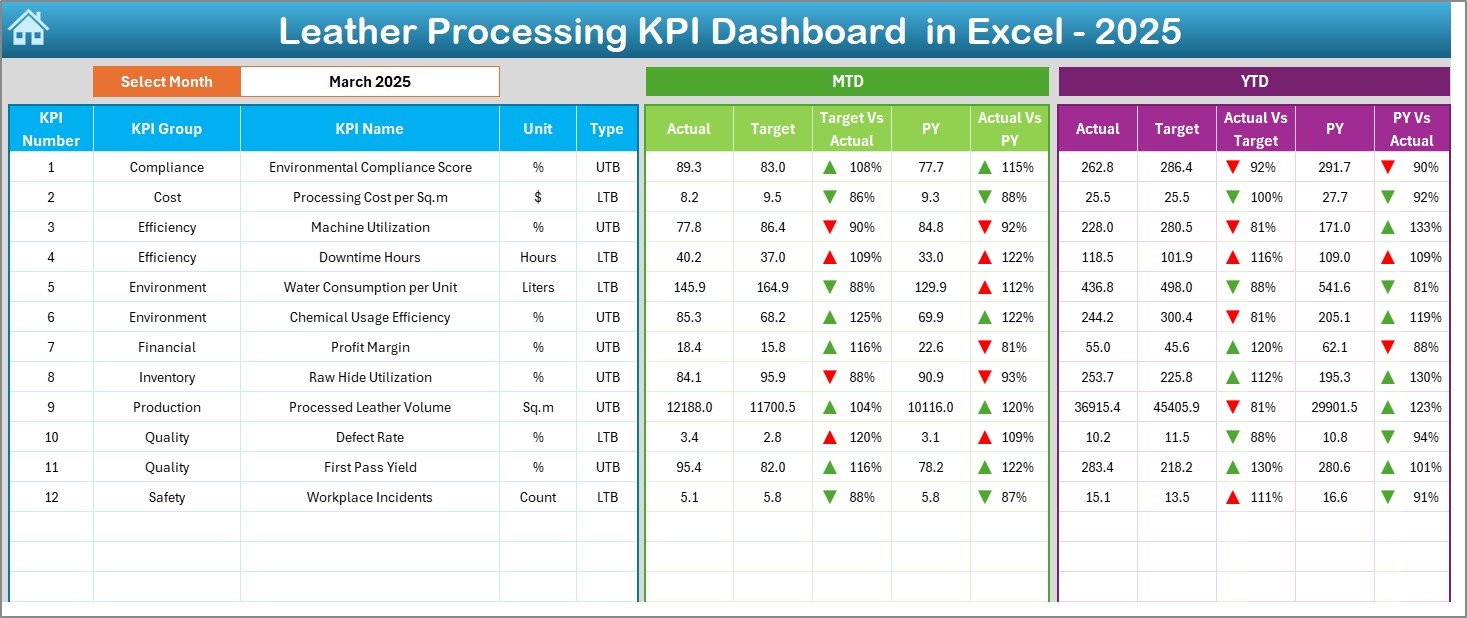
Dashboard Sheet – What Makes It the Core of the System?
The Dashboard Sheet serves as the main analysis page where all KPI insights appear.
On cell D3, users select the month using a dropdown menu. Immediately, the entire dashboard updates automatically for the selected period.
Metrics Displayed on the Dashboard
The dashboard shows both monthly and yearly performance:
MTD (Month-To-Date) Analysis
- Actual values
- Target values
- Previous year comparison
- Target vs Actual indicators
- Previous Year vs Actual indicators
YTD (Year-To-Date) Analysis
- YTD Actual performance
- YTD Targets
- Previous year YTD results
- Performance comparison visuals
Conditional formatting arrows clearly indicate:
- Performance improvement
- Performance decline
Because of visual indicators, managers can interpret performance within seconds.
Click to buy Leather Processing KPI Dashboard in Excel
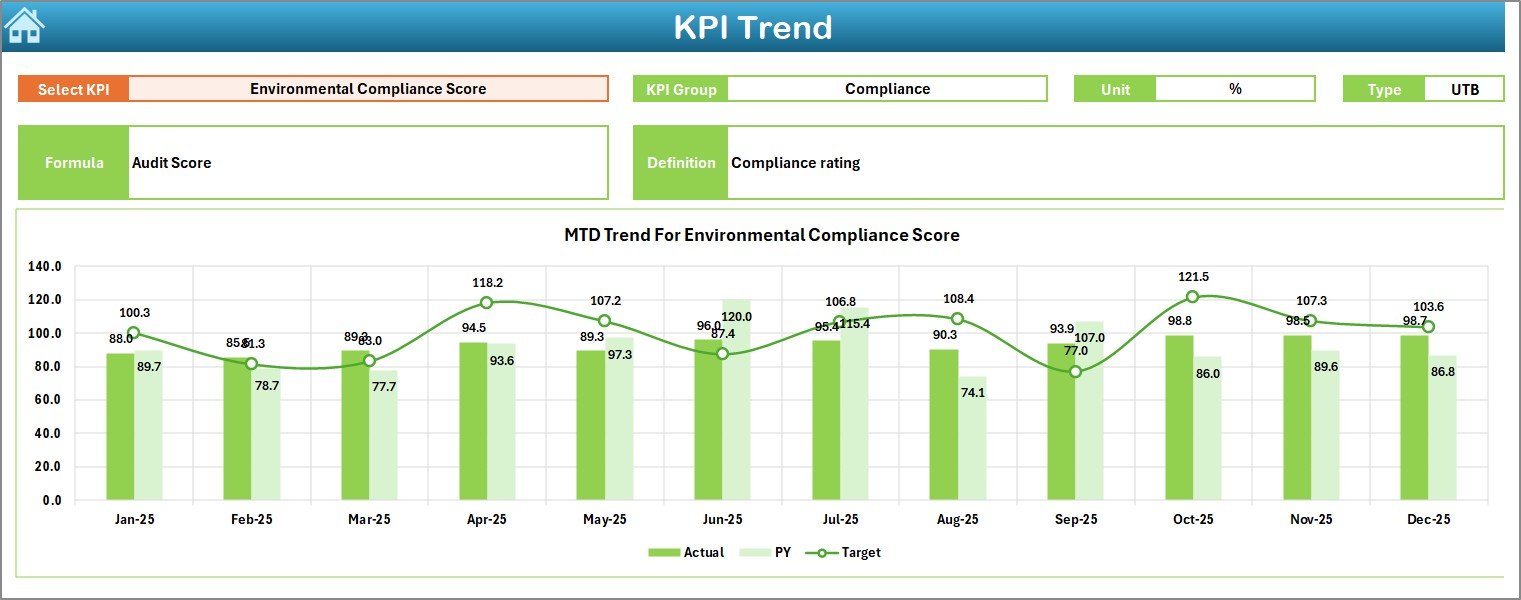
Trend Sheet – How Can You Analyze KPI Performance Over Time?
The Trend Sheet focuses on deep KPI analysis.
Users select a KPI from the dropdown located in cell C3, and the dashboard automatically displays related information.
Information Displayed
- KPI Group
- KPI Unit
- KPI Type (Upper the Better / Lower the Better)
- KPI Formula
- KPI Definition
Additionally, the sheet presents:
- MTD Trend Chart
- YTD Trend Chart
- Actual vs Target comparison
- Previous Year performance trends
As a result, decision-makers understand performance patterns instead of reviewing isolated numbers.
Click to buy Leather Processing KPI Dashboard in Excel
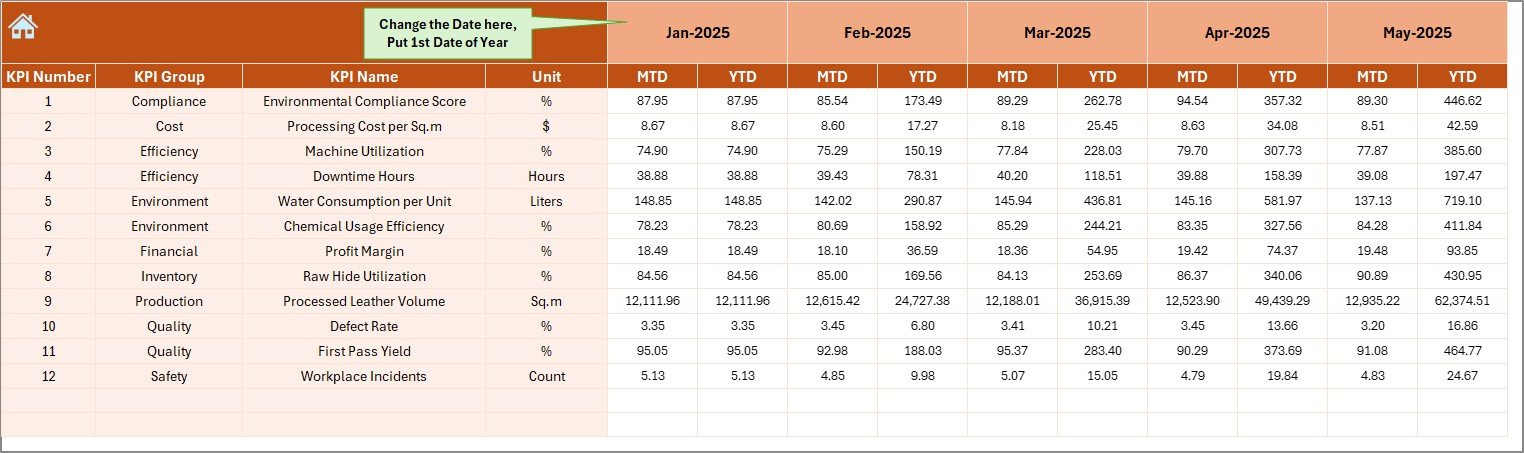
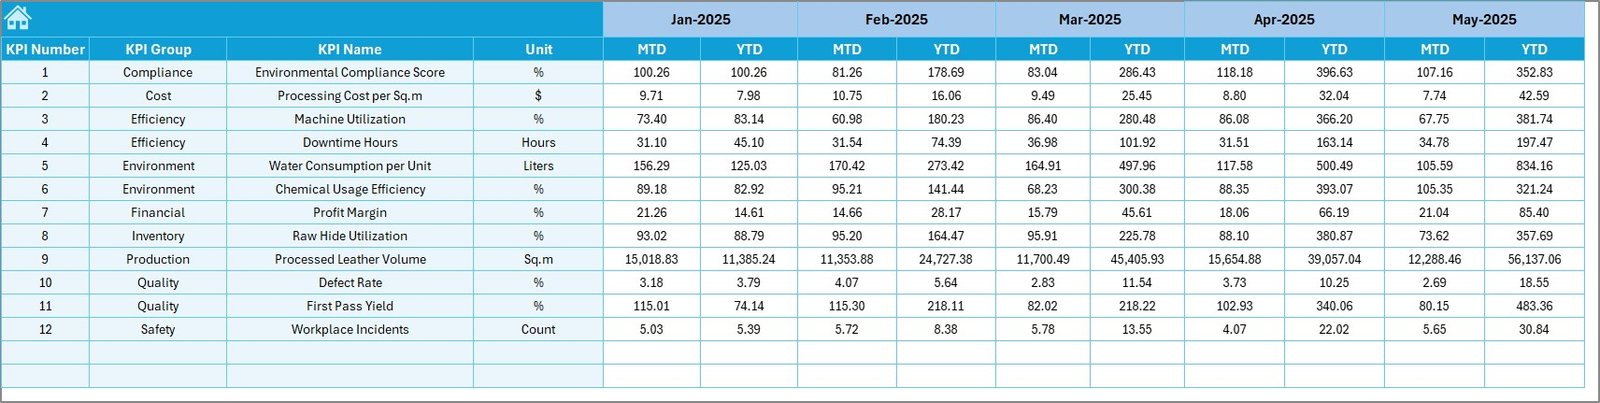
Actual Numbers Input Sheet – Where Do You Enter Real Data?
The Actual Numbers Input Sheet allows users to enter operational data.
You simply input actual KPI values for each month.
Important Feature
- Month selection available in cell E1
- Enter the first month of the year once
- Dashboard updates automatically afterward
Therefore, data entry remains simple and structured.
Click to buy Leather Processing KPI Dashboard in Excel
Target Sheet – How Do You Define Performance Goals?
The Target Sheet stores monthly KPI targets.
Users enter:
- Monthly targets (MTD)
- Yearly cumulative targets (YTD)
Because targets remain centralized, teams maintain consistency across reporting periods.
Click to buy Leather Processing KPI Dashboard in Excel
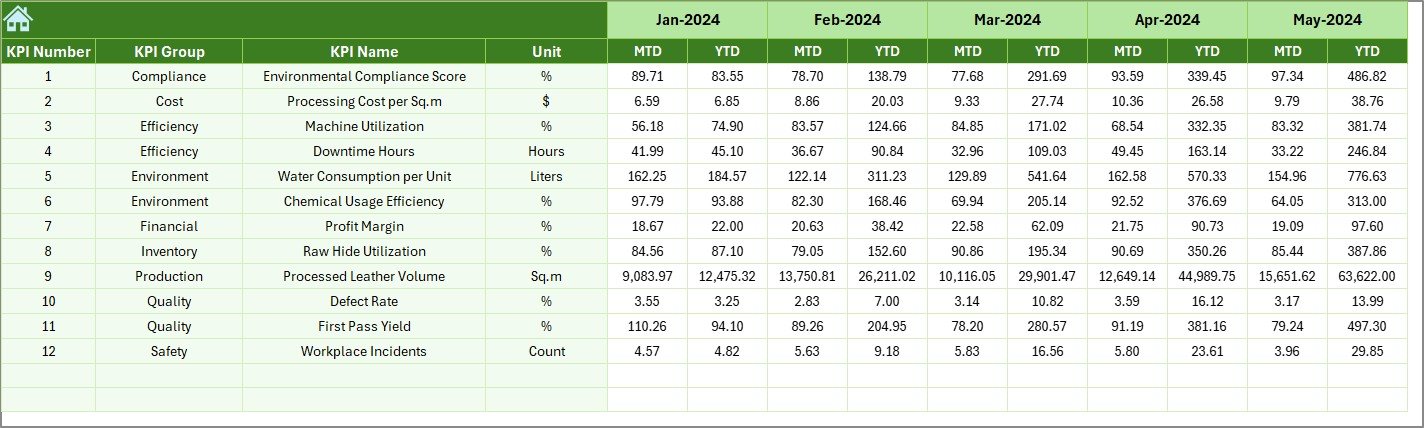
Previous Year Number Sheet – Why Historical Comparison Matters?
Performance evaluation becomes meaningful only when compared with historical results.
The Previous Year Number Sheet stores last year’s KPI values.
This comparison helps organizations:
- Identify growth trends
- Measure operational improvement
- Evaluate strategic decisions
Consequently, management gains long-term performance visibility.
Click to buy Leather Processing KPI Dashboard in Excel
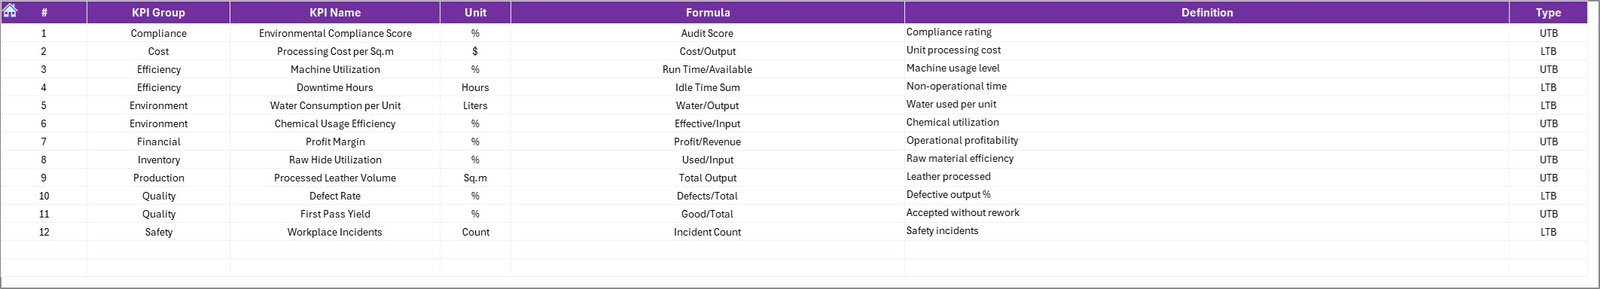
KPI Definition Sheet – Why Standardized KPI Definitions Are Essential?
The KPI Definition Sheet acts as the foundation of the dashboard.
Here, users define:
- KPI Name
- KPI Group
- Unit of Measurement
- Formula
- KPI Definition
Because all KPIs follow standardized definitions, reporting stays consistent across departments.
Click to buy Leather Processing KPI Dashboard in Excel
Which KPIs Can You Track in Leather Processing?
Although companies can customize KPIs, common leather processing indicators include:
- Production Yield %
- Chemical Consumption Rate
- Water Usage per Batch
- Defect Rate %
- Reprocessing Percentage
- Machine Utilization
- Order Completion Rate
- Energy Consumption per Unit
- Labor Productivity
- Delivery Timeliness
Tracking these KPIs ensures operational transparency.
How Does the Dashboard Improve Decision-Making?
A KPI dashboard transforms raw numbers into meaningful insights.
Managers Can:
- Identify bottlenecks quickly
- Compare plant performance monthly
- Detect quality issues early
- Optimize resource utilization
- Reduce operational costs
Therefore, decisions become data-driven instead of assumption-based.
Advantages of Leather Processing KPI Dashboard in Excel
Using this dashboard provides several operational and strategic advantages.
Centralized Performance Monitoring
All KPIs remain available in one place, which eliminates scattered reporting.
Real-Time Insights
Whenever users update data, charts and metrics refresh instantly.
Easy to Use
Excel familiarity reduces training requirements.
Cost-Effective Solution
Companies avoid expensive ERP analytics tools.
Visual Performance Indicators
Conditional formatting highlights success and risk areas immediately.
Historical Comparison
Previous year data helps measure improvement trends.
Better Accountability
Teams clearly understand performance expectations.
How to Implement the Leather Processing KPI Dashboard Successfully?
Implementation requires a structured approach.
Step 1: Identify Key KPIs
Select KPIs aligned with production, quality, and sustainability goals.
Step 2: Define KPI Formulas
Ensure all departments follow the same measurement logic.
Step 3: Enter Target Values
Set realistic monthly and yearly targets.
Step 4: Input Historical Data
Add previous year numbers for benchmarking.
Step 5: Update Actual Data Monthly
Maintain consistent data entry discipline.
Step 6: Review Trends Regularly
Conduct monthly KPI review meetings.
Best Practices for the Leather Processing KPI Dashboard in Excel
Following best practices ensures maximum dashboard effectiveness.
Keep KPIs Limited and Relevant
Too many KPIs create confusion. Focus on critical metrics.
Maintain Data Accuracy
Always validate input data before analysis.
Update Data Consistently
Enter data at fixed intervals to maintain reliability.
Use Standard Units
Avoid mixing measurement formats.
Train Team Members
Ensure users understand KPI meaning and impact.
Review Targets Periodically
Adjust targets based on operational improvements.
Backup Dashboard Files
Protect historical performance records.
How Does Excel Make KPI Dashboards Powerful?
Excel remains one of the most flexible business tools.
Excel Features Used in the Dashboard
- Dropdown lists
- Conditional formatting arrows
- Dynamic formulas
- Trend charts
- Data validation
- Structured tables
Because of these features, Excel delivers enterprise-level analytics at minimal cost.
Who Can Benefit from This KPI Dashboard?
Many roles within a leather processing organization benefit from this dashboard.
Production Managers
Monitor efficiency and throughput.
Quality Control Teams
Track defect rates and reprocessing levels.
Plant Managers
Analyze operational performance trends.
Business Owners
Evaluate profitability drivers.
Operations Analysts
Generate performance insights quickly.
Future Improvements You Can Add
You can further enhance the dashboard by adding:
- Automated Power Query data imports
- Department-wise filters
- Sustainability KPIs
- Mobile-friendly views
- Automated alerts
These improvements increase analytical capability.
Conclusion
The Leather Processing KPI Dashboard in Excel provides a practical and powerful way to measure manufacturing performance. Instead of relying on scattered reports, organizations gain a centralized system that delivers clarity, consistency, and actionable insights.
Moreover, the dashboard simplifies complex performance analysis through automation, visualization, and structured KPI tracking. As a result, leather manufacturers improve productivity, control costs, and maintain quality standards more effectively.
When companies consistently track KPIs and analyze trends, they build a culture of continuous improvement. Therefore, adopting a KPI dashboard becomes not just a reporting solution but a strategic advantage.
Frequently Asked Questions (FAQs)
What is a KPI dashboard in leather processing?
A KPI dashboard is a performance monitoring tool that tracks operational, quality, and efficiency metrics across leather manufacturing processes.
Can small leather businesses use this dashboard?
Yes. Since the dashboard runs in Excel, small and medium businesses can implement it easily without large investments.
How often should KPI data be updated?
You should update KPI data monthly or weekly depending on operational requirements.
Do I need advanced Excel skills to use it?
No. The dashboard uses dropdowns and structured sheets, so basic Excel knowledge works perfectly.
Can I customize KPIs?
Yes. You can modify KPI definitions, formulas, and targets according to business needs.
Why compare with previous year data?
Historical comparison helps measure improvement, identify seasonal trends, and evaluate business strategies.
Is Excel reliable for KPI dashboards?
Yes. Excel provides powerful analytical features and remains one of the most widely used business intelligence tools worldwide.
Visit our YouTube channel to learn step-by-step video tutorials
Watch the step-by-step video tutorial:
Click to buy Leather Processing KPI Dashboard in Excel