In today’s highly regulated business environment, compliance is more than just a checklist—it’s a strategic necessity. Organizations must meet legal requirements, adhere to industry standards, and respond quickly to any changes in regulations. Failing to do so can lead to penalties, reputational damage, and even operational shutdowns.
A Legal Compliance Dashboard in Power BI offers a modern, data-driven solution to track, analyze, and improve compliance processes. By integrating compliance data into visually rich and interactive reports, organizations can monitor performance in real time, identify risks early, and make informed decisions.
This guide explores everything you need to know about the Legal Compliance Dashboard in Power BI—from its structure and features to its advantages, best practices, and real-world applications.
Click to Purchases Legal Compliance Dashboard in Power BI
What is the Legal Compliance Dashboard in Power BI?
The Legal Compliance Dashboard in Power BI is a pre-built, ready-to-use reporting tool that captures compliance data (often stored in Excel or other sources) and transforms it into actionable insights. It organizes compliance metrics into five dedicated pages—Overview, Compliance Analysis, Department Analysis, Priority Analysis, and Monthly Trends—providing different perspectives for management, compliance officers, and department heads.
It enables:
-
Centralized compliance monitoring
-
Data-driven decision-making
-
Instant performance tracking
-
Identification of compliance delays and risks
Key Features of the Legal Compliance Dashboard in Power BI
The dashboard is structured into five pages, each with 6 slicers for filtering and multiple charts for deeper analysis.
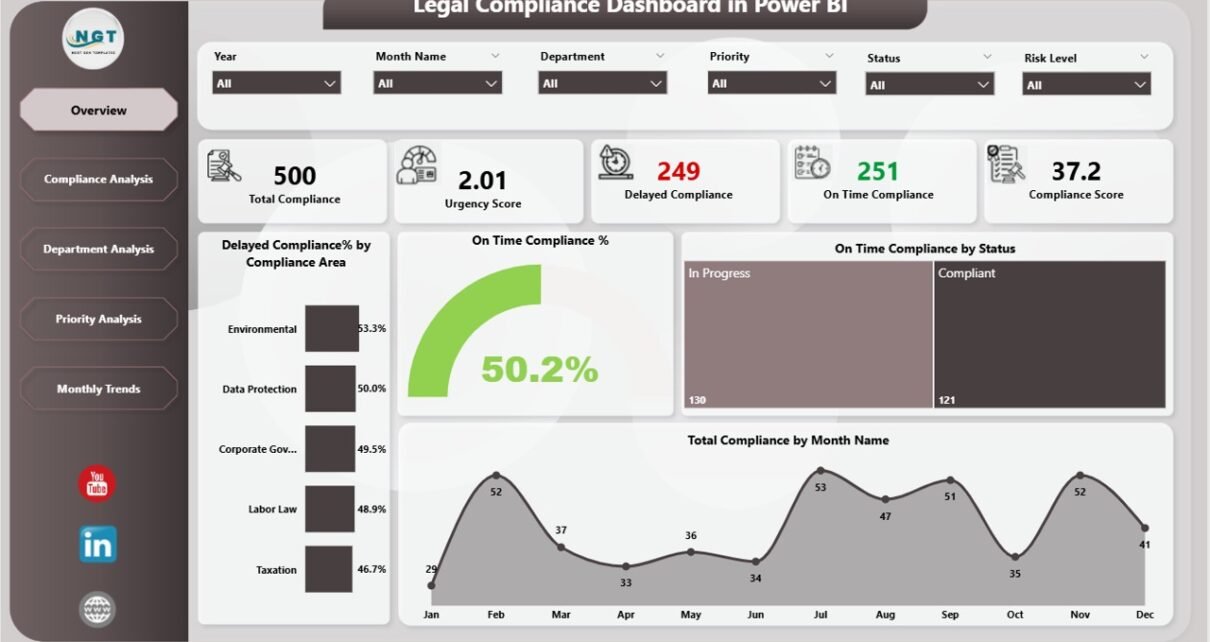
Overview Page
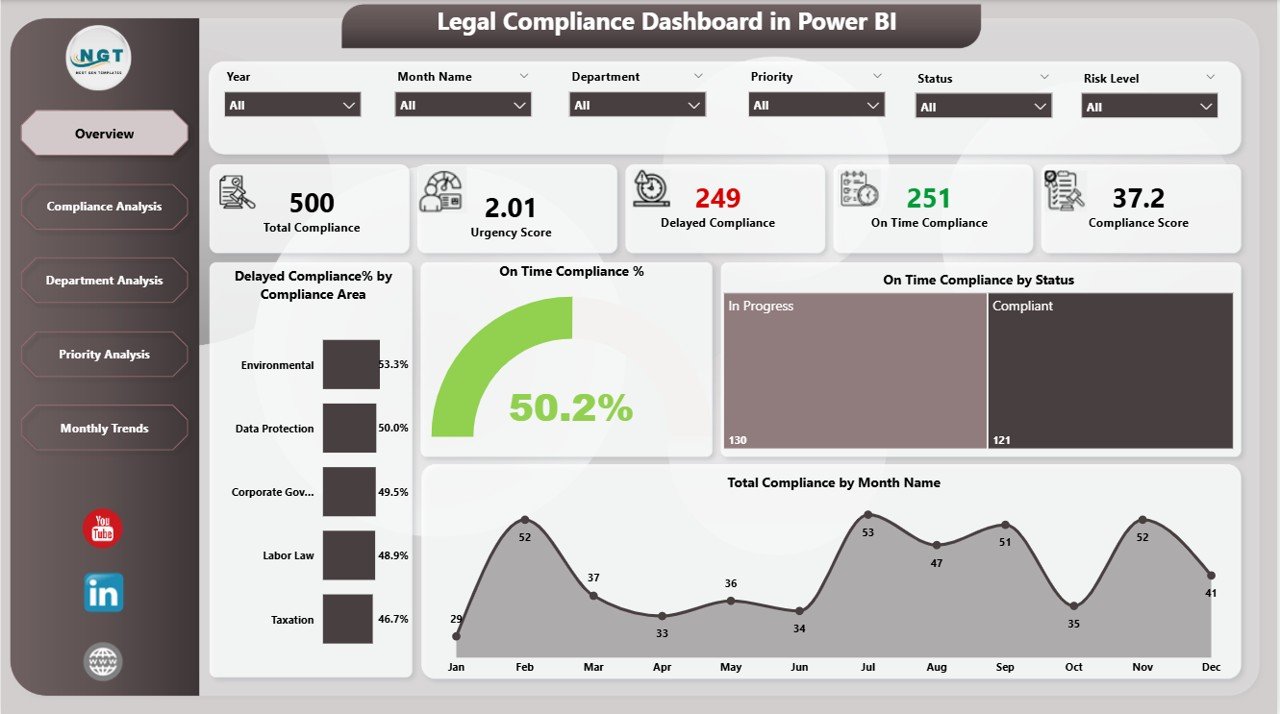
This is the main page that provides a high-level compliance summary.
-
6 Slicers: Allow filtering by compliance area, department, priority, month, and other relevant dimensions.
-
5 Cards: Display important summary metrics such as Total Compliance Count, Delayed Compliance %, On-time Compliance %, and Compliance Score.
4 Charts:
- Delayed Compliance % by Compliance Area
- On-time Compliance %
- On-time Compliance by Status
- Total Compliance by Month Name
This page gives management an instant understanding of overall compliance health.
Compliance Analysis Page
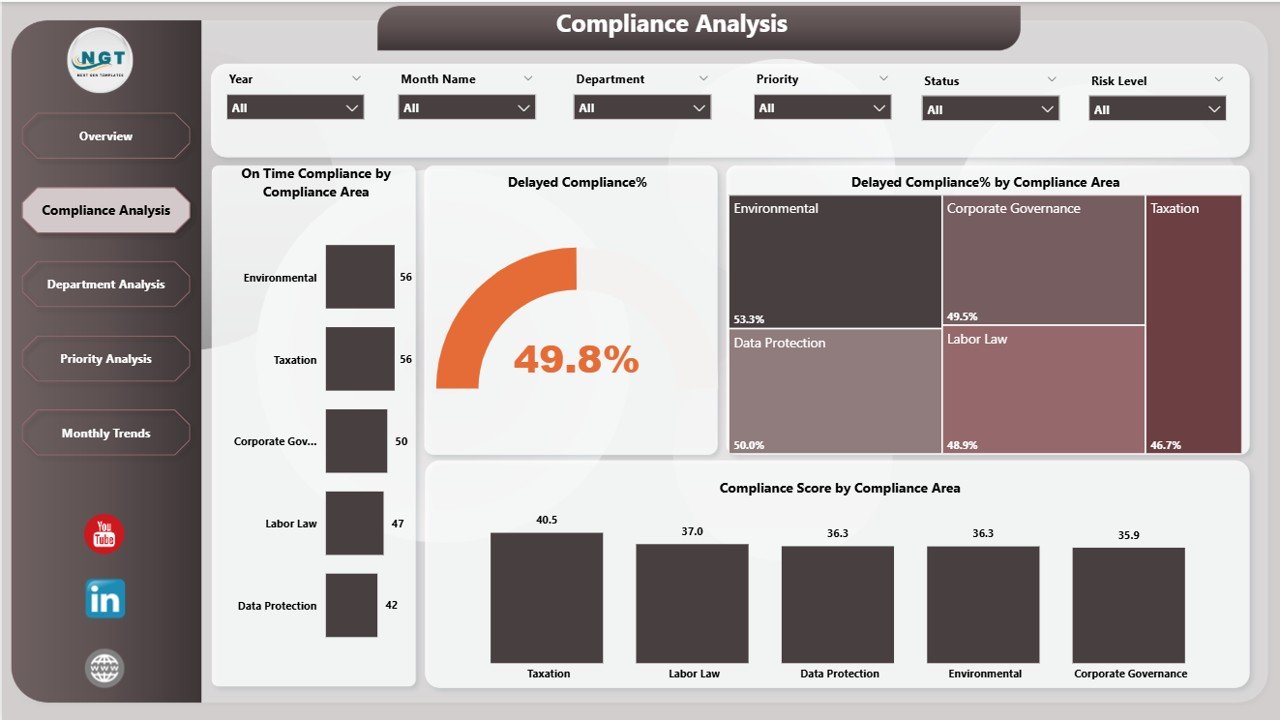
A detailed look at compliance performance by area.
-
6 Slicers: To drill down by time period, department, priority, compliance type, and more.
4 Charts:
- On-time Compliance by Compliance Area
- Delayed Compliance %
- Delayed Compliance % by Compliance Area
- Compliance Score by Compliance Area
This view helps identify which compliance areas consistently meet deadlines and which require attention.
Department Analysis Page
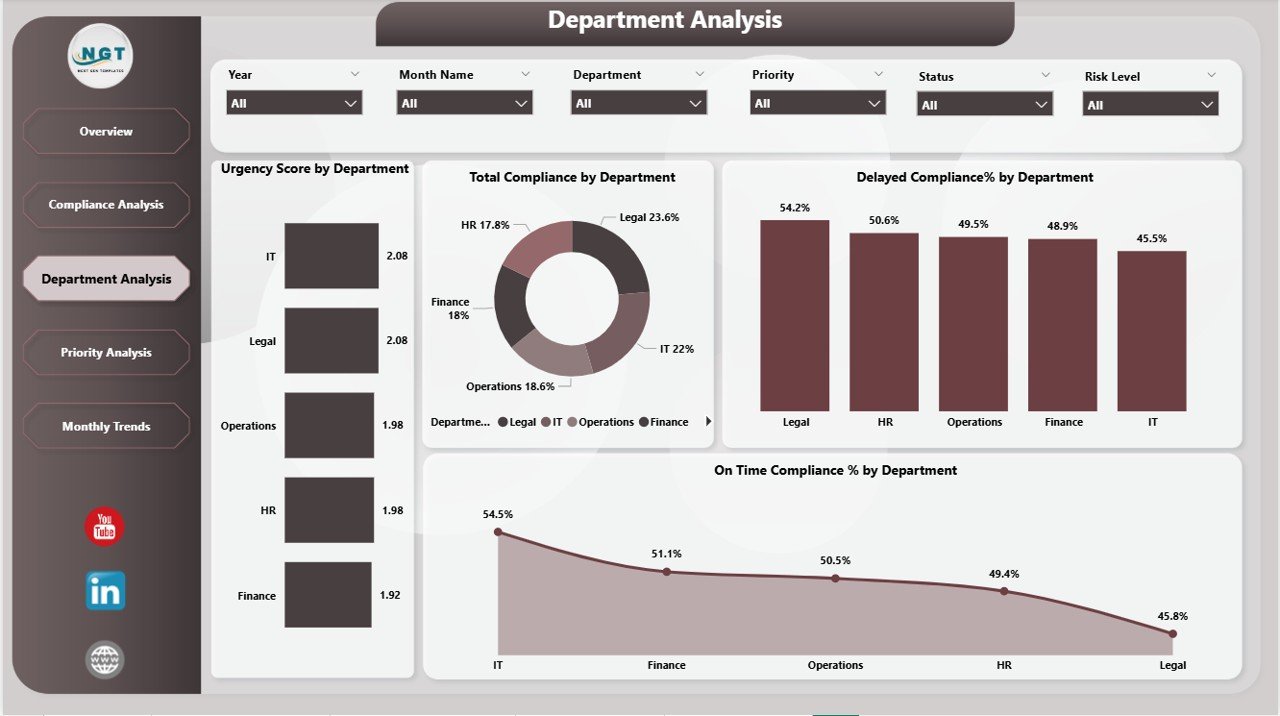
Focuses on department-level compliance.
-
6 Slicers: Department, priority, month, compliance area, and other filters.
4 Charts:
- Urgency Score by Department
- Total Compliance by Department
- Delayed Compliance % by Department
- On-time Compliance % by Department
This page is useful for department heads to monitor their own teams’ compliance performance.
Click to Purchases Legal Compliance Dashboard in Power BI
Priority Analysis Page
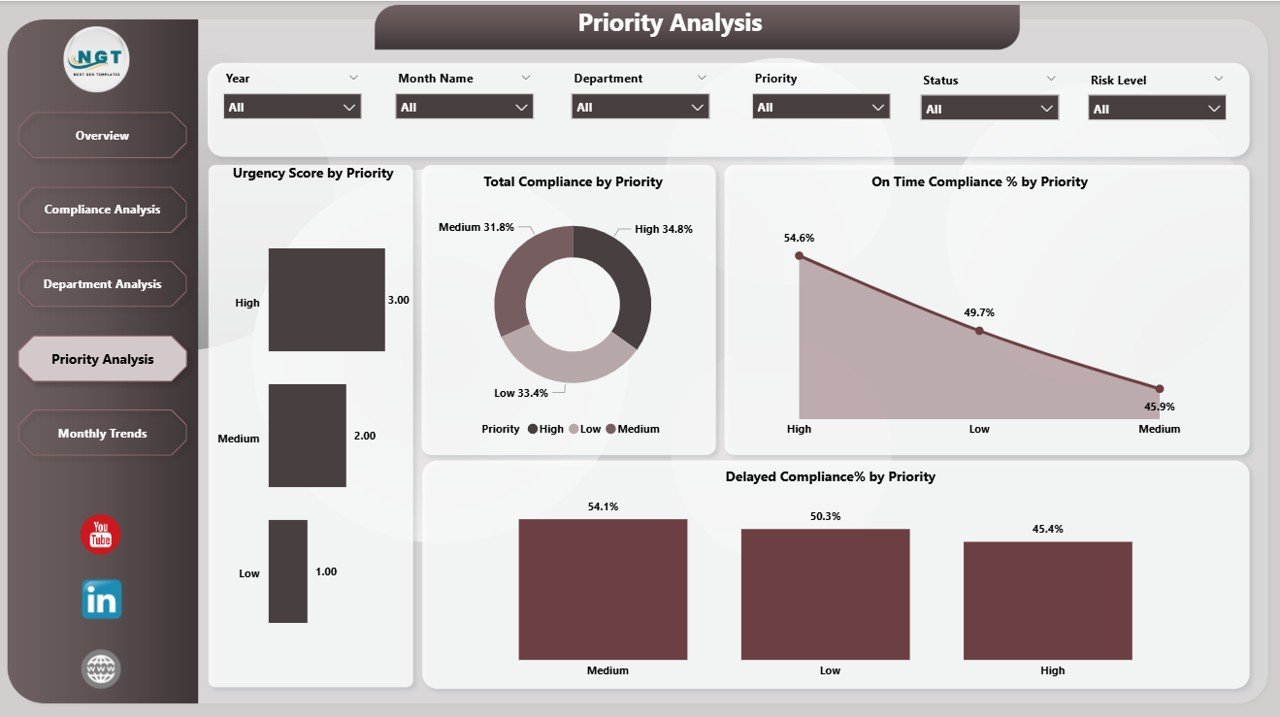
Analyzes compliance by priority level.
-
6 Slicers: Priority, department, compliance area, month, and more.
4 Charts:
- Urgency Score by Priority
- Total Compliance by Priority
- Delayed Compliance % by Priority
- On-time Compliance % by Priority
It helps determine whether high-priority compliance items are being addressed promptly.
Monthly Trends Page
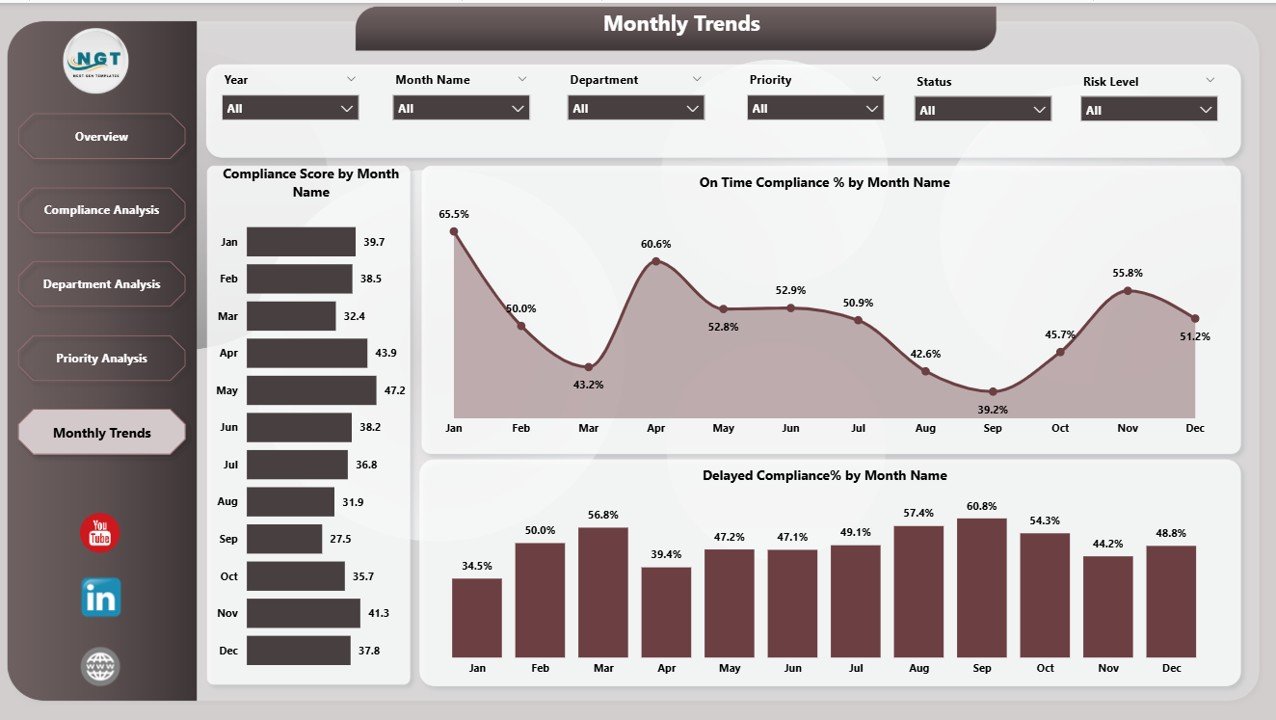
Tracks compliance performance over time.
-
6 Slicers: Month, department, compliance area, and more.
3 Charts:
- Compliance Score by Month Name
- On-time Compliance % by Month Name
- Delayed Compliance % by Month Name
This page is essential for trend analysis, seasonality detection, and long-term performance evaluation.
Advantages of the Legal Compliance Dashboard in Power BI
The dashboard offers multiple benefits to organizations:
-
📊 Centralized Monitoring – All compliance data in one interactive dashboard.
-
⏱ Real-time Tracking – Instant updates to monitor current compliance status.
-
🎯 Focused Insights – Filter by department, compliance area, or priority for targeted views.
-
📉 Delay Identification – Quickly spot areas with high delayed compliance percentages.
-
📈 Performance Improvement – Measure progress and take corrective actions.
-
🔍 Transparency – Enables clear reporting to management and regulators.
-
🛡 Risk Mitigation – Identify compliance gaps before they turn into serious issues.
Why Businesses Need a Legal Compliance Dashboard
In the absence of an integrated compliance monitoring system:
-
Data remains scattered across spreadsheets and emails.
-
Tracking deadlines becomes error-prone.
-
Compliance performance is visible only after audits—too late for proactive action.
With a Power BI dashboard, compliance officers get proactive alerts and visual performance indicators to act before deadlines are missed.
Opportunities for Improvement in Legal Compliance Monitoring
Even with a strong dashboard in place, organizations can further enhance their compliance monitoring by:
-
Integrating Multiple Data Sources – Connect Power BI to ERP, HR, or legal case management systems for automatic data updates.
-
Adding Predictive Analytics – Forecast compliance risks using historical trends.
-
Automating Notifications – Trigger alerts for approaching deadlines or risk thresholds.
-
Customizing KPIs – Tailor key metrics to align with business priorities.
-
Expanding Scope – Include environmental, health, and safety compliance indicators.
Best Practices for Using the Legal Compliance Dashboard in Power BI
To maximize the value of your dashboard:
-
Regular Data Updates: Ensure your Excel or data source is refreshed regularly to maintain accuracy.
-
Consistent Data Entry: Use standardized compliance categories, priority levels, and department names.
-
Train Stakeholders: Educate users on interpreting charts and using slicers effectively.
-
Set Clear KPIs: Define what counts as “on-time” or “delayed” to maintain consistency.
-
Monitor Trends: Use the Monthly Trends page to detect recurring issues.
-
Leverage Filters: Apply slicers for deeper insights rather than relying on raw totals.
-
Review Regularly: Schedule compliance performance reviews using dashboard insights.
How to Build or Customize the Legal Compliance Dashboard
If you are creating this dashboard from scratch or customizing it, follow these steps:
-
Gather Data – Collect compliance records in a structured format (Excel, database, etc.).
-
Define Metrics – Identify KPIs like On-time %, Delayed %, Compliance Score.
-
Import into Power BI – Connect your data source and load it into Power BI.
-
Create Pages – Separate dashboards into Overview, Compliance Analysis, Department Analysis, Priority Analysis, and Monthly Trends.
-
Add Slicers – Allow filtering by compliance area, department, priority, and date.
-
Build Visuals – Use bar charts, line charts, cards, and KPI visuals.
-
Apply Conditional Formatting – Highlight high-risk metrics in red, and good performance in green.
-
Publish & Share – Publish to the Power BI service and share with stakeholders.
Real-World Applications
The Legal Compliance Dashboard can be used in:
-
Corporate Legal Departments – To ensure timely contract renewals and regulatory filings.
-
Healthcare Organizations – To monitor compliance with patient safety and privacy laws.
-
Financial Institutions – To track regulatory submissions and audit readiness.
-
Manufacturing – To ensure compliance with environmental and safety standards.
-
Government Agencies – To track adherence to public policy and legal mandates.
Conclusion
The Legal Compliance Dashboard in Power BI is more than a reporting tool—it’s a strategic asset. By providing clear, real-time, and actionable insights, it helps organizations maintain compliance, reduce risk, and build a culture of accountability.
With five well-structured pages, interactive slicers, and insightful visuals, this dashboard empowers compliance officers, managers, and executives to make informed, timely decisions. When combined with best practices and continuous improvement efforts, it becomes an indispensable tool for modern compliance management.
Frequently Asked Questions (FAQs)
1. What is a Legal Compliance Dashboard in Power BI?
It is an interactive reporting tool that tracks and analyzes compliance data, helping organizations meet legal and regulatory requirements efficiently.
2. How does this dashboard get its data?
Typically, it connects to Excel or other data sources where compliance records are maintained.
3. Can I customize the dashboard?
Yes. You can change slicers, visuals, and KPIs to match your organization’s needs.
4. What KPIs should I track in a compliance dashboard?
Common KPIs include On-time Compliance %, Delayed Compliance %, Compliance Score, and Urgency Score.
5. Who should use this dashboard?
Compliance officers, department managers, executives, and audit teams.
6. Can I use real-time data with this dashboard?
Yes, if connected to live databases or systems that update regularly.
7. How often should I review compliance performance?
Monthly reviews are common, but high-risk industries may require weekly or even daily monitoring.
Visit our YouTube channel to learn step-by-step video tutorials