Legal research forms the backbone of strong legal opinions, case preparation, and compliance decisions. However, many legal teams still track research performance through emails, notes, or unstructured spreadsheets. As a result, productivity gaps remain hidden, timelines slip, and decision-makers struggle to evaluate performance.
That is exactly where a Legal Research KPI Dashboard in Excel becomes a powerful and practical solution.
In this detailed article, you will learn what a Legal Research KPI Dashboard in Excel is, how it works, its key features, advantages, best practices, and how legal teams can use it effectively to monitor research performance using MTD and YTD KPIs.
Click to Purchases Legal Research KPI Dashboard in Excel
What Is a Legal Research KPI Dashboard in Excel?
A Legal Research KPI Dashboard in Excel is a ready-to-use Excel-based reporting solution designed to track, analyze, and visualize key performance indicators related to legal research activities.
Instead of reviewing raw data manually, this dashboard transforms legal research data into clear KPIs, comparisons, and trends. As a result, law firms, legal departments, and compliance teams can make informed and timely decisions.
Because it works in Excel, teams can implement it quickly without expensive BI tools.
Why Is KPI Tracking Important for Legal Research?
Legal research performance directly impacts case outcomes, turnaround time, and compliance quality. Therefore, without KPI tracking, inefficiencies remain unnoticed.
A Legal Research KPI Dashboard helps teams:
-
Measure research productivity
-
Compare actual performance with targets
-
Track improvements over time
-
Identify bottlenecks early
-
Support data-driven legal decisions
When KPIs remain visible and measurable, research quality improves consistently.
Click to Purchases Legal Research KPI Dashboard in Excel
How Does a Legal Research KPI Dashboard in Excel Work?
This dashboard works using seven interconnected worksheets, each serving a specific role. Together, they create a complete legal research performance monitoring system.
Let us explore each worksheet in detail.
Home Sheet: Central Navigation Hub
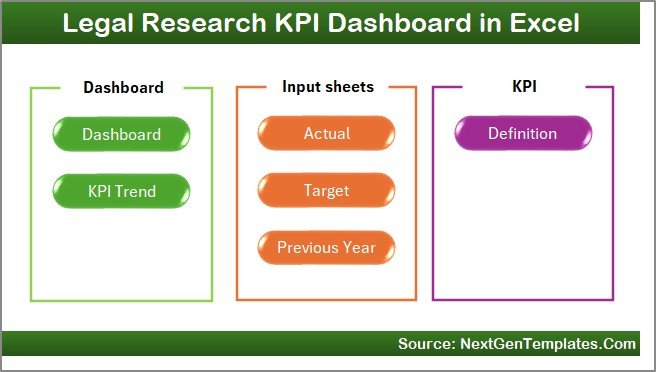
The Home sheet acts as the index page of the dashboard.
Key Purpose of the Home Sheet
On this sheet, users get six navigation buttons that allow them to jump instantly to different sections of the dashboard. Because of this design, users do not waste time searching for sheets.
As a result, navigation remains fast and user-friendly.
Click to Purchases Legal Research KPI Dashboard in Excel
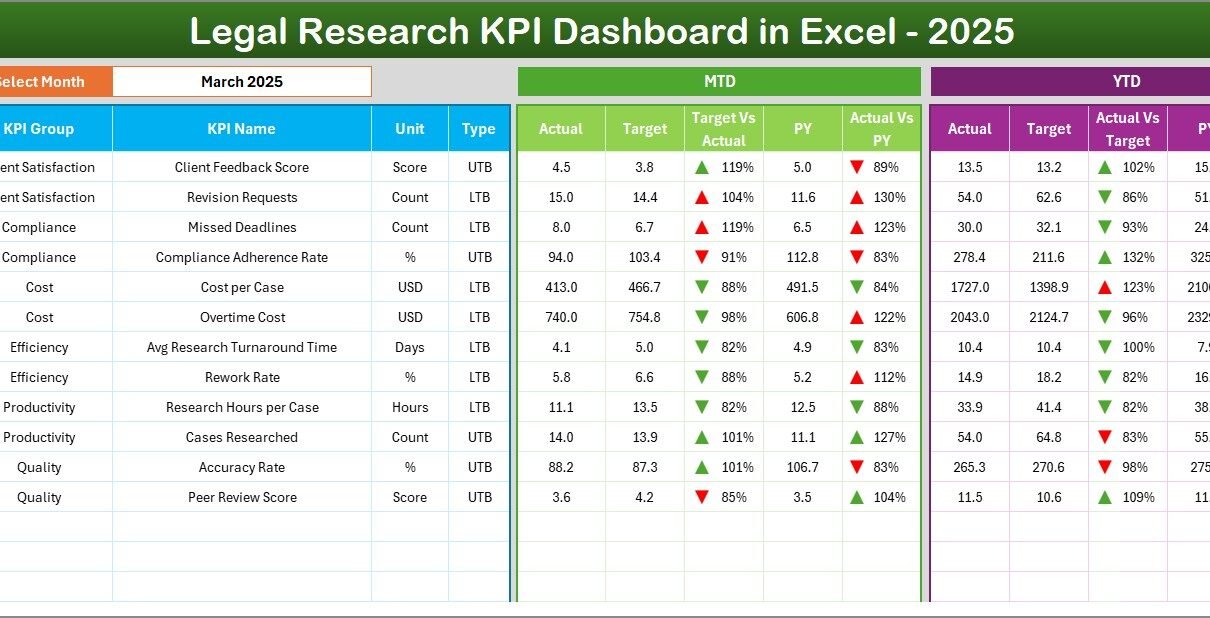
Dashboard Sheet: Main KPI Performance View
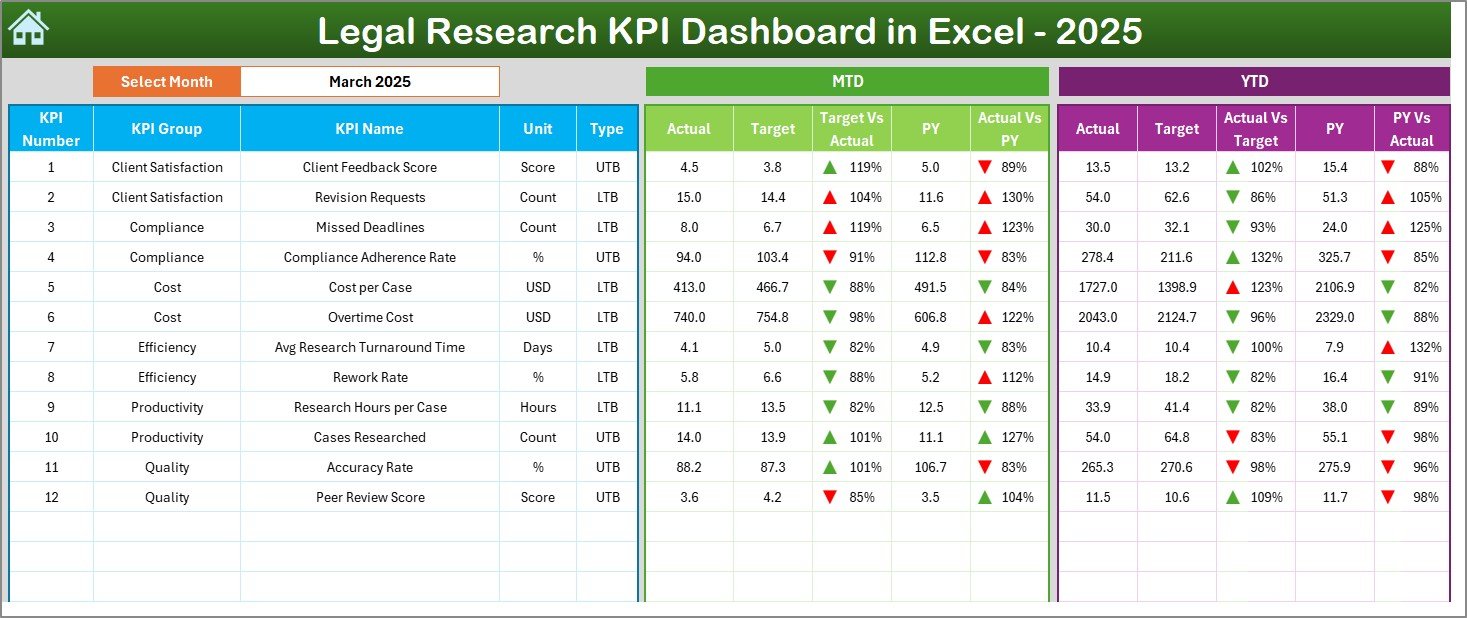
The Dashboard sheet is the core of the Legal Research KPI Dashboard in Excel.
Month Selection for Dynamic Analysis
On cell D3, users can select the Month from a drop-down list. Once selected, the entire dashboard updates automatically.
Therefore, users can analyze performance month by month without changing formulas.
MTD Performance Analysis
The dashboard displays:
-
MTD Actual
-
MTD Target
-
MTD Previous Year
It also shows:
-
Target vs Actual
-
Previous Year vs Actual
Conditional formatting with up and down arrows highlights performance direction instantly.
YTD Performance Analysis
Along with MTD, the dashboard also displays:
-
YTD Actual
-
YTD Target
-
YTD Previous Year
Again, Target vs Actual and PY vs Actual comparisons use visual indicators, making insights easy to understand.
Why This Dashboard View Matters
Because both MTD and YTD views appear together, legal managers can evaluate short-term efficiency and long-term performance in one place.
KPI Trend Sheet: Deep-Dive KPI Analysis
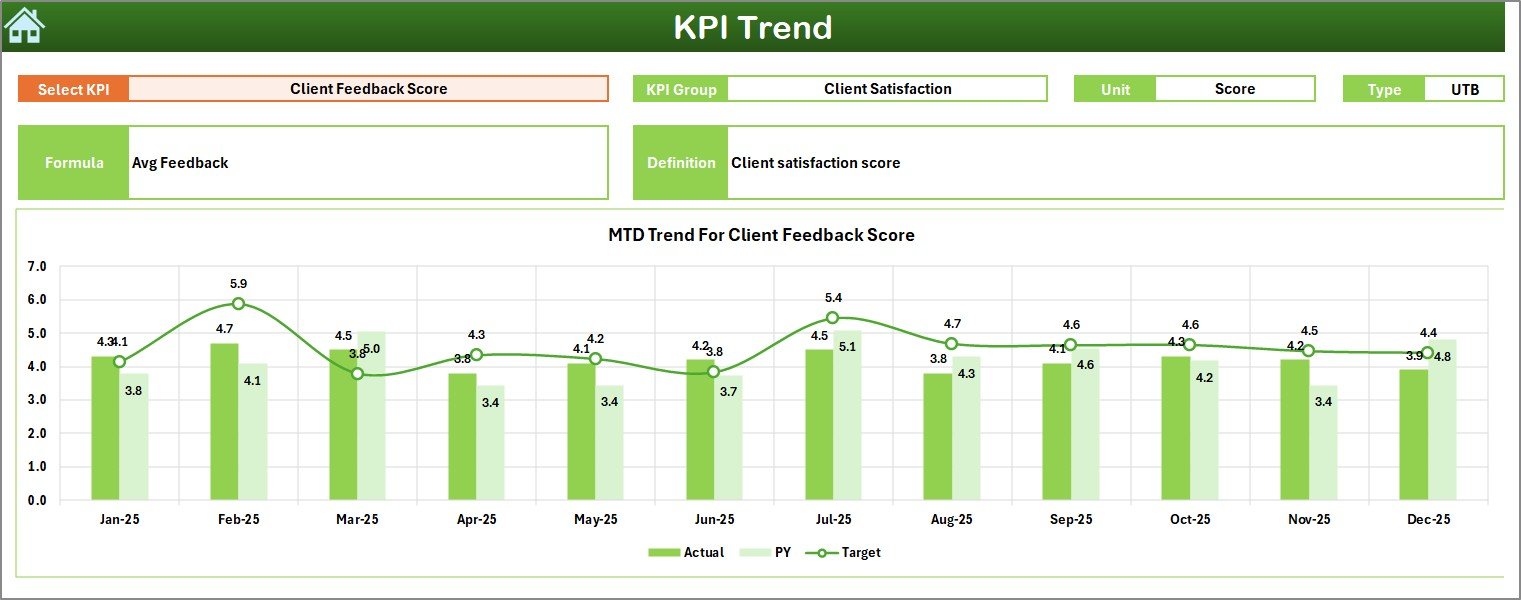
While the Dashboard sheet provides a snapshot, the KPI Trend sheet focuses on detailed KPI behavior.
KPI Selection Dropdown
On this sheet, users can select a KPI name from the drop-down available in cell C3. Once selected, all related information updates automatically.
KPI Details Displayed
For the selected KPI, the dashboard displays:
-
KPI Group
-
Unit of KPI
-
KPI Type (Lower the Better or Upper the Better)
-
KPI Formula
-
KPI Definition
This setup ensures complete clarity while analyzing trends.
MTD and YTD Trend Charts
The KPI Trend sheet also shows trend charts for:
-
Actual values
-
Target values
-
Previous Year values
These charts appear for both MTD and YTD, helping users understand performance movement over time.
Importance of Trend Analysis in Legal Research
Legal research workloads fluctuate based on cases and regulations. Therefore, trend analysis helps:
-
Identify productivity patterns
-
Detect declining performance early
-
Compare current output with previous years
As a result, planning and staffing decisions become more accurate.
Click to Purchases Legal Research KPI Dashboard in Excel
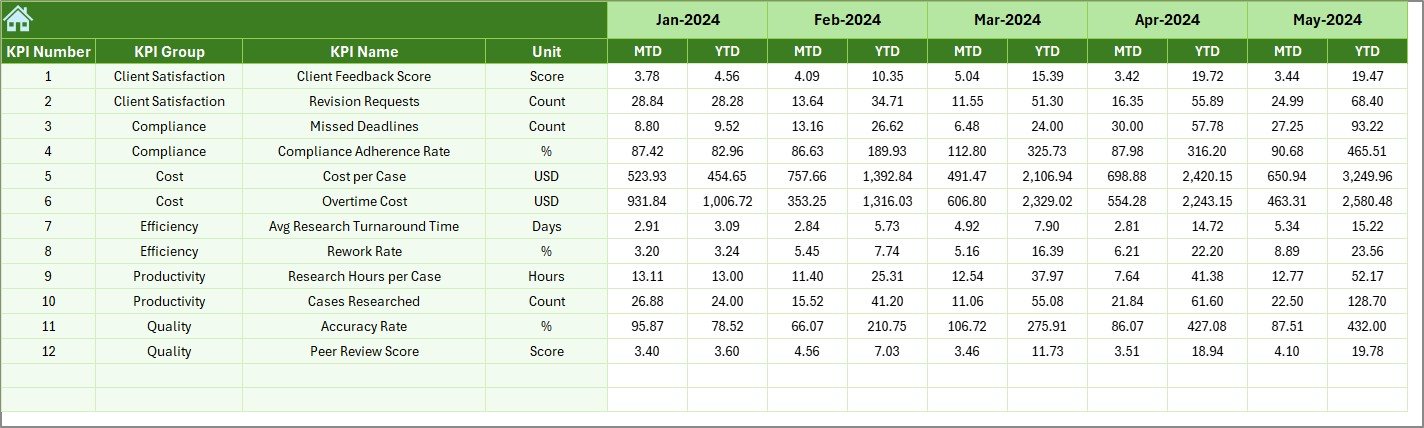
Actual Numbers Input Sheet: Data Entry Area
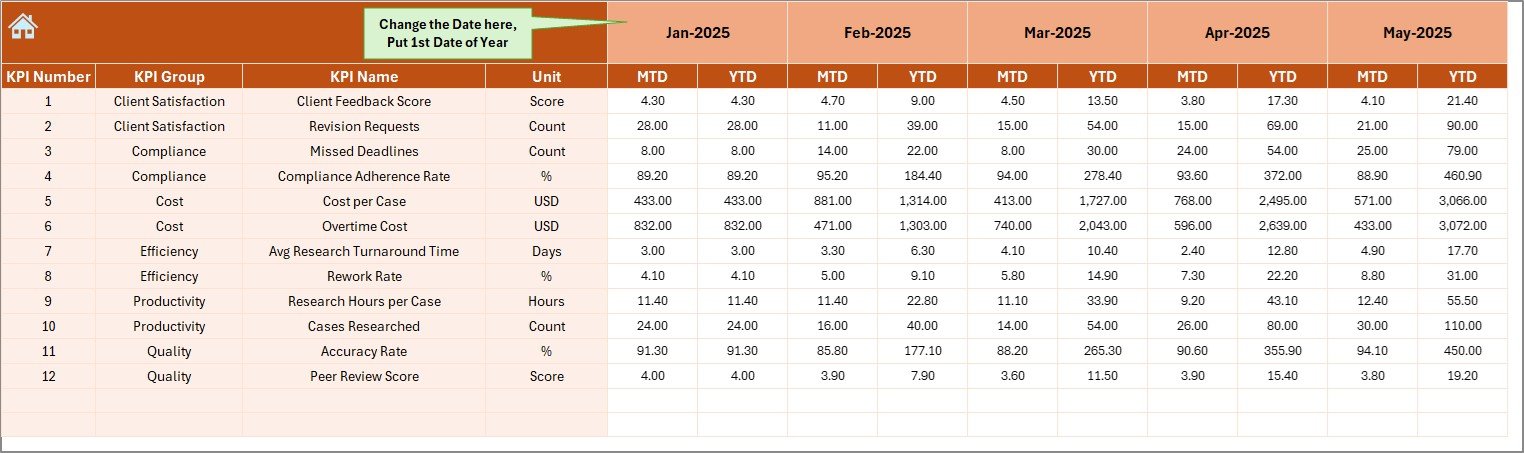
The Actual Numbers Input sheet is where users enter real performance data.
How This Sheet Works
Users can:
-
Enter MTD and YTD actual values for each KPI
-
Change the reporting month from cell E1
-
Define the first month of the year easily
Because of this structure, data entry stays simple and controlled.
Target Sheet: Define Performance Expectations
The Target sheet allows users to enter planned targets.
What Data Goes into the Target Sheet?
For each KPI, users can define:
-
MTD Target
-
YTD Target
Because targets drive performance evaluation, this sheet plays a critical role in KPI analysis.
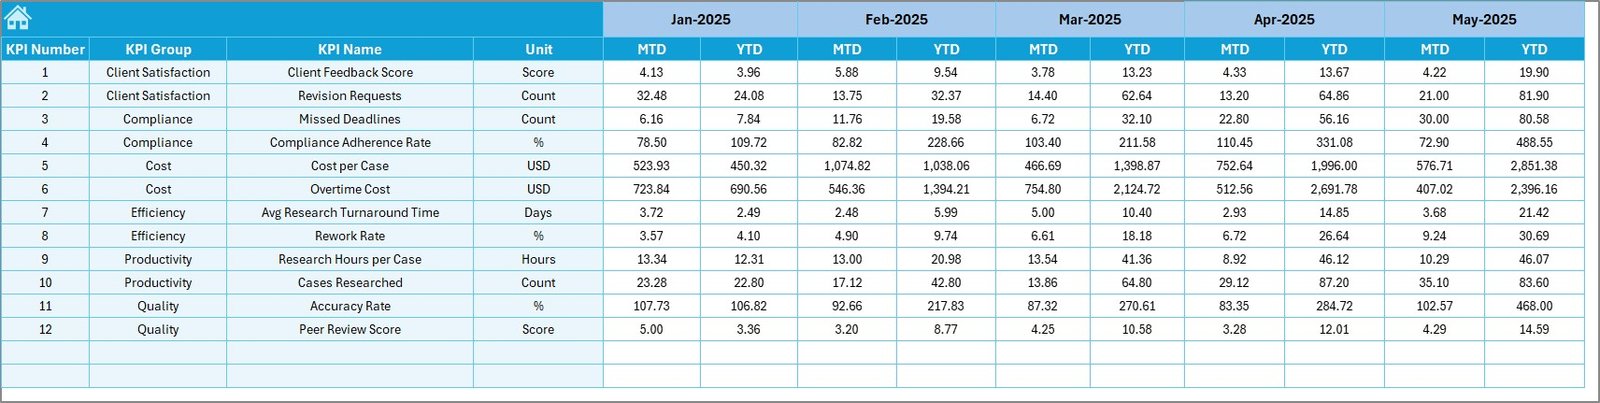
Previous Year Number Sheet: Historical Comparison
The Previous Year Number sheet stores last year’s KPI values.
Why Previous Year Data Matters
By comparing current performance with previous year numbers, legal teams can:
-
Measure improvement
-
Identify long-term trends
-
Set realistic future targets
This comparison strengthens strategic planning.
Click to Purchases Legal Research KPI Dashboard in Excel
KPI Definition Sheet: Standardize KPI Understanding
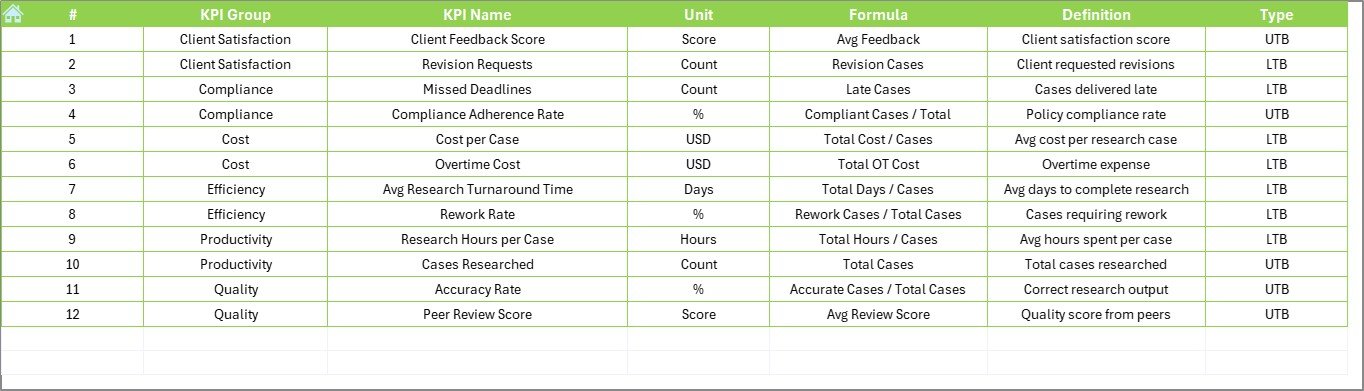
The KPI Definition sheet ensures that all KPIs remain clearly documented.
Information Captured in This Sheet
Users define:
-
KPI Name
-
KPI Group
-
Unit
-
Formula
-
KPI Definition
Because of this documentation, all stakeholders interpret KPIs consistently.
How This Dashboard Improves Legal Research Performance
This dashboard improves performance by turning data into insights.
First, it highlights gaps clearly.
Second, it tracks progress using MTD and YTD metrics.
Third, it visualizes trends for quick understanding.
Finally, it supports corrective actions on time.
Because all insights stay in one Excel file, decision-making becomes faster and more confident.
Click to Purchases Legal Research KPI Dashboard in Excel
Advantages of Legal Research KPI Dashboard in Excel
Using this dashboard offers several benefits.
Centralized KPI Monitoring
All legal research KPIs stay in one structured dashboard.
Easy to Use
Since it works in Excel, teams do not need advanced technical skills.
Visual Performance Tracking
Conditional formatting and trend charts make insights easy to interpret.
Better Target Alignment
Actual vs Target analysis keeps teams focused on goals.
Historical Performance Comparison
MTD, YTD, and PY views support long-term evaluation.
Cost-Effective Analytics Tool
This Excel dashboard removes the need for expensive BI software.
Best Practices for Legal Research KPI Dashboard in Excel
To maximize the value of this dashboard, legal teams should follow these best practices.
Define KPIs Clearly
Maintain clear KPI names, formulas, and definitions in the KPI Definition sheet.
Update Data Regularly
Frequent updates ensure accurate and reliable reporting.
Review KPIs Monthly
Monthly reviews help identify issues early.
Use Trend Analysis for Planning
Always analyze trends instead of relying only on current values.
Align Targets with Team Capacity
Set realistic targets based on workload and resources.
Who Should Use a Legal Research KPI Dashboard in Excel?
This dashboard suits many legal roles, including:
-
Law firms
-
Corporate legal departments
-
Compliance teams
-
Legal research teams
-
Regulatory bodies
-
Legal consultants
Because of its flexible design, it adapts easily to different legal environments.
Click to Purchases Legal Research KPI Dashboard in Excel
Common Use Cases of Legal Research KPI Dashboard
Organizations can use this dashboard for:
-
Legal research productivity tracking
-
Compliance research monitoring
-
Case preparation performance analysis
-
Legal team workload evaluation
Conclusion: Why Use a Legal Research KPI Dashboard in Excel?
A Legal Research KPI Dashboard in Excel provides a structured and data-driven way to monitor research performance. Instead of relying on assumptions, legal teams can track MTD and YTD performance, compare actual vs target, and analyze historical trends.
With features like interactive dashboards, KPI trend analysis, centralized data input, and clear KPI definitions, this Excel dashboard becomes an essential tool for performance-focused legal teams.
If you want better visibility, control, and efficiency in legal research operations, this KPI dashboard is a smart choice.
Frequently Asked Questions (FAQs)
What is a Legal Research KPI Dashboard in Excel?
It is an Excel-based dashboard used to track legal research KPIs using MTD, YTD, and trend analysis.
Can I customize the KPIs?
Yes, you can easily add, modify, or remove KPIs based on your legal research needs.
Does the dashboard update automatically?
Yes, the dashboard updates automatically when input data or month selection changes.
Do I need advanced Excel knowledge to use it?
No, basic Excel knowledge is enough to use this dashboard.
Can I compare current performance with previous years?
Yes, the dashboard supports full previous year comparison.
Is this dashboard suitable for small legal teams?
Yes, both small and large legal teams can use this template effectively.
Can multiple users work on this dashboard?
Yes, teams can collaborate by sharing the Excel file with appropriate access control.
Click to Purchases Legal Research KPI Dashboard in Excel
Visit our YouTube channel to learn step-by-step video tutorials