Libraries and archives play a vital role in preserving knowledge, supporting education, and serving communities. However, modern libraries no longer manage only physical books. Today, they handle digital resources, historical archives, memberships, events, operational costs, and user engagement simultaneously. Because of this complexity, library administrators must track performance using structured data.
Unfortunately, many libraries still depend on manual reports or scattered spreadsheets. As a result, decision-making becomes slow, insights remain unclear, and performance improvement becomes difficult. Therefore, organizations now require a centralized and easy-to-use monitoring solution.
This is where the Libraries and Archives Dashboard in Excel becomes extremely valuable.
The Libraries and Archives Dashboard in Excel is a ready-to-use analytical tool designed to monitor library operations, archive management, memberships, user satisfaction, and operational efficiency using interactive visuals and automated calculations — all inside Microsoft Excel.
Click to Purchases Libraries and Archives Dashboard in Excel
In this comprehensive guide, you will learn:
-
What a Libraries and Archives Dashboard in Excel is
-
Why libraries need performance dashboards
-
Dashboard structure and features
-
Page-wise analysis explained
-
Key benefits and advantages
-
Best practices for implementation
-
Frequently asked questions
Let’s explore everything step by step.
What Is a Libraries and Archives Dashboard in Excel?
A Libraries and Archives Dashboard in Excel is an interactive reporting system that helps library managers track operational and performance metrics in one centralized view.
Instead of reviewing multiple files, users can analyze data through charts, slicers, and KPI summaries. Moreover, Excel automatically updates visuals when users change filters or selections.
This dashboard helps organizations monitor:
-
Library usage trends
-
Membership registrations
-
Archive records management
-
Operating expenses
-
User satisfaction ratings
-
Event participation performance
Because Excel remains widely accessible, teams can implement this solution without investing in expensive software.
Why Do Libraries and Archives Need a Dashboard?
Libraries generate large volumes of operational data every day. However, raw data alone does not provide insights. Therefore, dashboards transform data into meaningful information.
Common Challenges Without a Dashboard
-
Reports exist in multiple spreadsheets
-
Manual calculations create errors
-
Performance tracking takes too much time
-
Management lacks real-time visibility
-
Decision-making becomes reactive instead of proactive
How a Dashboard Solves These Problems
-
Centralizes all analytics into one system
-
Automates calculations and summaries
-
Improves reporting speed
-
Enhances strategic planning
-
Enables data-driven decisions
As a result, administrators focus more on improving services rather than preparing reports.
Key Features of Libraries and Archives Dashboard in Excel
The dashboard includes several intelligent features designed for simplicity and performance monitoring.
✅ Page Navigator
Located on the left side, the Page Navigator allows users to move easily between analytical pages. Consequently, users can switch analysis views instantly without searching through sheets.
✅ Interactive Slicers
Right-side slicers enable dynamic filtering. Users can analyze data by:
-
Visit Type
-
Library Branch
-
Material Type
-
Archive Category
-
Month
Therefore, insights become instantly customizable.
✅ Visual KPI Cards
The Overview page displays four KPI cards that summarize major performance indicators at a glance. These cards help management understand overall performance quickly.
✅ Dynamic Charts
Each analytical page includes four visual charts that automatically update based on slicer selections.
✅ Structured Data & Support Sheets
The dashboard uses:
-
Data Sheet – stores raw operational data
-
Support Sheet – performs backend calculations and aggregations
Because of this structure, the dashboard remains organized and scalable.
Dashboard Structure: Understanding the 5 Analytical Pages
Click to Purchases Libraries and Archives Dashboard in Excel
The Libraries and Archives Dashboard includes five analytical pages, each designed to answer specific operational questions.
1. Overview Page – How Is Overall Library Performance?
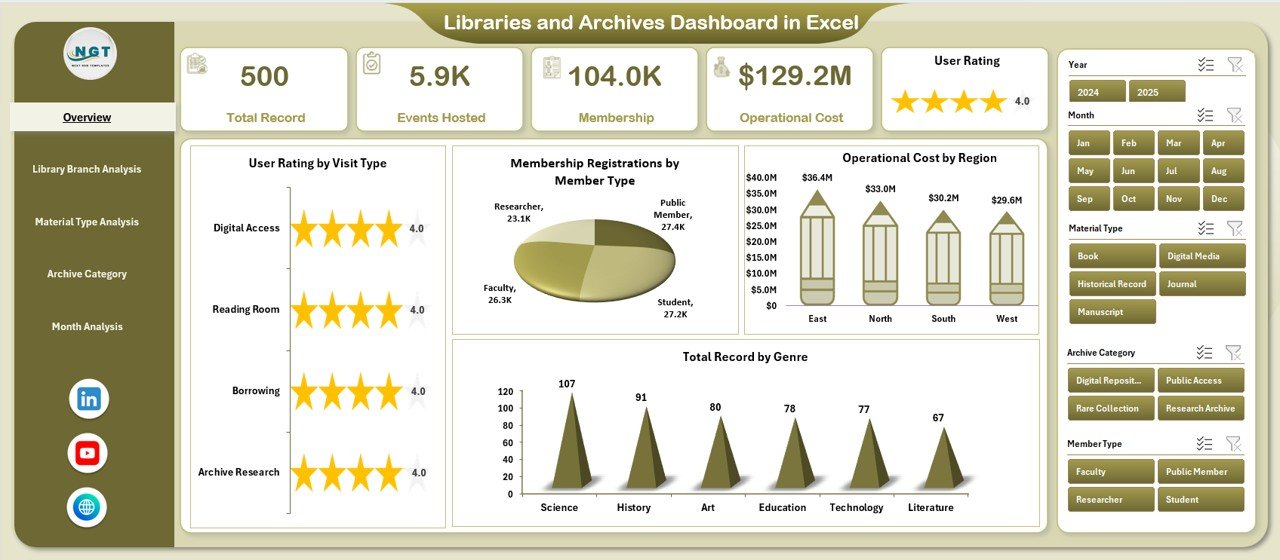
The Overview Page acts as the main dashboard interface.
What You See Here
-
Right-side slicers for filtering
-
Four KPI cards
-
High-level performance charts
Charts Included
-
User Rating by Visit Type
Shows satisfaction levels across visit categories such as study visits, research visits, or events. -
Membership Registration by Member Type
Displays registrations across students, researchers, faculty, or public members. -
Operating Cost by Region
Helps management analyze regional cost distribution. -
Total Record by Genre
Shows collection strength across genres or archive categories.
Why This Page Matters
Managers quickly understand overall trends without diving into detailed reports. Therefore, it supports executive-level decision-making.
2. Library Branch Analysis – Which Branch Performs Best?
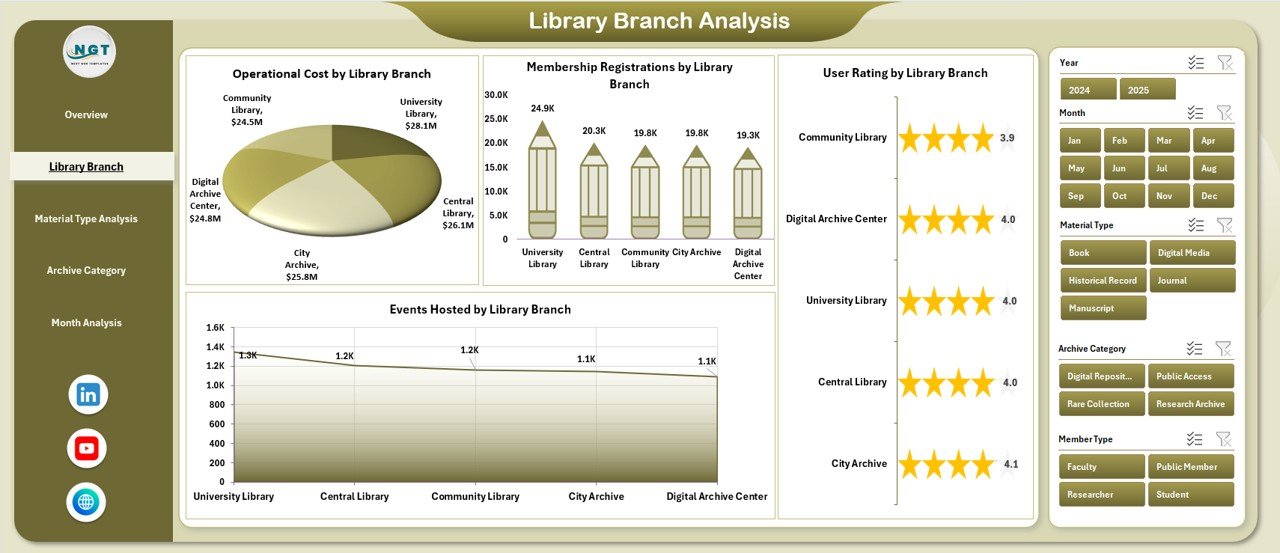
Libraries often operate across multiple locations. Therefore, branch comparison becomes essential.
Charts Included
-
User Rating by Library Branch
-
Membership Registration by Library Branch
-
Operating Cost by Library Branch
-
Events Hosted by Library Branch
Insights You Can Gain
-
Identify high-performing branches
-
Detect underutilized locations
-
Compare event engagement
-
Optimize resource allocation
As a result, management can distribute budgets and staff efficiently.
3. Material Type Analysis – Which Resources Are Most Popular?
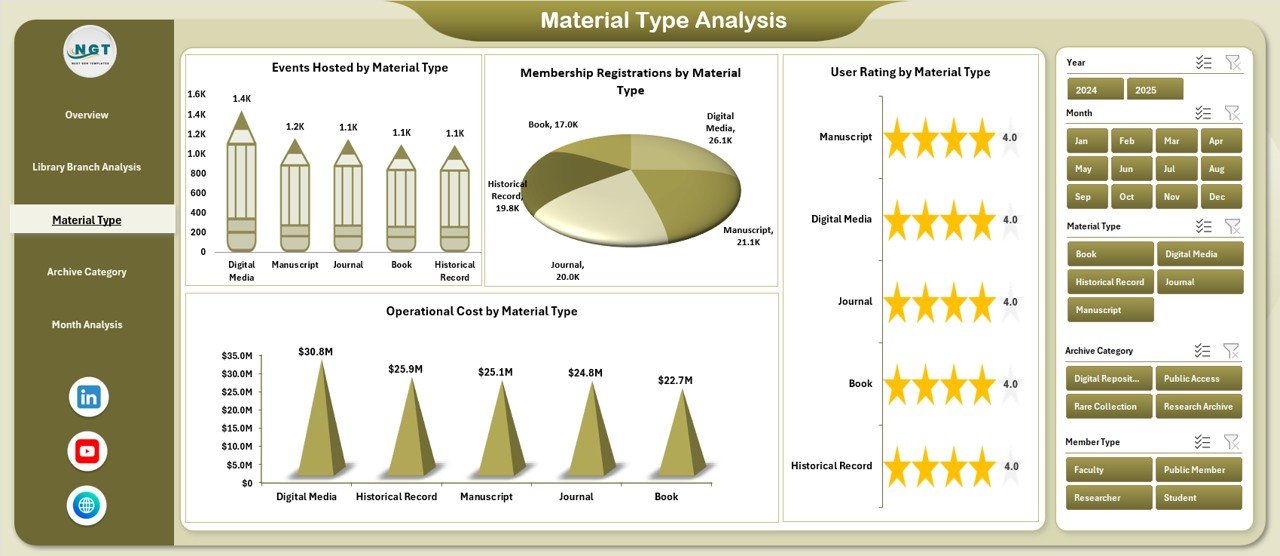
Libraries manage multiple material formats today.
Examples of Material Types
-
Books
-
Journals
-
Digital Media
-
Manuscripts
-
Audio-Visual Content
Charts Included
Click to Purchases Libraries and Archives Dashboard in Excel
-
User Rating by Material Type
-
Membership Registration by Material Type
-
Operating Cost by Material Type
-
Events Hosted by Material Type
Benefits of This Analysis
-
Understand user preferences
-
Improve collection development strategy
-
Reduce spending on low-demand materials
-
Expand popular resources
Therefore, libraries align investments with user demand.
4. Archive Category Analysis – How Well Are Archives Managed?
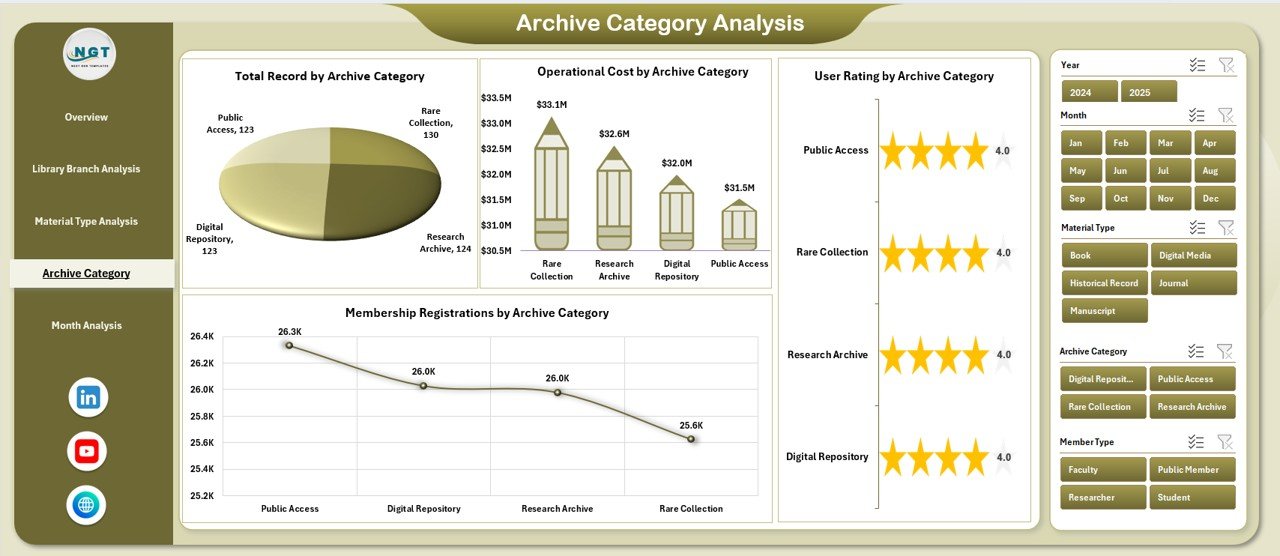
Archives require specialized monitoring because preservation and accessibility remain critical.
Charts Included
-
User Rating by Archive Category
-
Membership Registration by Archive Category
-
Operating Cost by Archive Category
-
Total Record by Archive Category
Key Insights
-
Popular archive collections
-
Preservation cost comparison
-
Research interest trends
-
Archive accessibility performance
Consequently, archivists can prioritize digitization and preservation initiatives.
5. Month Analysis – How Does Performance Change Over Time?
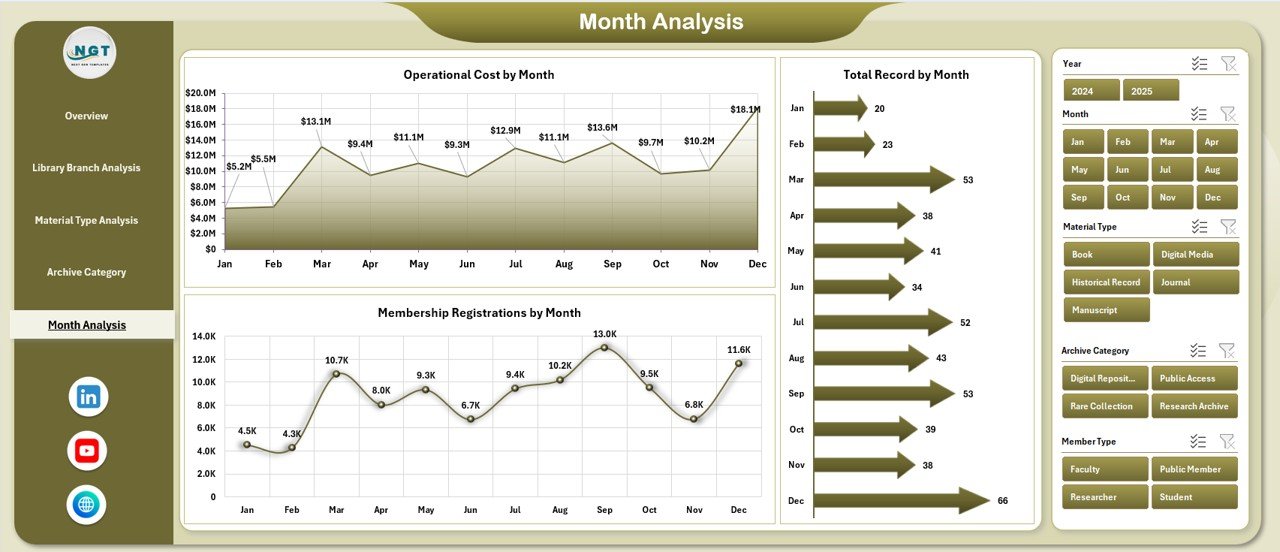
Trend analysis helps organizations plan future strategies.
Charts Included
-
Membership Registration by Month
-
Operating Cost by Month
-
Total Record by Month
Why Monthly Analysis Is Important
-
Identifies seasonal patterns
-
Tracks campaign effectiveness
-
Supports budgeting forecasts
-
Improves annual planning
Because trends become visible, decision-makers plan proactively.
Data Sheet and Support Sheet Explained
Data Sheet
This sheet stores raw operational data such as:
-
Visit details
-
Membership records
-
Costs
-
Ratings
-
Archive records
Users only update this sheet regularly.
Support Sheet
This sheet performs backend calculations using formulas and pivot tables. As a result, dashboard visuals update automatically.
Advantages of Libraries and Archives Dashboard in Excel
Implementing this dashboard provides several operational and strategic advantages.
📊 Improved Decision Making
Managers access real-time insights instead of static reports.
⏱ Time Savings
Automation eliminates repetitive manual reporting tasks.
📈 Better Resource Allocation
Organizations allocate budgets based on data instead of assumptions.
👥 Enhanced User Experience
Libraries improve services by analyzing satisfaction ratings.
💰 Cost Control
Operating cost tracking highlights inefficiencies.
📚 Collection Optimization
Libraries invest more in high-demand materials.
🔍 Increased Transparency
Performance becomes measurable and visible to stakeholders.
How Does This Dashboard Improve Library Management?
Click to Purchases Libraries and Archives Dashboard in Excel
The dashboard transforms traditional library operations into a data-driven system.
For example:
-
Administrators track membership growth trends.
-
Archivists monitor collection usage.
-
Finance teams evaluate operating expenses.
-
Event managers measure participation success.
Therefore, every department works using shared insights.
Best Practices for the Libraries and Archives Dashboard in Excel
To achieve maximum value, organizations should follow proven best practices.
1. Maintain Clean Data Entry
Always use standardized formats while entering data. Otherwise, reports may become inconsistent.
2. Update Data Regularly
Update the Data Sheet weekly or monthly to keep insights accurate.
3. Use Consistent Categories
Define clear material types, archive categories, and member groups.
4. Review KPIs Monthly
Analyze trends regularly instead of waiting for annual reviews.
5. Train Staff on Dashboard Usage
Ensure team members understand filters and slicers.
6. Backup the Dashboard
Maintain regular backups to prevent data loss.
7. Customize Charts When Needed
Libraries can adapt visuals according to institutional goals.
Who Can Benefit from This Dashboard?
This dashboard supports multiple stakeholders.
Library Administrators
Monitor operations and performance easily.
Archivists
Track archive utilization and preservation costs.
Educational Institutions
Manage academic library resources efficiently.
Government Libraries
Improve transparency and reporting.
Research Centers
Analyze resource usage trends effectively.
How to Implement the Libraries and Archives Dashboard in Excel?
Follow these simple steps:
-
Collect historical operational data.
-
Populate the Data Sheet.
-
Verify category structures.
-
Refresh pivot tables.
-
Apply slicer filters.
-
Review insights on each page.
Within minutes, organizations can start analyzing performance.
Common Use Cases of the Dashboard
Libraries use this dashboard for several practical purposes:
-
Annual reporting
-
Budget planning
-
Collection development decisions
-
Event performance tracking
-
Membership growth analysis
-
Archive digitization planning
Thus, the dashboard becomes a central management tool.
Future Scope of Library Analytics
As libraries evolve digitally, analytics will become even more important.
In the future, organizations may integrate:
-
Digital lending analytics
-
AI-driven recommendations
-
Predictive membership analysis
-
Automated reporting systems
However, Excel dashboards remain the ideal starting point because they combine simplicity with analytical power.
Conclusion
Libraries and archives continue to evolve from traditional repositories into modern knowledge centers. Therefore, institutions must adopt structured performance monitoring systems.
The Libraries and Archives Dashboard in Excel provides a practical and powerful solution for tracking memberships, operating costs, user satisfaction, archive collections, and trends within a single interactive environment.
Because the dashboard simplifies analysis, improves visibility, and supports data-driven decisions, libraries can enhance services while optimizing resources.
Ultimately, organizations that adopt analytical dashboards position themselves for sustainable growth and improved community impact.
Frequently Asked Questions (FAQs)
Click to Purchases Libraries and Archives Dashboard in Excel
1. What is a Libraries and Archives Dashboard in Excel used for?
It helps libraries monitor operational performance, memberships, costs, user ratings, and archive records using interactive analytics.
2. Do I need advanced Excel skills to use this dashboard?
No. Users only need basic Excel knowledge to update data and use slicers.
3. Can small libraries use this dashboard?
Yes. The dashboard works for both small and large institutions.
4. How often should data be updated?
Organizations should update data monthly or weekly for accurate insights.
5. Can the dashboard be customized?
Yes. Users can modify charts, KPIs, and categories according to requirements.
6. Does the dashboard support multiple branches?
Yes. The Library Branch Analysis page compares performance across locations.
7. Is Excel suitable for library analytics?
Yes. Excel provides powerful analytics, visualization, and automation capabilities without additional software costs.
Visit our YouTube channel to learn step-by-step video tutorials