Managing logistics operations has become more complex than ever. Companies handle multiple shipments, warehouses, carriers, and transportation costs every day. Therefore, businesses need a smart way to monitor logistics performance without spending hours analyzing raw data.A Logistics Dashboard in Excel solves this challenge by converting operational data into clear visuals and actionable insights. Instead of reviewing multiple spreadsheets, you can track logistics costs, delivery performance, shipment trends, and regional analysis from a single interactive dashboard.In this comprehensive guide, you will learn everything about the Logistics Dashboard in Excel, including features, benefits, dashboard structure, best practices, and frequently asked questions.
Click to buy Logistics Dashboard in Excel
What Is a Logistics Dashboard in Excel?
A Logistics Dashboard in Excel is a ready-to-use analytical tool designed to monitor logistics operations using key metrics, charts, and performance indicators. It helps logistics managers, supply chain teams, and business owners analyze transportation costs, shipment efficiency, and delivery performance.
Instead of manually calculating logistics KPIs, the dashboard automatically organizes data and presents insights through charts and summaries.
Because Excel supports formulas, pivot tables, slicers, and automation, users can easily update data and instantly view results.
Why Do Businesses Need a Logistics Dashboard?
Many organizations still track logistics data using disconnected sheets. As a result, they struggle to identify cost drivers and operational delays.
However, a centralized dashboard allows teams to:
- Monitor logistics expenses in real time
- Identify high-cost regions and carriers
- Improve delivery efficiency
- Analyze monthly logistics trends
- Make faster data-driven decisions
Therefore, companies gain better operational visibility and stronger cost control.
Why Use Excel for Logistics Analytics?
Although advanced software exists, Excel remains one of the most powerful logistics management tools.
Key Reasons Excel Works Perfectly
- Easy to use and widely available
- No expensive software investment
- Flexible customization options
- Supports automation using formulas
- Works well for small and large datasets
- Enables quick reporting and visualization
Moreover, Excel dashboards allow teams to start analyzing data immediately without technical complexity.
Key Features of the Logistics Dashboard in Excel
This ready-to-use dashboard includes multiple analytical sheets that provide deep logistics insights. Each sheet focuses on a specific operational area.
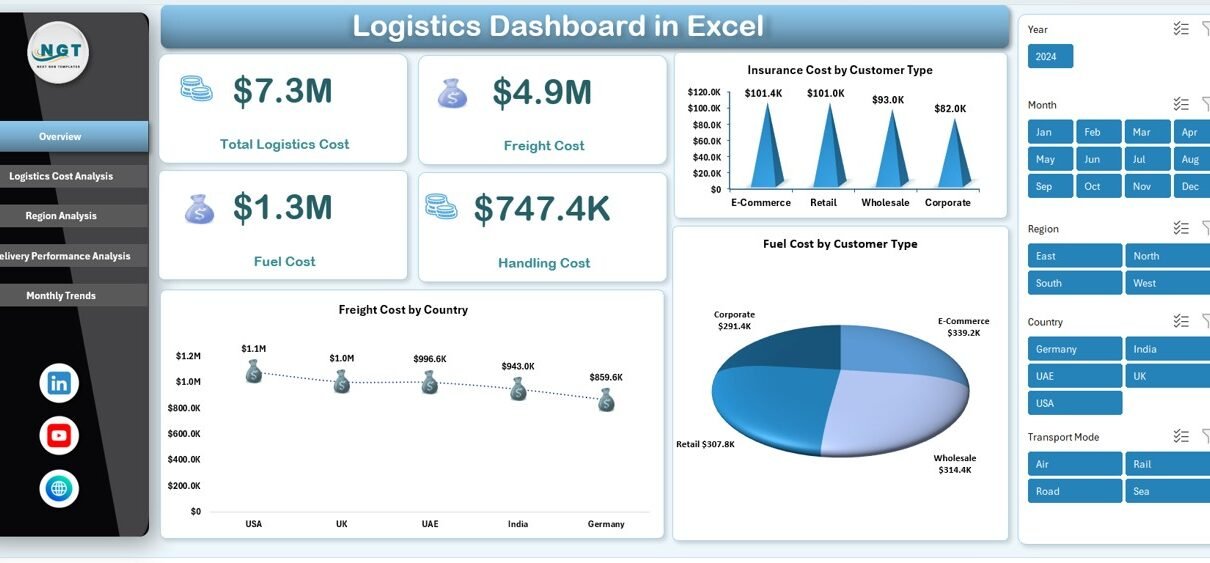
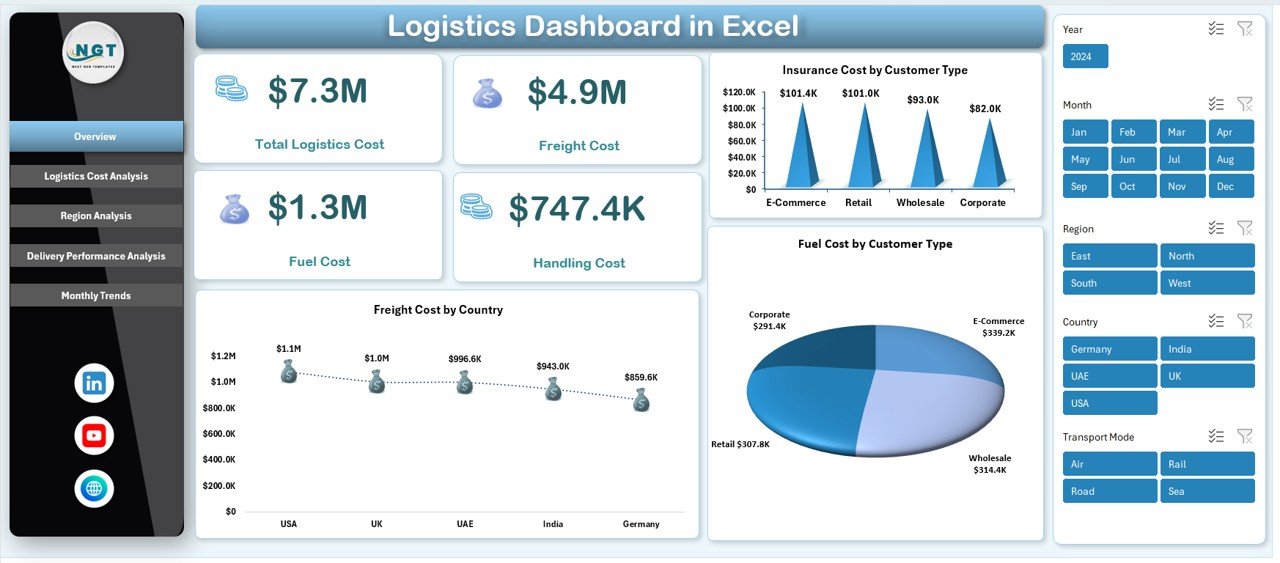
Overview Sheet – Central Logistics Performance Summary
The Overview Sheet acts as the main control panel of the dashboard. It provides a quick snapshot of logistics performance.
KPIs Displayed
- Total Logistics Cost
- Freight Cost
- Fuel Cost
- Handling Cost
- Insurance Cost
These KPIs help decision-makers instantly understand overall logistics spending.
Charts Included
- Insurance Cost by Customer Type
- Freight Cost by Country
- Fuel Cost by Customer Type
Because all key metrics appear on one screen, users quickly identify cost patterns.
Click to buy Logistics Dashboard in Excel
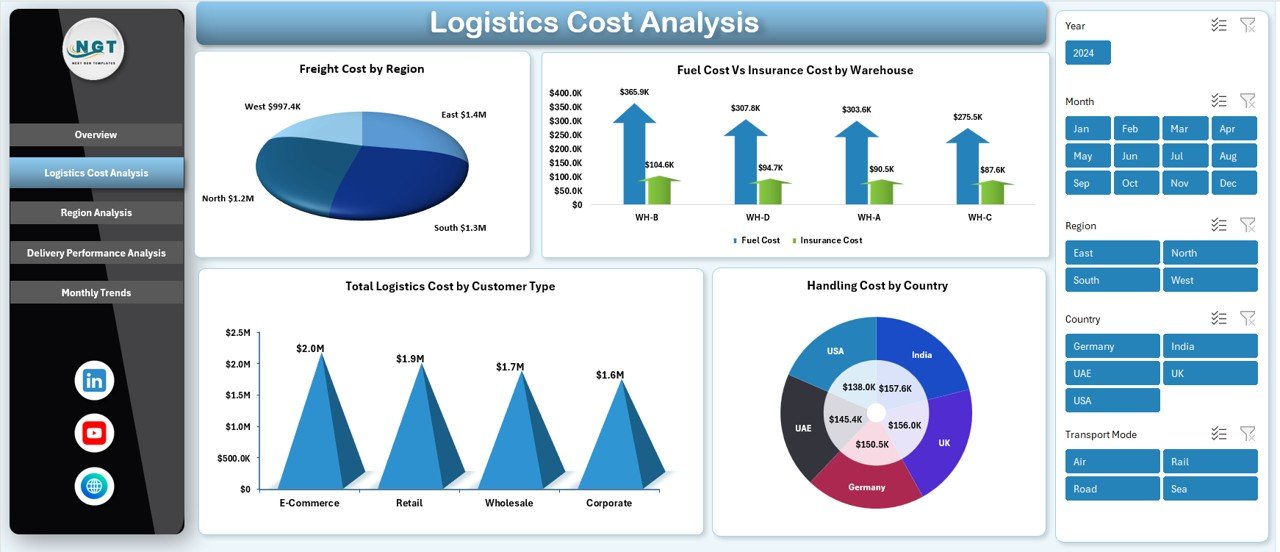
Logistics Cost Analysis Sheet – Where Does the Money Go?
Cost management plays a major role in logistics profitability. Therefore, this sheet focuses entirely on expense breakdowns.
Analysis Included
- Freight Cost by Region
- Fuel Cost vs Insurance Cost by Warehouse
- Total Logistics Cost by Customer Type
- Handling Cost by Country
This analysis helps businesses detect cost-heavy operations. For example, managers can immediately identify warehouses generating higher fuel or insurance expenses.
Click to buy Logistics Dashboard in Excel
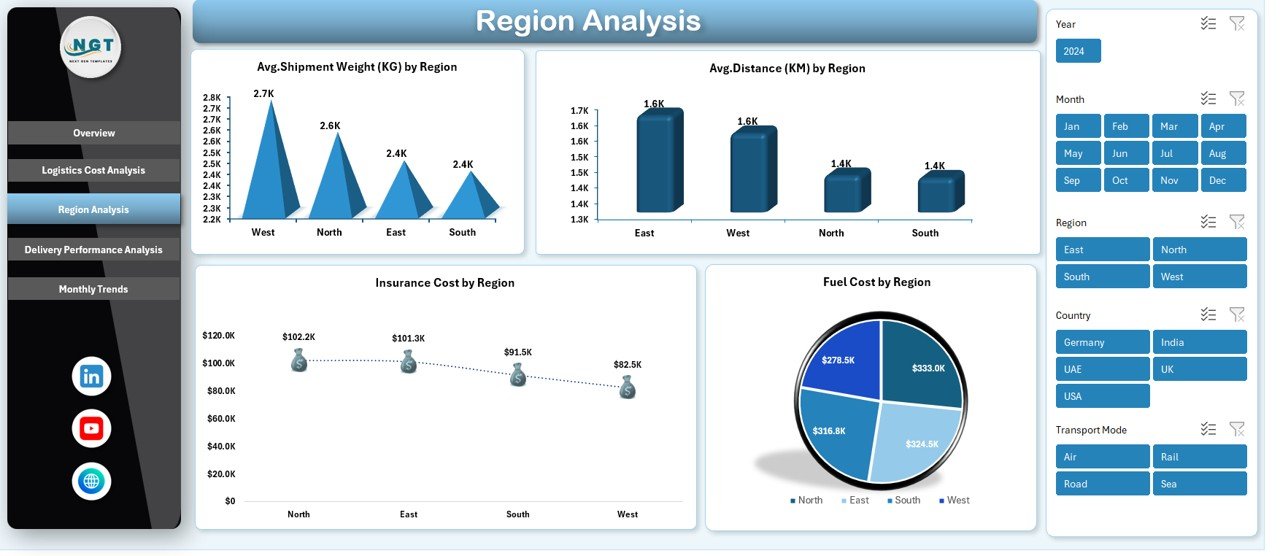
Region Analysis Sheet – Understanding Regional Logistics Performance
Logistics efficiency often varies by region. Hence, regional analysis becomes essential for operational improvement.
Metrics Covered
- Average Shipment Weight (KG) by Region
- Average Distance (KM) by Region
- Insurance Cost by Region
- Fuel Cost by Region
Using these visuals, companies can compare regions and adjust logistics strategies accordingly.
For instance, higher fuel costs in a specific region may indicate inefficient routing.
Click to buy Logistics Dashboard in Excel
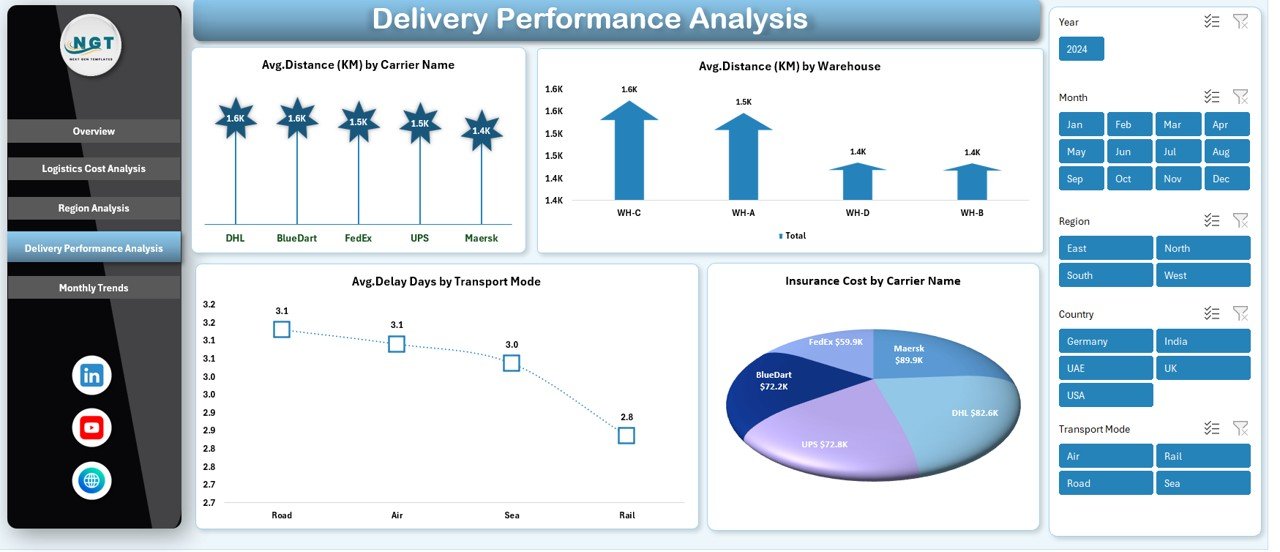
Delivery Performance Analysis – Measuring Operational Efficiency
Delivery performance directly affects customer satisfaction. Therefore, this sheet evaluates transportation effectiveness.
Key Performance Indicators
- Average Distance (KM) by Carrier Name
- Average Distance (KM) by Warehouse
- Average Delay Days by Transport Mode
- Insurance Cost by Carrier Name
Managers can quickly identify slow transport modes or underperforming carriers.
As a result, organizations improve delivery timelines and reduce delays.
Click to buy Logistics Dashboard in Excel
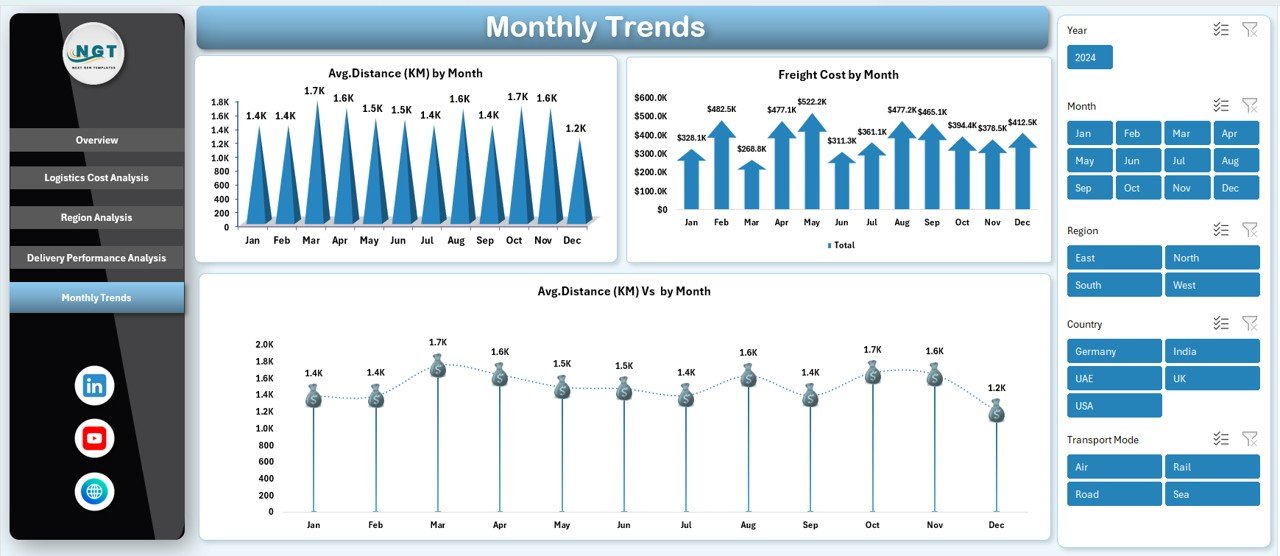
Monthly Trends Sheet – Tracking Logistics Performance Over Time
Trend analysis helps businesses understand seasonal patterns and operational changes.
Monthly Insights
- Average Distance (KM) by Month
- Freight Cost by Month
- Average Distance Comparison by Month
Because trends appear visually, users easily detect cost increases or efficiency improvements.
Moreover, trend analysis supports forecasting and budgeting decisions.
Click to buy Logistics Dashboard in Excel
What KPIs Should a Logistics Dashboard Track?
A strong logistics dashboard relies on meaningful KPIs.
Essential Logistics KPIs
- Total Logistics Cost
- Freight Expense
- Fuel Consumption Cost
- Handling Charges
- Insurance Cost
- Average Shipment Distance
- Delivery Delay Days
- Shipment Weight
- Cost per Region
- Carrier Performance Metrics
Tracking these KPIs ensures operational transparency.
How Does a Logistics Dashboard Improve Decision-Making?
A dashboard does more than display data—it drives action.
Key Decision Benefits
- Identify expensive logistics routes
- Compare carrier performance instantly
- Improve warehouse efficiency
- Optimize fuel usage
- Reduce operational delays
Because insights appear instantly, managers respond faster to problems.
Advantages of Logistics Dashboard in Excel
Implementing a logistics dashboard offers several operational benefits.
Better Cost Control
You can monitor every logistics expense in one place. Therefore, budget management becomes easier.
Faster Reporting
Instead of manual reports, the dashboard automatically generates insights.
Improved Operational Visibility
Teams clearly see logistics performance across regions and warehouses.
Data-Driven Decisions
Visual analytics help managers make confident decisions.
Increased Productivity
Automation reduces manual analysis time.
Performance Tracking
Businesses measure delivery efficiency consistently.
Who Can Benefit from a Logistics Dashboard?
Many industries rely on logistics analytics.
Ideal Users Include
- Logistics Managers
- Supply Chain Analysts
- Warehouse Managers
- Transportation Companies
- E-commerce Businesses
- Manufacturing Firms
- Distribution Companies
Therefore, any organization handling shipments can benefit from this dashboard.
How to Use the Logistics Dashboard in Excel?
Using the dashboard remains simple and user-friendly.
Step-by-Step Process
- Enter logistics data into the data sheet.
- Update shipment, cost, and delivery details.
- Refresh pivot tables or dashboard connections.
- Use slicers to filter results.
- Analyze charts and KPIs instantly.
Because Excel automates calculations, users save significant time.
Best Practices for the Logistics Dashboard in Excel
Following best practices ensures accurate insights and long-term usability.
- Maintain Clean Data
Always use consistent formats for dates, regions, and customer types.
- Update Data Regularly
Frequent updates keep insights relevant and actionable.
- Standardize Cost Categories
Define cost types clearly to avoid confusion.
- Use Filters and Slicers
Interactive filtering improves analysis speed.
- Monitor Trends Monthly
Trend analysis helps predict logistics costs.
- Review Carrier Performance Often
Regular reviews improve delivery reliability.
- Backup Dashboard Files
Protect business data with regular backups.
Common Logistics Challenges Solved by the Dashboard
Many logistics teams face operational difficulties. However, dashboards simplify problem-solving.
Problems Solved
- Lack of visibility into logistics costs
- Difficulty tracking delivery delays
- Manual reporting errors
- Complex regional comparisons
- Inefficient carrier selection
Therefore, organizations operate more efficiently.
How Logistics Dashboards Support Supply Chain Optimization
A logistics dashboard plays a vital role in supply chain success.
Optimization Benefits
- Improves route planning
- Reduces fuel consumption
- Enhances warehouse coordination
- Supports cost forecasting
- Improves delivery performance
As a result, businesses achieve better customer satisfaction and profitability.
Tips to Customize Your Logistics Dashboard
You can easily adapt the dashboard to business needs.
Customization Ideas
- Add new KPIs
- Include shipment volume charts
- Create automated alerts
- Add yearly comparison analysis
- Integrate Power Query for automation
Customization ensures scalability.
Future of Logistics Analytics Using Excel
Although technology evolves rapidly, Excel continues to remain relevant.
Because Excel integrates with Power BI and automation tools, businesses can gradually scale analytics capabilities.
In addition, AI-driven insights and automation will make logistics dashboards even more powerful.
Conclusion
A Logistics Dashboard in Excel provides a practical and powerful solution for managing logistics operations efficiently. Instead of working with scattered spreadsheets, businesses gain centralized visibility into logistics costs, delivery performance, and regional efficiency.
Moreover, the dashboard helps organizations reduce expenses, improve decision-making, and enhance operational control. Since Excel offers flexibility and ease of use, companies of all sizes can implement this solution without complex systems.
Therefore, investing in a logistics dashboard does not only improve reporting—it transforms logistics management into a strategic advantage.
Frequently Asked Questions (FAQs)
- What is a Logistics Dashboard in Excel used for?
It helps businesses track logistics costs, shipment performance, delivery efficiency, and operational trends using visual analytics.
- Can beginners use this dashboard?
Yes. The dashboard uses simple Excel features, so beginners can easily operate it after basic training.
- Does the dashboard update automatically?
Yes. Once you update the data and refresh the dashboard, charts and KPIs update automatically.
- Which industries benefit the most from logistics dashboards?
E-commerce, manufacturing, distribution, retail, and transportation companies benefit significantly.
- Can I customize the dashboard?
Yes. You can add KPIs, charts, filters, and automation features according to business needs.
- Why choose Excel instead of specialized logistics software?
Excel offers flexibility, affordability, and easy customization without requiring advanced technical skills.
- How often should logistics data be updated?
You should update data daily or weekly to maintain accurate performance insights.
Visit our YouTube channel to learn step-by-step video tutorials
Watch the step-by-step video tutorial:
Click to buy Logistics Dashboard in Excel

