Marketing teams invest heavily in campaigns, channels, and regions. However, without a clear measurement system, budgets often disappear without clear results. Because of this challenge, organizations now rely on analytics-driven tools to track performance accurately. One such powerful solution is the Marketing ROI Dashboard in Power BI.
In this detailed guide, you will learn what a Marketing ROI Dashboard in Power BI is, why it is important, how it works, its dashboard pages, key features, advantages, best practices, and frequently asked questions. By the end of this article, you will clearly understand how this dashboard helps marketing teams improve returns, control spending, and make data-driven decisions confidently.
Click to buy Marketing ROI Dashboard in Power BI
What Is a Marketing ROI Dashboard in Power BI?
A Marketing ROI Dashboard in Power BI is an interactive reporting and analytics solution designed to measure the return on investment (ROI) of marketing campaigns, channels, and regions.
Instead of reviewing multiple spreadsheets or static reports, marketing teams use one centralized Power BI dashboard to:
- Track campaign budgets, spends, and revenue
- Measure ROI, CTR, impressions, and conversions
- Analyze performance by channel, region, and campaign objective
- Monitor monthly marketing trends
- Optimize marketing strategies based on real data
Because Power BI supports interactive visuals, slicers, and real-time insights, teams move faster from data to decisions.
Why Do Businesses Need a Marketing ROI Dashboard?
Marketing decisions directly impact revenue growth. However, without proper tracking, teams struggle to answer critical questions. For example, which campaign delivers the highest ROI? Which channel wastes budget? Which region performs best?
A Marketing ROI Dashboard in Power BI solves these problems. It provides clear answers by connecting marketing data with performance metrics. As a result, organizations reduce guesswork and improve accountability.
Moreover, leadership teams gain visibility into marketing effectiveness. Therefore, marketing becomes a measurable investment rather than an expense.
How Does a Marketing ROI Dashboard in Power BI Work?
A Marketing ROI Dashboard works by combining marketing data into one structured model. Usually, teams capture data in Excel or other source systems. Then, Power BI imports and transforms the data into meaningful visuals.
The dashboard calculates KPIs such as budget utilization, ROI, CTR, impressions, clicks, and conversions. After that, interactive slicers allow users to filter data by channel, region, campaign, or time period.
Because of this approach, users explore performance from multiple angles without creating new reports every time.
Data Structure Behind the Marketing ROI Dashboard
Before exploring dashboard pages, it is important to understand the data foundation. A well-designed Marketing ROI Dashboard typically includes:
- Campaign master data (campaign name, objective, channel)
- Budget and spend data
- Revenue data
- Clicks, impressions, and conversion data
- Region and time-based data
Because clean data improves accuracy, organizations must maintain consistent formats and definitions.
Overview Page: The Central Performance Snapshot
What Is the Overview Page in a Marketing ROI Dashboard?
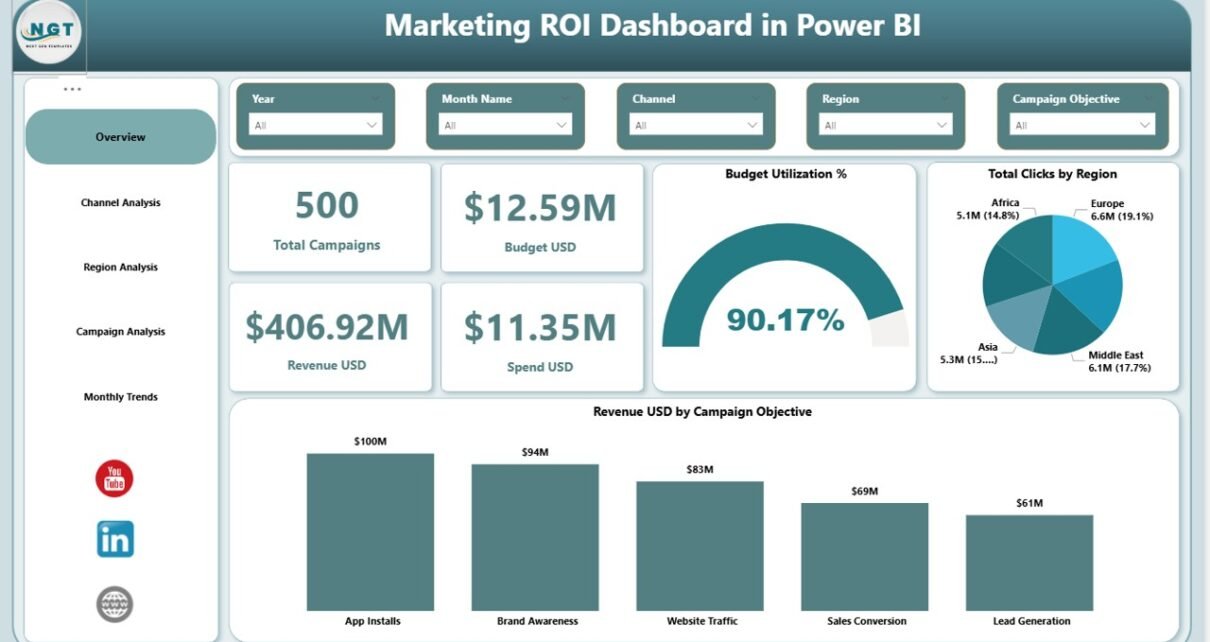
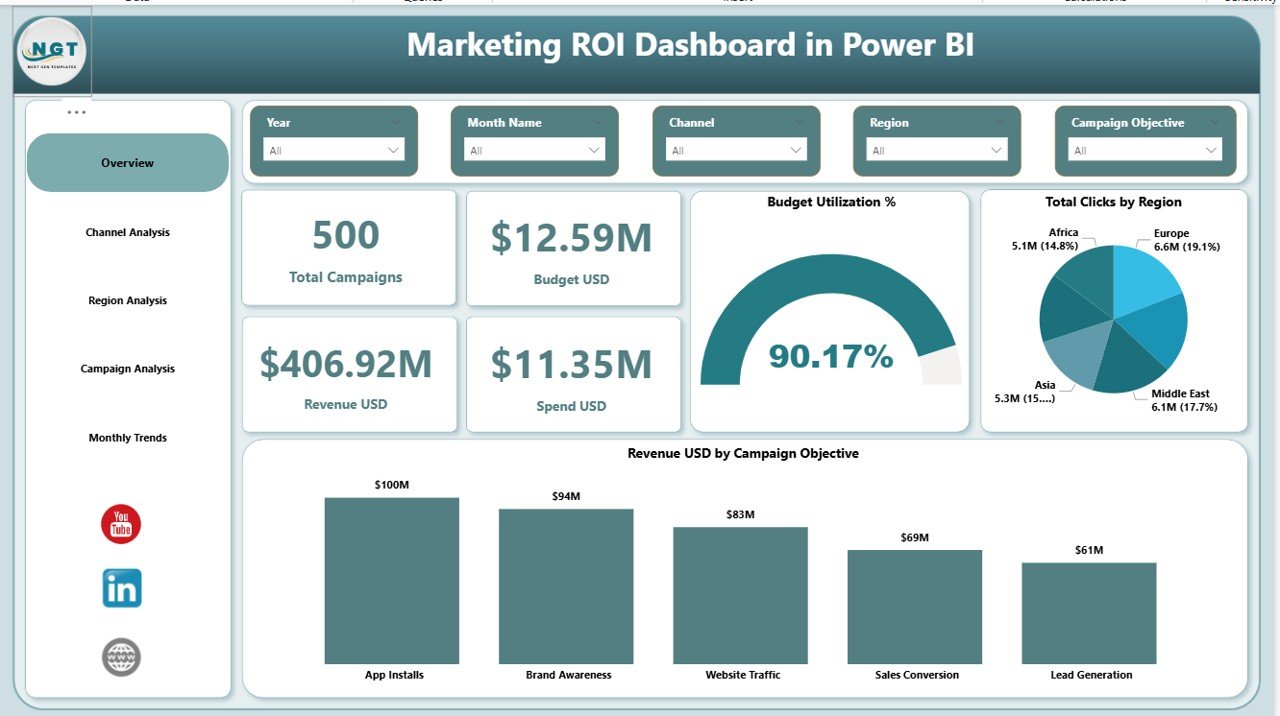
The Overview Page is the main landing page of the Marketing ROI Dashboard in Power BI. It provides a high-level summary of overall marketing performance.
Because decision-makers often need quick insights, this page highlights the most critical KPIs at a glance.
Key Elements of the Overview Page
The Overview Page includes interactive slicers at the top. These slicers allow users to filter data by campaign, channel, region, or time period.
Below the slicers, the dashboard displays four KPI cards, including:
- Total Campaigns – Number of active or completed campaigns
- Budget (USD) – Total allocated marketing budget
- Revenue (USD) – Total revenue generated from campaigns
- Spend (USD) – Actual marketing spend
In addition, the Overview Page shows:
- Budget Utilization % – Percentage of budget used
- Total Clicks by Region – Regional engagement distribution
- Revenue (USD) by Campaign Objective – Revenue contribution by campaign goals
Because all visuals update dynamically, users instantly see how performance changes based on selections.
Click to buy Marketing ROI Dashboard in Power BI
Channel Analysis Page: Which Channels Drive ROI?
Why Is Channel Analysis Important?
Marketing teams invest in multiple channels such as social media, search, email, and display advertising. However, not all channels deliver equal returns. Therefore, channel-level analysis becomes essential.
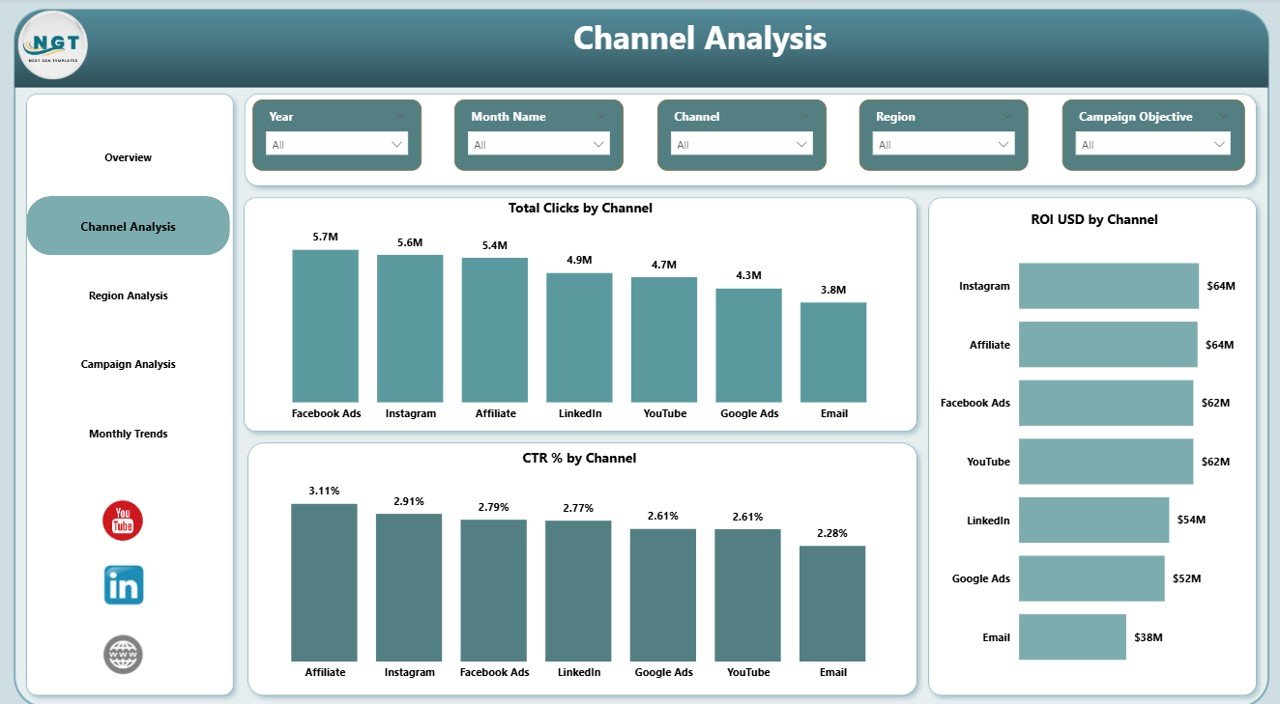
What Does the Channel Analysis Page Show?
The Channel Analysis Page focuses on performance by marketing channel. Like other pages, it includes slicers for quick filtering.
This page displays three key charts:
- Total Clicks by Channel – Engagement comparison across channels
- ROI (USD) by Channel – Profitability of each channel
- CTR % by Channel – Click-through rate efficiency
Because these visuals appear together, teams quickly identify high-performing and underperforming channels.
As a result, marketers shift budgets toward channels that deliver better ROI.
Click to buy Marketing ROI Dashboard in Power BI
Region Analysis Page: How Do Regions Perform?
Why Should Marketing Performance Be Analyzed by Region?
Regional performance varies due to audience behavior, market maturity, and competition. Therefore, region-level insights help organizations localize strategies effectively.
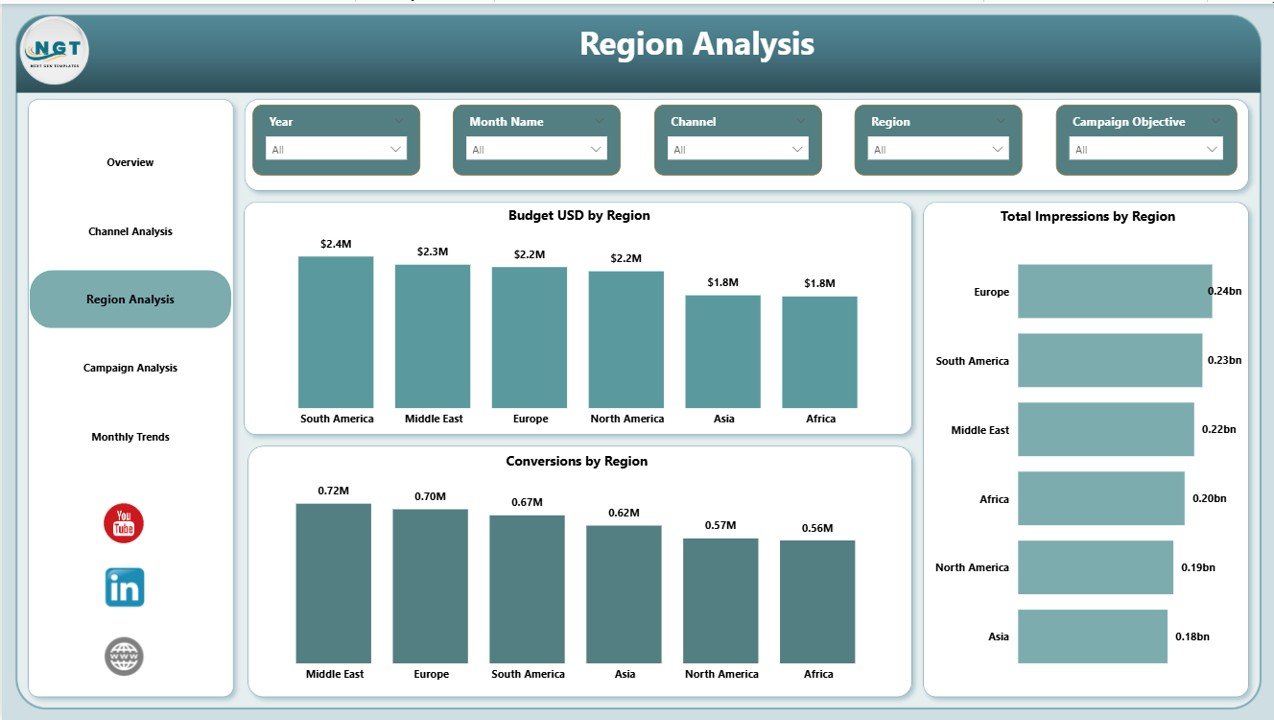
Key Visuals in the Region Analysis Page
The Region Analysis Page includes slicers for flexible filtering. It highlights three important charts:
- Budget (USD) by Region – Allocation of marketing budgets
- Total Impressions by Region – Brand visibility across regions
- Conversions by Region – Actual business outcomes
Because these metrics appear side by side, teams compare visibility, investment, and results easily.
Consequently, marketing leaders identify regions that require optimization or additional investment.
Click to buy Marketing ROI Dashboard in Power BI
Campaign Analysis Page: Which Campaign Objectives Succeed?
What Is the Purpose of Campaign Analysis?
Campaigns often target different objectives such as brand awareness, lead generation, or sales conversion. However, performance varies across objectives. Therefore, campaign analysis helps teams understand what works best.
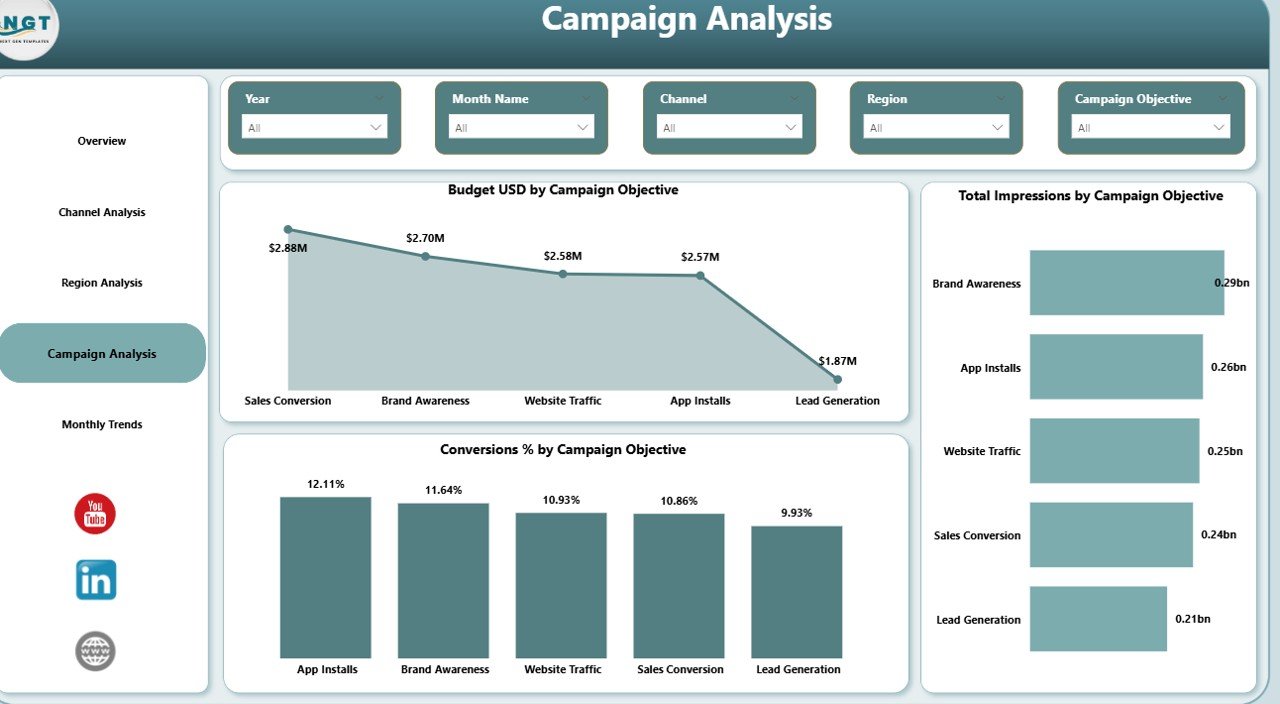
Key Metrics in the Campaign Analysis Page
The Campaign Analysis Page includes interactive slicers and displays visuals such as:
- Budget (USD) by Campaign Objective
- Total Impressions by Campaign Objective
Because this page focuses on objectives, marketers evaluate whether budget allocation aligns with actual results.
As a result, future campaigns become more strategic and goal-driven.
Click to buy Marketing ROI Dashboard in Power BI
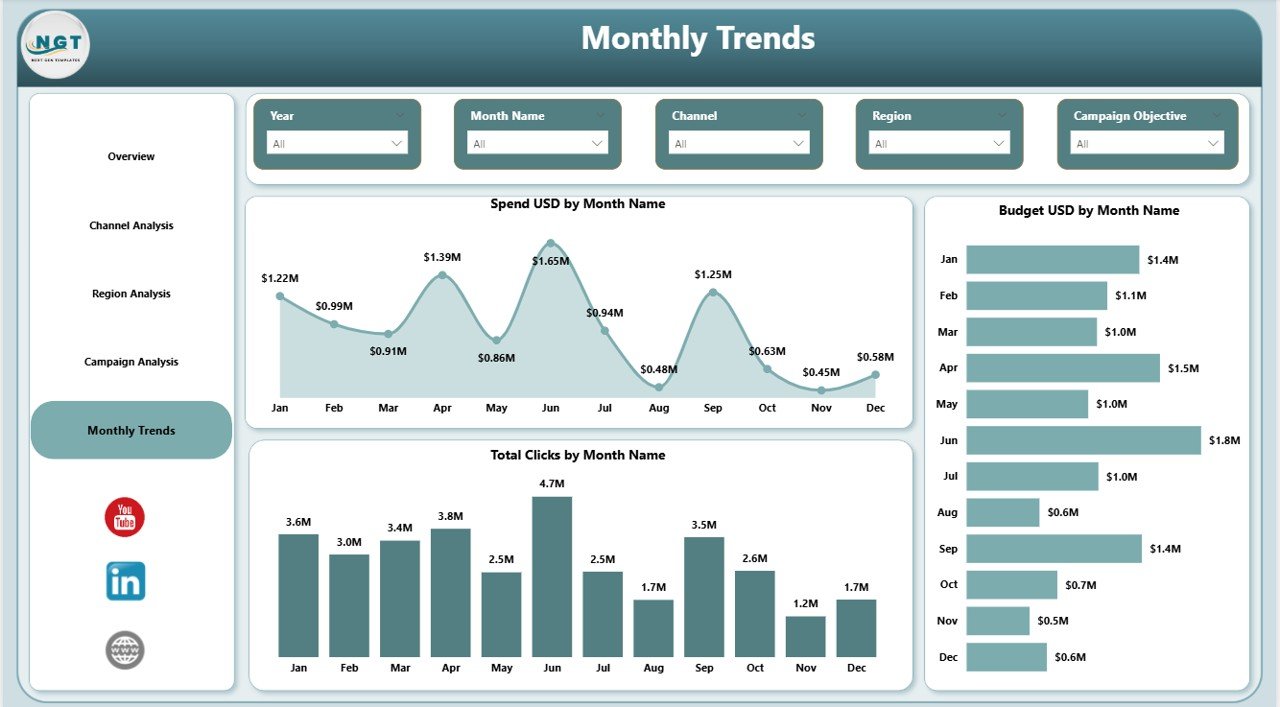
Monthly Trends Page: How Does Performance Change Over Time?
Why Are Monthly Trends Important?
Marketing performance changes over time due to seasonality, promotions, and market conditions. Therefore, trend analysis plays a crucial role in planning.
Key Charts in the Monthly Trends Page
The Monthly Trends Page shows time-based performance using:
- Spend (USD) by Month
- Budget (USD) by Month
- Total Clicks by Month
Because these trends appear visually, teams quickly spot spikes, drops, and patterns.
As a result, organizations improve forecasting and budget planning.
Key Features of the Marketing ROI Dashboard in Power BI
The Marketing ROI Dashboard in Power BI offers several powerful features, including:
- Interactive slicers for flexible analysis
- KPI cards for instant performance visibility
- Dynamic charts and visuals
- Multi-dimensional analysis by channel, region, campaign, and time
- Easy integration with Excel and other data sources
- User-friendly design for non-technical users
Because of these features, teams gain control over marketing performance.
Click to buy Marketing ROI Dashboard in Power BI
Advantages of Marketing ROI Dashboard in Power BI
Why Should Organizations Use a Marketing ROI Dashboard?
The Marketing ROI Dashboard in Power BI delivers multiple advantages, such as:
- Clear ROI Measurement: Teams measure returns accurately for every campaign
- Better Budget Control: Organizations track spending and utilization easily
- Data-Driven Decisions: Leaders rely on facts instead of assumptions
- Improved Accountability: Marketing outcomes become transparent
- Time Savings: Automated dashboards replace manual reporting
- Scalable Analysis: The dashboard grows with business needs
Because of these benefits, marketing teams achieve higher efficiency and profitability.
Best Practices for the Marketing ROI Dashboard in Power BI
How Can You Get the Best Results from This Dashboard?
To maximize the value of a Marketing ROI Dashboard in Power BI, follow these best practices:
- Define clear KPI definitions before building the dashboard
- Maintain clean and consistent data sources
- Use meaningful slicers without overloading users
- Focus on actionable metrics instead of vanity metrics
- Review dashboard insights regularly with stakeholders
- Align dashboard metrics with business goals
- Update data frequently for accurate insights
By following these practices, organizations ensure long-term success.
Common Use Cases of Marketing ROI Dashboard in Power BI
Marketing teams across industries use this dashboard for:
- Campaign performance reviews
- Budget planning and forecasting
- Channel optimization
- Regional strategy analysis
- Executive reporting
- Monthly and quarterly performance tracking
Because of its flexibility, the dashboard supports both operational and strategic needs.
How Does This Dashboard Support Decision-Making?
The Marketing ROI Dashboard in Power BI transforms raw data into insights. Instead of asking “What happened?”, teams ask “What should we do next?”.
Because the dashboard highlights trends, gaps, and opportunities, leaders take timely actions. Therefore, marketing strategies become proactive rather than reactive.
Conclusion: Why Marketing ROI Dashboard in Power BI Is a Must-Have Tool
Marketing success depends on visibility, measurement, and action. A Marketing ROI Dashboard in Power BI delivers all three in one place.
It helps organizations track campaigns, optimize channels, analyze regions, and understand trends clearly. Moreover, it supports faster decisions and better use of marketing budgets.
In today’s competitive environment, teams that rely on data outperform those that rely on intuition. Therefore, a Marketing ROI Dashboard in Power BI is no longer optional. It is essential.
Frequently Asked Questions About Marketing ROI Dashboard in Power BI
What is the main purpose of a Marketing ROI Dashboard in Power BI?
The main purpose is to measure marketing performance and ROI accurately using interactive analytics.
Who can use a Marketing ROI Dashboard?
Marketing managers, analysts, executives, and finance teams can use this dashboard for performance tracking.
Can this dashboard work with Excel data?
Yes, the dashboard commonly uses Excel as a data source for campaign, budget, and performance data.
Does the dashboard support real-time analysis?
Yes, when connected to live data sources, the dashboard supports near real-time insights.
Is Power BI suitable for non-technical users?
Yes, Power BI dashboards are user-friendly and require no coding knowledge for analysis.
How often should marketing data be updated?
Teams should update data weekly or monthly to ensure accurate performance tracking.
Can this dashboard handle multiple campaigns and regions?
Yes, the dashboard supports multi-campaign, multi-channel, and multi-region analysis easily.
Visit our YouTube channel to learn step-by-step video tutorials
Watch the step-by-step video tutorial:
Click to buy Marketing ROI Dashboard in Power BI