Microfinance institutions play a crucial role in financial inclusion. They support small businesses, self-help groups, and low-income individuals by providing access to credit and financial services. However, managing performance without clear metrics often leads to inefficiencies, delayed decisions, and hidden risks.
That is exactly why a Microfinance KPI Scorecard in Excel becomes an essential management tool.
In this detailed guide, you will learn what a Microfinance KPI Scorecard in Excel is, why it matters, how it works, its structure, key features, advantages, best practices, and frequently asked questions. By the end of this article, you will clearly understand how to use this ready-to-use Excel scorecard to monitor microfinance performance accurately and confidently.
Click to Purchases Microfinance KPI Scorecard in Excel
What Is a Microfinance KPI Scorecard in Excel?
A Microfinance KPI Scorecard in Excel is a structured and interactive performance management tool designed to track, measure, and analyze key performance indicators (KPIs) relevant to microfinance operations.
Instead of reviewing multiple spreadsheets or static reports, microfinance teams use one centralized Excel scorecard to monitor:
-
Portfolio quality
-
Loan performance
-
Collection efficiency
-
Operational productivity
-
Financial sustainability
Because Excel supports formulas, dropdowns, charts, and conditional formatting, this scorecard provides a clear and visual view of performance at both MTD (Month-to-Date) and YTD (Year-to-Date) levels.
As a result, decision-makers move from guesswork to data-driven management.
Why Do Microfinance Institutions Need a KPI Scorecard?
Microfinance institutions manage large volumes of loans, borrowers, and field operations. Therefore, even small inefficiencies can quickly impact portfolio health and profitability.
A Microfinance KPI Scorecard in Excel helps because:
-
It centralizes all KPI data in one place
-
It compares actual results against targets
-
It highlights risks using visual indicators
-
It supports faster and better decisions
Moreover, Excel remains familiar and flexible, which means teams can adopt the scorecard without complex training or expensive software.
How Does a Microfinance KPI Scorecard in Excel Work?
The scorecard works by capturing KPI data in a structured input sheet and transforming it into visual performance insights using formulas and formatting.
Here is how the process flows:
-
Enter KPI definitions and targets
-
Record actual KPI data regularly
-
Select the month, MTD, or YTD view
-
Review performance against targets
-
Analyze trends and identify gaps
Because everything updates automatically, users always see the latest performance without manual recalculation.
Click to Purchases Microfinance KPI Scorecard in Excel
What Are the Key Features of a Microfinance KPI Scorecard in Excel?
This ready-to-use Microfinance KPI Scorecard template includes multiple powerful features that support performance tracking and analysis.
Key Highlights at a Glance
-
Dynamic dropdown selections
-
Actual vs Target comparisons
-
MTD and YTD performance views
-
Visual indicators using conditional formatting
-
Dedicated KPI trend analysis
-
Structured KPI definition management
Each feature works together to deliver clarity, control, and confidence.
What Worksheets Are Included in the Microfinance KPI Scorecard?
This Excel template includes four well-structured worksheets, each serving a specific purpose.
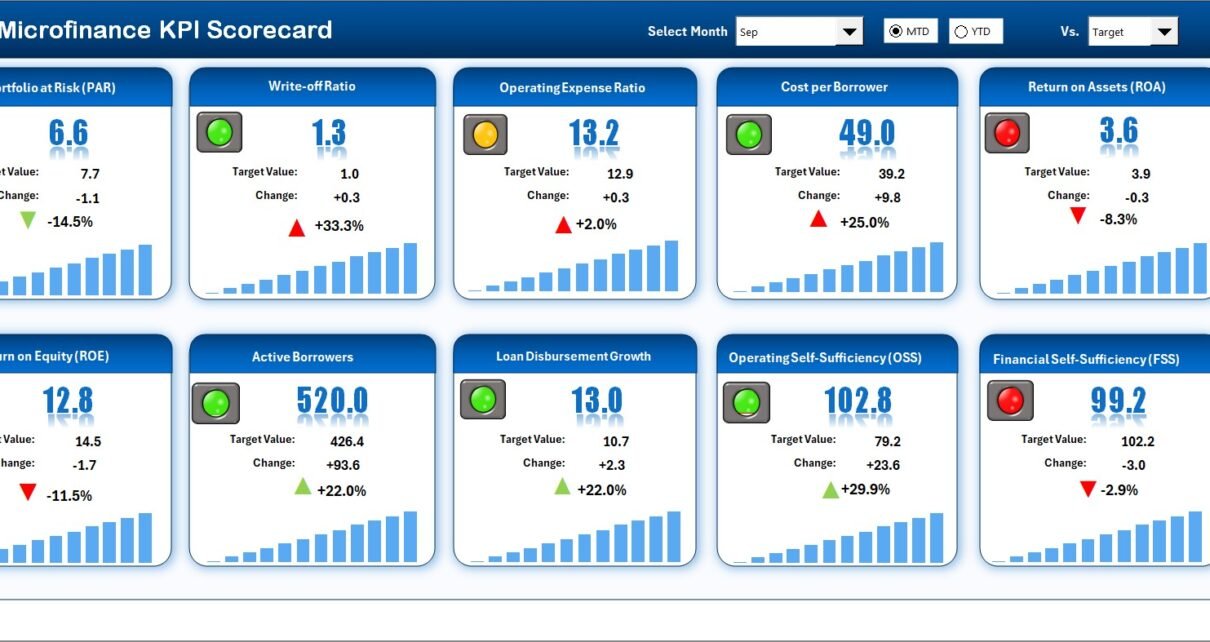
1. What Is the Scorecard Sheet and How Does It Help?
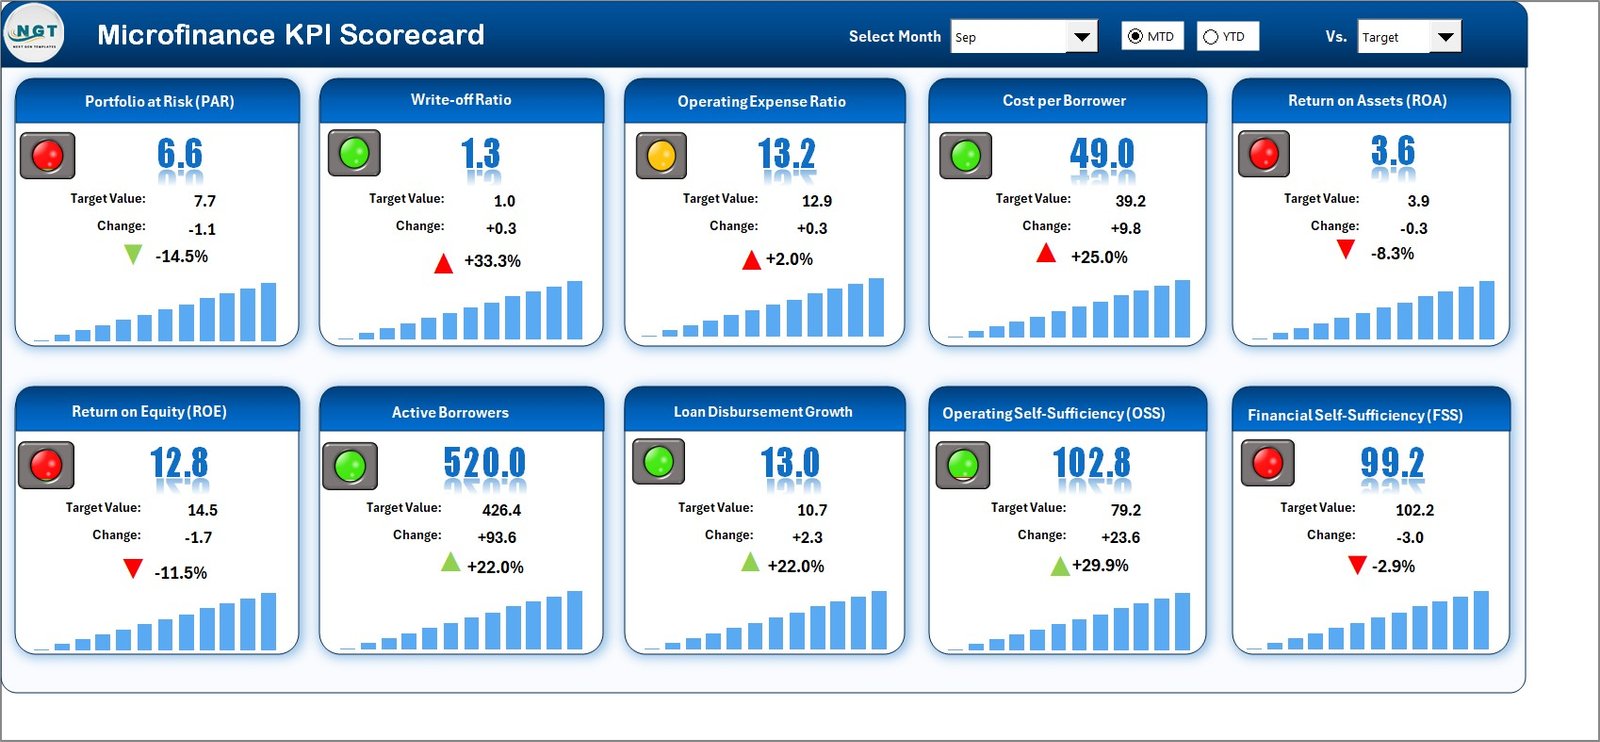
The Scorecard Sheet acts as the main interface of the Microfinance KPI Scorecard in Excel.
Key Features of the Scorecard Sheet
🔹 Dropdown Menus for Time Selection
Users can easily select:
-
Month
-
MTD (Month-to-Date)
-
YTD (Year-to-Date)
As soon as users change the selection, the entire scorecard updates automatically.
🔹 Actual vs Target Comparison
For each KPI, the scorecard displays:
-
Actual value
-
Target value
This comparison allows teams to immediately understand whether performance meets expectations.
🔹 Visual Indicators Using Conditional Formatting
Color-coded visuals clearly show:
-
Good performance
-
Warning areas
-
Underperformance
Because visuals speak faster than numbers, managers can quickly identify problem areas.
🔹 Comprehensive KPI Overview
The scorecard displays:
-
KPI Name
-
KPI Group
-
Unit of Measurement
-
KPI Type (Upper the Better or Lower the Better)
-
MTD and YTD results
As a result, stakeholders get a complete performance snapshot on one screen.
Click to Purchases Microfinance KPI Scorecard in Excel
2. What Is the KPI Trend Sheet and Why Is It Important?
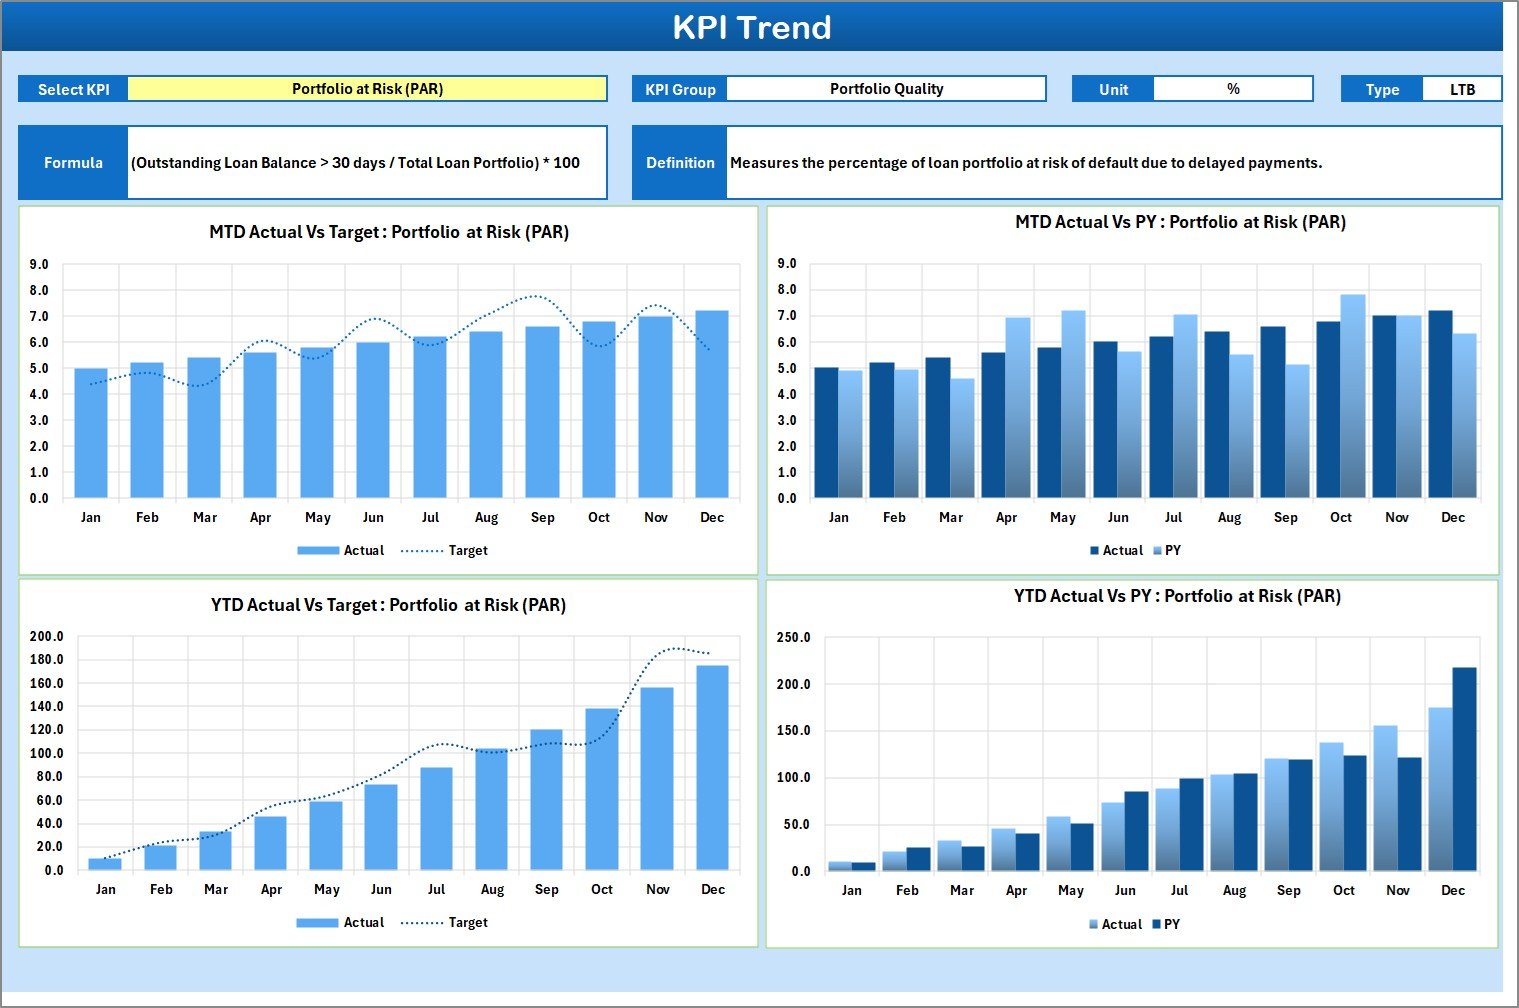
The KPI Trend Sheet focuses on performance trends over time.
How the KPI Trend Sheet Works
-
Users select the KPI Name from a dropdown (Range C3)
-
The sheet automatically displays related KPI details
Information Displayed in the KPI Trend Sheet
-
KPI Group
-
Unit of KPI
-
KPI Type (UTB or LTB)
-
KPI Formula
-
KPI Definition
MTD and YTD Trend Charts
The sheet also shows trend charts for:
-
Actual values
-
Target values
-
Previous Year (PY) values
These charts help users:
-
Identify improving or declining trends
-
Compare performance across periods
-
Detect early warning signals
Because trends reveal more than single values, this sheet plays a critical role in strategic analysis.
Click to Purchases Microfinance KPI Scorecard in Excel
3. What Is the Input Data Sheet Used For?
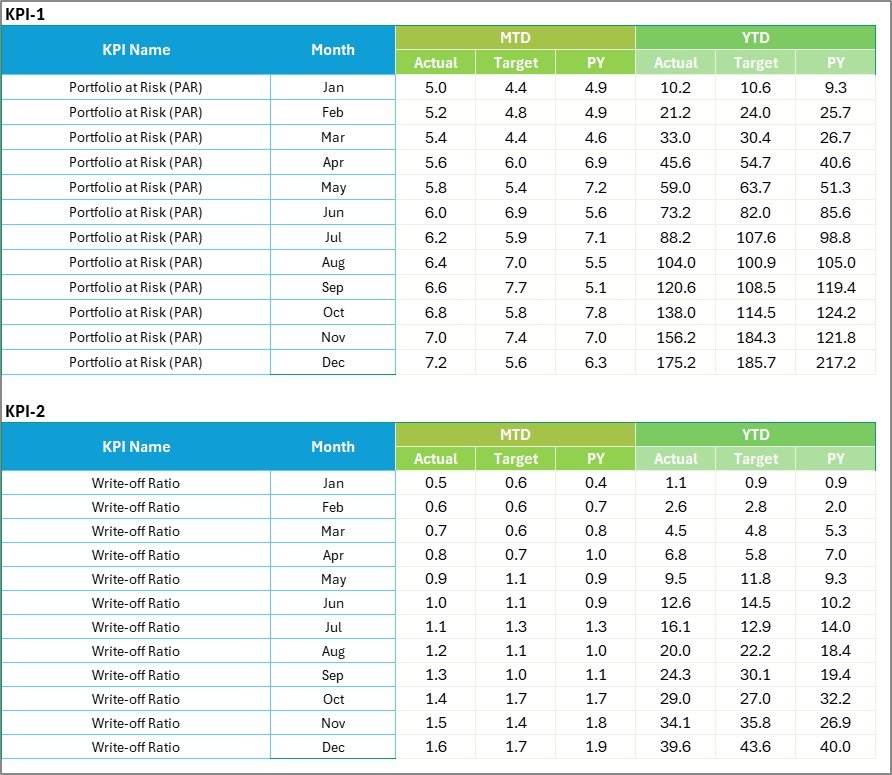
The Input Data Sheet serves as the backbone of the Microfinance KPI Scorecard in Excel.
Key Functions of the Input Data Sheet
🔹 Centralized Data Entry
Users enter:
-
Actual KPI values
-
Target values
-
Period-wise data
🔹 Easy Updates
Teams can quickly update data as new results become available. Therefore, the scorecard always reflects the latest performance.
🔹 Structured Format
Because the data follows a clean and consistent structure, formulas work smoothly across all scorecard sheets.
As a result, users reduce errors and save time.
Click to Purchases Microfinance KPI Scorecard in Excel
4. What Is the KPI Definition Sheet and Why Is It Required?
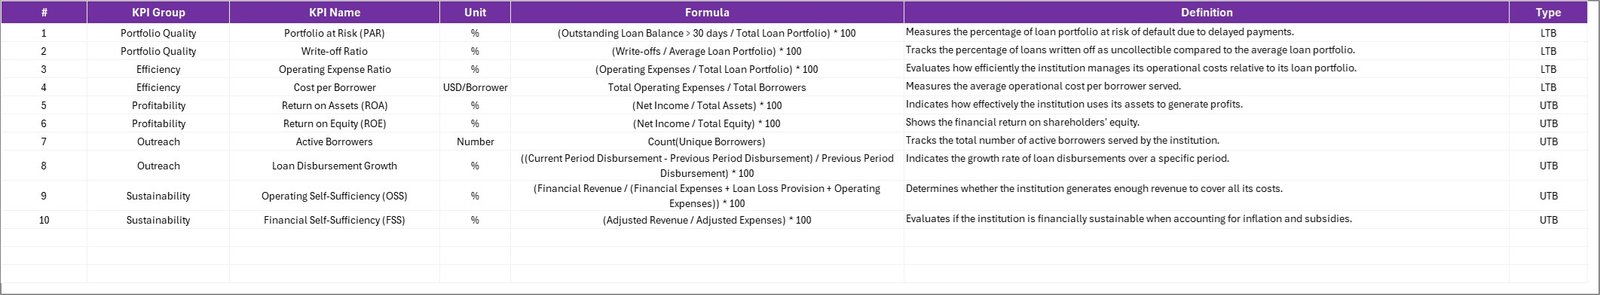
The KPI Definition Sheet ensures clarity and consistency across the organization.
Information Captured in the KPI Definition Sheet
-
KPI Name
-
KPI Group
-
Unit of Measurement
-
KPI Formula
-
KPI Definition
Why This Sheet Matters
-
It creates a single source of truth
-
It avoids KPI interpretation confusion
-
It helps new team members understand metrics quickly
Because everyone refers to the same definitions, reporting stays accurate and aligned.
What Types of KPIs Can You Track Using This Scorecard?
A Microfinance KPI Scorecard in Excel supports multiple KPI categories, such as:
-
Portfolio Quality KPIs
-
Financial Performance KPIs
-
Operational Efficiency KPIs
-
Client Outreach KPIs
-
Risk Management KPIs
Therefore, institutions can customize the scorecard to match their operational priorities.
How Does This Scorecard Improve Decision-Making?
This scorecard improves decisions because it:
-
Highlights performance gaps clearly
-
Shows trends instead of isolated numbers
-
Enables timely corrective actions
-
Supports data-backed discussions
Moreover, managers no longer rely on intuition alone.
Click to Purchases Microfinance KPI Scorecard in Excel
Advantages of Microfinance KPI Scorecard in Excel
Using a Microfinance KPI Scorecard in Excel delivers multiple practical benefits.
✔ Centralized Performance Tracking
All KPIs appear in one structured file, which improves visibility and control.
✔ Easy to Use and Understand
Excel familiarity reduces training time and improves adoption.
✔ Real-Time Insights
Automatic updates ensure users always see the latest performance.
✔ Cost-Effective Solution
Excel eliminates the need for expensive BI tools or software licenses.
✔ Customizable and Scalable
Organizations can easily add or modify KPIs as they grow.
✔ Better Accountability
Clear targets and visuals encourage ownership and responsibility.
Best Practices for the Microfinance KPI Scorecard in Excel
To get the maximum value from this scorecard, follow these best practices.
📌 Define KPIs Clearly
Always maintain clear KPI definitions in the KPI Definition sheet.
📌 Set Realistic Targets
Targets should align with business goals and historical trends.
📌 Update Data Regularly
Consistent updates keep insights accurate and reliable.
📌 Review Trends, Not Just Numbers
Focus on trend charts to identify long-term patterns.
📌 Use Visuals Effectively
Rely on conditional formatting to spot issues quickly.
📌 Conduct Monthly Reviews
Use the scorecard during regular performance review meetings.
📌 Maintain Data Accuracy
Validate input data before analysis to avoid misleading conclusions.
Click to Purchases Microfinance KPI Scorecard in Excel
Who Should Use a Microfinance KPI Scorecard in Excel?
This scorecard suits:
-
Microfinance Institutions (MFIs)
-
Non-Banking Financial Companies (NBFCs)
-
Credit Cooperatives
-
Rural Finance Organizations
-
Financial Inclusion Programs
Because of its flexibility, teams across different sizes and regions can use it effectively.
How Is This Scorecard Better Than Manual Reports?
Manual reports often create delays, errors, and inconsistencies. In contrast, a Microfinance KPI Scorecard in Excel:
-
Automates calculations
-
Reduces manual effort
-
Improves data accuracy
-
Enhances visual clarity
As a result, teams focus more on analysis and action instead of data preparation.
Click to Purchases Microfinance KPI Scorecard in Excel
Conclusion: Why Should You Use a Microfinance KPI Scorecard in Excel?
A Microfinance KPI Scorecard in Excel provides a structured, visual, and reliable way to monitor performance across all critical areas of microfinance operations.
Because it combines scorecards, trend analysis, KPI definitions, and data input in one Excel file, it simplifies reporting and strengthens decision-making. Moreover, its ready-to-use design allows organizations to implement it quickly without complex setup.
If your goal involves improving transparency, accountability, and operational efficiency, this KPI scorecard becomes a powerful and practical solution.
Frequently Asked Questions (FAQs)
1. What is the purpose of a Microfinance KPI Scorecard in Excel?
The scorecard helps track, analyze, and improve microfinance performance using structured KPIs and visuals.
2. Can beginners use this Excel KPI Scorecard?
Yes, the template uses simple Excel features and remains easy to understand.
3. Does the scorecard support MTD and YTD analysis?
Yes, users can switch between Month-to-Date and Year-to-Date views using dropdowns.
4. Can I customize KPIs in the scorecard?
Yes, you can add, remove, or modify KPIs based on your business needs.
5. Does the scorecard include trend analysis?
Yes, the KPI Trend Sheet displays MTD and YTD trends for Actual, Target, and PY values.
6. Is this scorecard suitable for small MFIs?
Absolutely. Small and large microfinance institutions can both benefit from it.
7. How often should data be updated?
You should update data monthly or as frequently as performance data becomes available.
8. Does this scorecard replace BI tools?
While BI tools offer advanced analytics, this Excel scorecard provides a cost-effective and practical alternative for many institutions.
Click to Purchases Microfinance KPI Scorecard in Excel
Visit our YouTube channel to learn step-by-step video tutorials