Mortgage lending is a data-intensive business. Every day, lenders track applications, approvals, disbursements, turnaround times, delinquency rates, compliance metrics, and revenue figures. However, when this data stays scattered across multiple spreadsheets, understanding performance becomes difficult. As a result, leaders face delays, unclear KPIs, and missed opportunities.
A Mortgage Lenders KPI Dashboard in Excel solves this issue effectively. It brings all key mortgage metrics into one structured, interactive, and easy-to-use dashboard. Because most lending teams already work in Excel, this dashboard fits naturally into daily operations.
In this detailed guide, you will learn what a Mortgage Lenders KPI Dashboard in Excel is, how it works, what sheets it includes, how data flows through the file, and why it plays a critical role in performance-driven mortgage operations.
Click to Purchases Mortgage Lenders KPI Dashboard in Excel
What Is a Mortgage Lenders KPI Dashboard in Excel?
A Mortgage Lenders KPI Dashboard in Excel is a ready-to-use performance tracking tool designed specifically for mortgage lending operations. It converts raw lending data into clear KPIs, trend charts, comparisons, and performance indicators.
Instead of reviewing multiple reports, users view all lending KPIs in one dashboard. Moreover, Excel formulas, conditional formatting, and charts update automatically when users change monthly inputs.
Because of this structure, decision-makers monitor productivity, efficiency, and risk quickly and accurately.
Why Do Mortgage Lenders Need a KPI Dashboard?
Mortgage lending operates under tight margins and strict regulations. Even small inefficiencies impact profitability and compliance. However, without clear KPIs, identifying issues becomes challenging.
A KPI dashboard helps mortgage lenders:
-
Track lending performance monthly
-
Compare actuals with targets
-
Monitor year-over-year progress
-
Detect risks early
-
Improve operational efficiency
As a result, lenders move from reactive reporting to proactive decision-making.
Click to Purchases Mortgage Lenders KPI Dashboard in Excel
What Are the Key Features of the Mortgage Lenders KPI Dashboard in Excel?
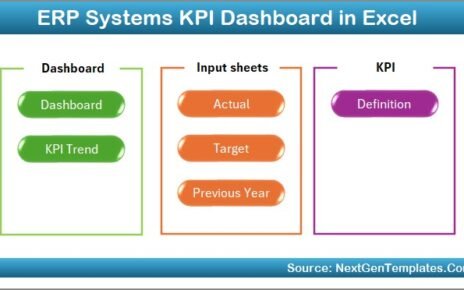
This dashboard includes seven well-defined worksheets, each serving a specific purpose. Together, these sheets create a complete performance tracking system.
1. Home Sheet

The Home Sheet acts as an index page for the entire dashboard.
Why Is the Home Sheet Important?
On this sheet, users see six navigation buttons. Each button takes the user directly to a related worksheet.
This design improves usability because users no longer scroll through tabs manually. Instead, they jump to any section instantly.
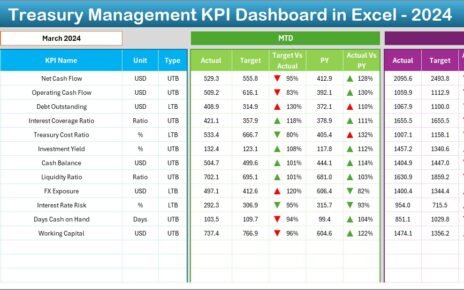
2.Dashboard Sheet

The Dashboard Sheet is the main analytical sheet of the file. It presents a consolidated view of all mortgage KPIs.
How Can You Select the Reporting Month?
On range D3, users select a Month from a drop-down list. Once selected, the entire dashboard updates automatically.
Because of this feature, users analyze performance month by month without changing formulas.
What KPI Data Appears on the Dashboard Sheet?
The dashboard shows both MTD (Month-to-Date) and YTD (Year-to-Date) performance.
How Does MTD Performance Tracking Work?
For MTD analysis, the dashboard displays:
-
MTD Actual – Current month performance
-
MTD Target – Defined goal for the month
-
MTD Previous Year (PY) – Same period last year
-
Target vs Actual – Performance ratio
-
PY vs Actual – Growth or decline compared to last year
Conditional formatting with green upward arrows and red downward arrows highlights performance instantly.
How Does YTD Performance Tracking Work?
For long-term analysis, the dashboard also shows:
-
YTD Actual – Cumulative current year performance
-
YTD Target – Cumulative target
-
YTD Previous Year – Last year cumulative results
-
Target vs Actual – Overall achievement level
-
PY vs Actual – Year-over-year comparison
This combined view ensures both short-term and strategic insights.
Click to Purchases Mortgage Lenders KPI Dashboard in Excel
3. KPI Trend Sheet
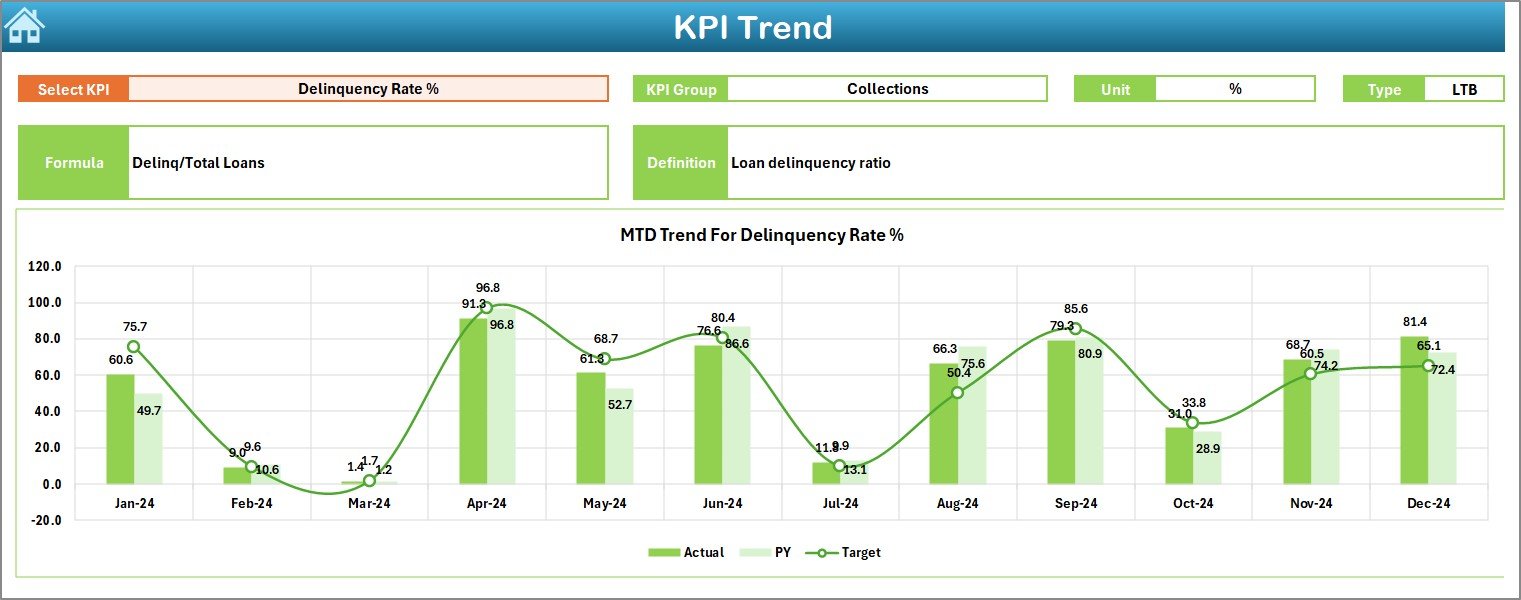
The KPI Trend Sheet focuses on trend-based analysis for individual KPIs.
How Do You Select a KPI for Trend Analysis?
On range C3, users select a KPI Name from a drop-down. Once selected, all KPI details and charts update automatically.
What KPI Details Appear on the KPI Trend Sheet?
The sheet displays:
-
KPI Group
-
KPI Unit
-
KPI Type (Lower the Better or Upper the Better)
-
KPI Formula
-
KPI Definition
This information ensures correct KPI interpretation.
Which Charts Appear on This Sheet?
The KPI Trend Sheet shows two charts:
-
MTD Trend Chart – Actual, Target, and PY comparison
-
YTD Trend Chart – Cumulative performance trends
These charts help users identify growth patterns and performance gaps.
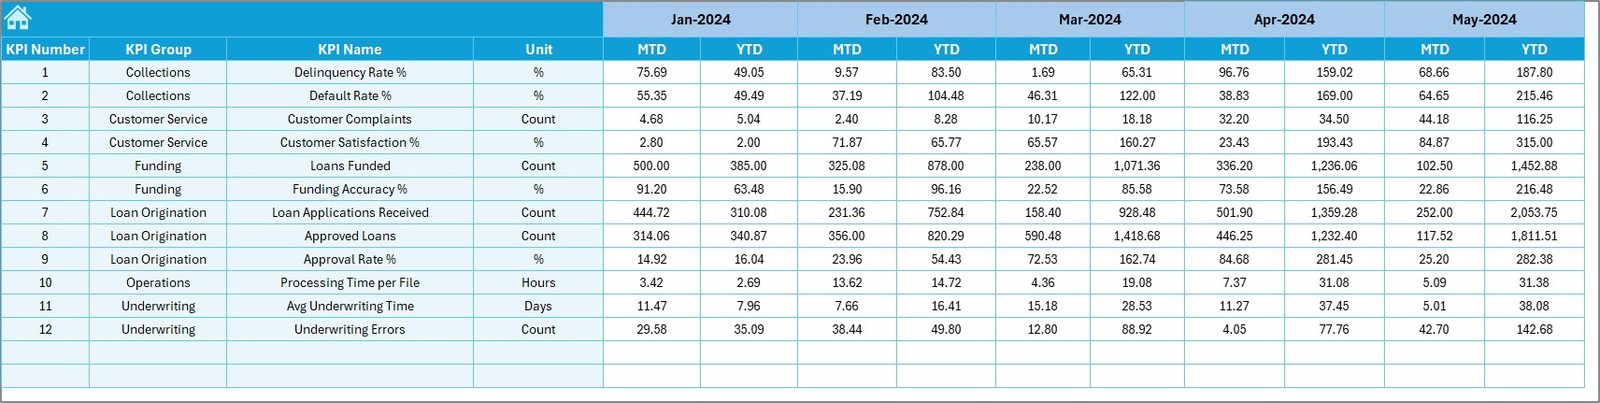
4. Actual Numbers Input Sheet
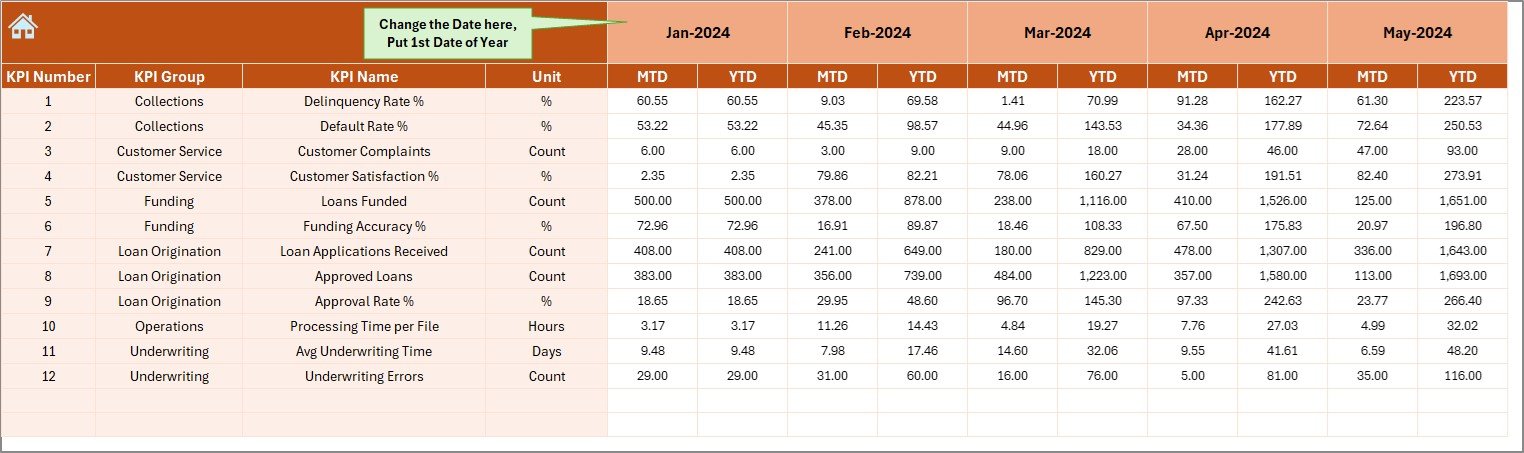
The Actual Numbers Input Sheet stores all actual mortgage data.
How Do Users Enter Actual Values?
Users:
-
Select the reporting month from range E1
-
Enter MTD and YTD actual values for each KPI
Because the dashboard links directly to this sheet, updates reflect instantly.
5. Target Sheet
The Target Sheet holds all target values.
How Does the Target Sheet Support Performance Tracking?
In this sheet, users enter:
-
KPI-wise MTD targets
-
KPI-wise YTD targets
Keeping targets separate improves clarity and flexibility.
Click to Purchases Mortgage Lenders KPI Dashboard in Excel
6. Previous Year Number Sheet
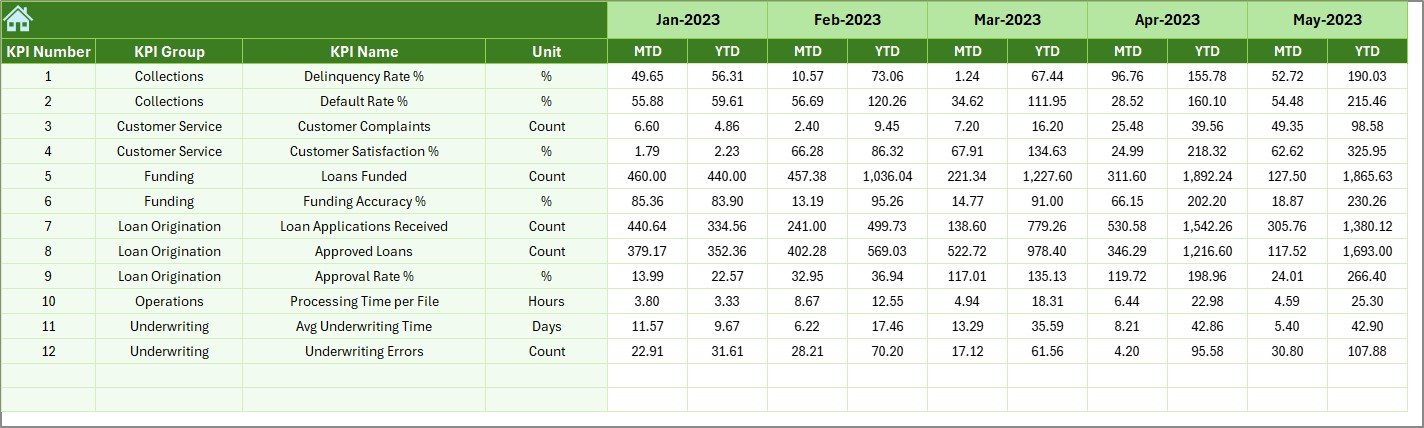
The Previous Year Number Sheet stores historical comparison data.
Why Is Previous Year Data Important?
Previous year data allows:
-
Year-over-year comparison
-
Growth trend analysis
-
Performance benchmarking
This sheet mirrors the structure of the current year data.
7.KPI Definition Sheet
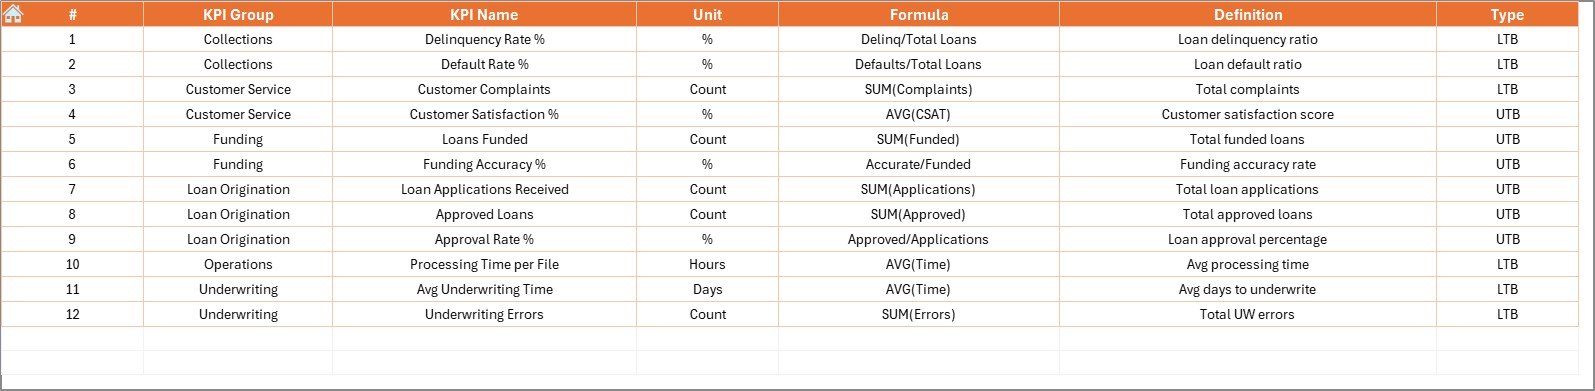
The KPI Definition Sheet defines the backbone of the dashboard.
It includes:
-
KPI Name
-
KPI Group
-
Unit
-
Formula
-
KPI Definition
Because this sheet controls KPI logic, it ensures consistency across reports.
Click to Purchases Mortgage Lenders KPI Dashboard in Excel
Advantages of Mortgage Lenders KPI Dashboard in Excel
Using this dashboard delivers multiple advantages:
✅ Centralized KPI tracking
✅ Faster performance reviews
✅ Clear target vs actual visibility
✅ Automated trend analysis
✅ Easy month-wise comparison
✅ Improved decision-making
As a result, mortgage teams operate with greater confidence.
How Does This Dashboard Improve Mortgage Lending Decisions?
With clear KPIs, lenders can:
-
Reduce loan processing delays
-
Improve approval turnaround time
-
Monitor delinquency trends
-
Increase operational efficiency
-
Align lending goals with strategy
Because decisions rely on data, outcomes improve steadily.
Best Practices for the Mortgage Lenders KPI Dashboard in Excel
To achieve maximum value, follow these best practices:
-
Define KPIs clearly and consistently
-
Enter data on a fixed schedule
-
Review MTD and YTD metrics together
-
Validate formulas periodically
-
Use trend charts for performance review
-
Limit manual overwriting of formulas
Following these steps ensures accuracy and trust in the dashboard.
Click to Purchases Mortgage Lenders KPI Dashboard in Excel
Who Should Use a Mortgage Lenders KPI Dashboard?
This dashboard suits:
-
Mortgage lenders
-
Loan processing teams
-
Credit risk managers
-
Operations leaders
-
Finance and compliance teams
Because Excel skills remain common, adoption becomes easy.
Conclusion
A Mortgage Lenders KPI Dashboard in Excel provides clarity, control, and consistency in mortgage performance tracking. By combining structured input sheets, automated calculations, and visual insights, it transforms raw lending data into actionable intelligence.
For mortgage lenders aiming to improve efficiency, manage risk, and boost profitability, this dashboard becomes an essential decision-making tool.
Click to Purchases Mortgage Lenders KPI Dashboard in Excel
Frequently Asked Questions (FAQs)
What is a Mortgage Lenders KPI Dashboard in Excel?
It is an Excel-based dashboard that tracks mortgage KPIs using MTD and YTD data.
Can I customize KPIs in this dashboard?
Yes. You can modify KPIs easily using the KPI Definition sheet.
Does the dashboard support month-wise analysis?
Yes. You can select any month using the drop-down, and the dashboard updates automatically.
Is previous year comparison supported?
Yes. The dashboard compares current year data with previous year numbers.
Do I need advanced Excel skills to use this dashboard?
No. Basic Excel knowledge is sufficient to use and maintain it.
Click to Purchases Mortgage Lenders KPI Dashboard in Excel
Visit our YouTube channel to learn step-by-step video tutorials