Home>Blogs>Charts and Visualization>Multilayered Doughnut Chart : Part-1>Multi Layered Doughnut Chart (Part-1) -2
Multi Layered Doughnut Chart (Part-1) -2
10
Jun 2018
2780
PK
Meet PK, the founder of PK-AnExcelExpert.com! With over 15 years of experience in Data Visualization, Excel Automation, and dashboard creation. PK is a Microsoft Certified Professional who has a passion for all things in Excel. PK loves to explore new and innovative ways to use Excel and is always eager to share his knowledge with others. With an eye for detail and a commitment to excellence, PK has become a go-to expert in the world of Excel. Whether you're looking to create stunning visualizations or streamline your workflow with automation, PK has the skills and expertise to help you succeed. Join the many satisfied clients who have benefited from PK's services and see how he can take your Excel skills to the next level!
https://www.pk-anexcelexpert.com
Related Articles
Hedge Funds Dashboard in Power BI
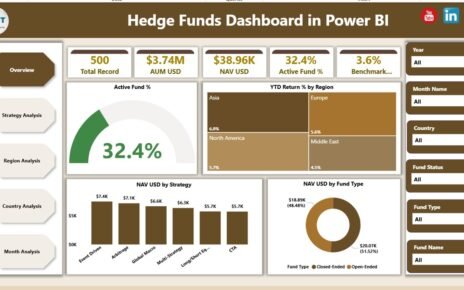
Managing hedge fund performance without clear visibility often creates blind spots, delayed decisions, and missed opportunities. However, modern investment teams
Open Universities KPI Dashboard in Excel
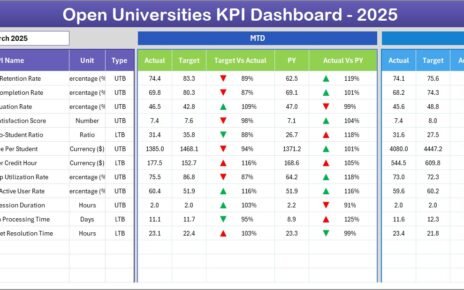
The Open Universities KPI Dashboard in Excel tracks 20+ performance indicators across 7 structured worksheets, covering enrollment rates, graduation rates,
Regulatory Reporting KPI Dashboard in Excel
Regulatory reporting plays a crucial role in ensuring that businesses comply with industry regulations and government policies. It involves tracking


