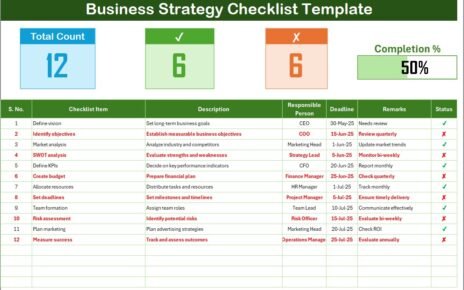
Home>Blogs>Charts and Visualization>Multiple KPIs Visualization in Excel>Multiple KPI Visualization – 1
Multiple KPI Visualization – 1
10
Jul 2019
253Comments Off on Multiple KPI Visualization – 1
PK
Meet PK, the founder of PK-AnExcelExpert.com! With over 15 years of experience in Data Visualization, Excel Automation, and dashboard creation. PK is a Microsoft Certified Professional who has a passion for all things in Excel. PK loves to explore new and innovative ways to use Excel and is always eager to share his knowledge with others. With an eye for detail and a commitment to excellence, PK has become a go-to expert in the world of Excel. Whether you're looking to create stunning visualizations or streamline your workflow with automation, PK has the skills and expertise to help you succeed. Join the many satisfied clients who have benefited from PK's services and see how he can take your Excel skills to the next level!
https://www.pk-anexcelexpert.com
Related Articles
Store Operations KPI Dashboard in Power BI
In today’s fast-moving retail industry, store operations play a crucial role in driving customer satisfaction, efficiency, and profitability. Managing hundreds
Shared Services Centers KPI Dashboard in Excel
Shared Services Centers (SSC) play a critical role in modern organizations. Companies centralize functions such as finance, HR, procurement, IT
Pharmaceutical Dashboard in Power BI
Effective tracking and analysis of pharmaceutical sales, profit margins, inventory, and other key performance indicators (KPIs) is essential for any


