In today’s data-driven world, even non-profit organizations need to track performance with accuracy. Although their primary goal isn’t profit-making, understanding how effectively they use resources, manage donations, and achieve social outcomes is crucial. This is where a Non-Profit KPI Scorecard in Excel becomes an indispensable tool.
This ready-to-use Excel template simplifies performance monitoring, turning complex data into actionable insights. It allows non-profit leaders to visualize trends, measure progress, and make informed decisions without requiring advanced analytics knowledge.
Let’s dive into how this powerful Excel scorecard works, its features, benefits, and how your non-profit can use it to measure success more effectively.
Click to Purchases Non-Profit KPI Scorecard in Excel
What Is a Non-Profit KPI Scorecard?
A Non-Profit KPI Scorecard is a data management and reporting tool that helps non-profits track key performance indicators (KPIs) related to their missions, programs, and operations.
It provides a clear, visual summary of how well the organization is performing against its objectives — whether that’s increasing fundraising efficiency, boosting volunteer engagement, improving donor retention, or achieving greater program reach.
Using Excel for this scorecard makes it accessible, flexible, and cost-effective. Non-profits can easily input, update, and analyze data — no expensive software required.
Structure of the Non-Profit KPI Scorecard in ExcelOperations KPI Scorecard in Excel
The Non-Profit KPI Scorecard in Excel includes four powerful worksheets, each with a specific purpose. Together, they create a comprehensive performance management system that helps organizations monitor progress with clarity.
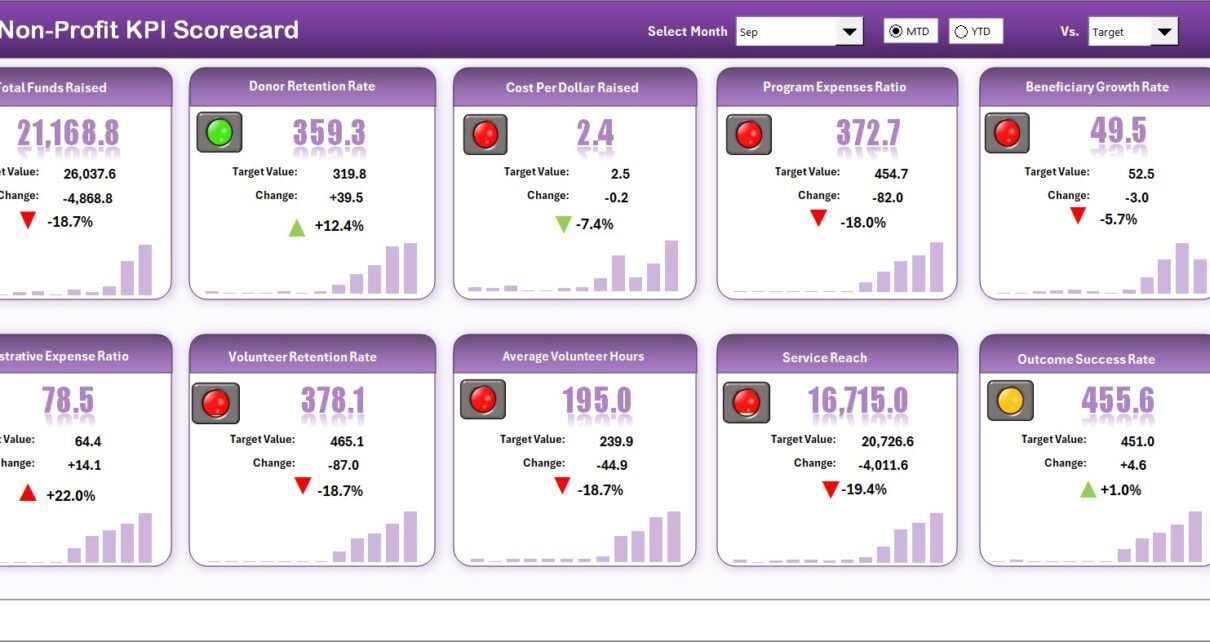
Scorecard Sheet – The Central Dashboard
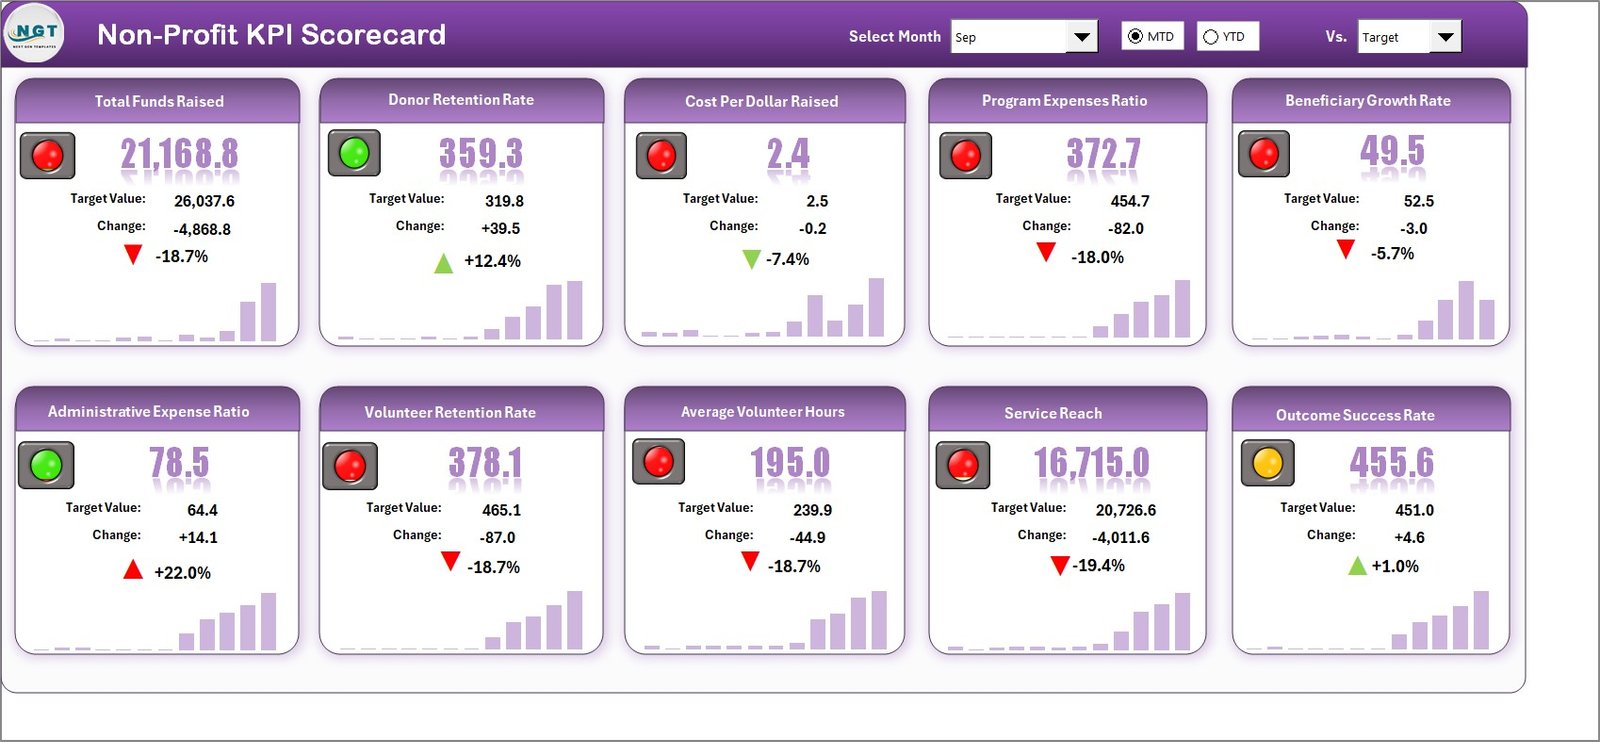
The Scorecard Sheet serves as the main interface where users can view overall performance metrics.
Key features:
-
🎯 Dropdown Menus: Select the month, and toggle between Month-to-Date (MTD) and Year-to-Date (YTD) analysis for flexible reporting.
-
📈 Actual vs Target Comparison: Instantly compare performance metrics against predefined targets to track whether goals are being met.
-
🔵 Visual Indicators: Conditional formatting and color-coded visuals make it easy to identify areas performing well (green) and those needing attention (red).
-
📋 Comprehensive KPI Overview: Displays KPI numbers, names, categories, and progress percentages — all in a single glance.
The Scorecard sheet helps board members, executives, and managers quickly assess where the organization stands and where improvements are needed.
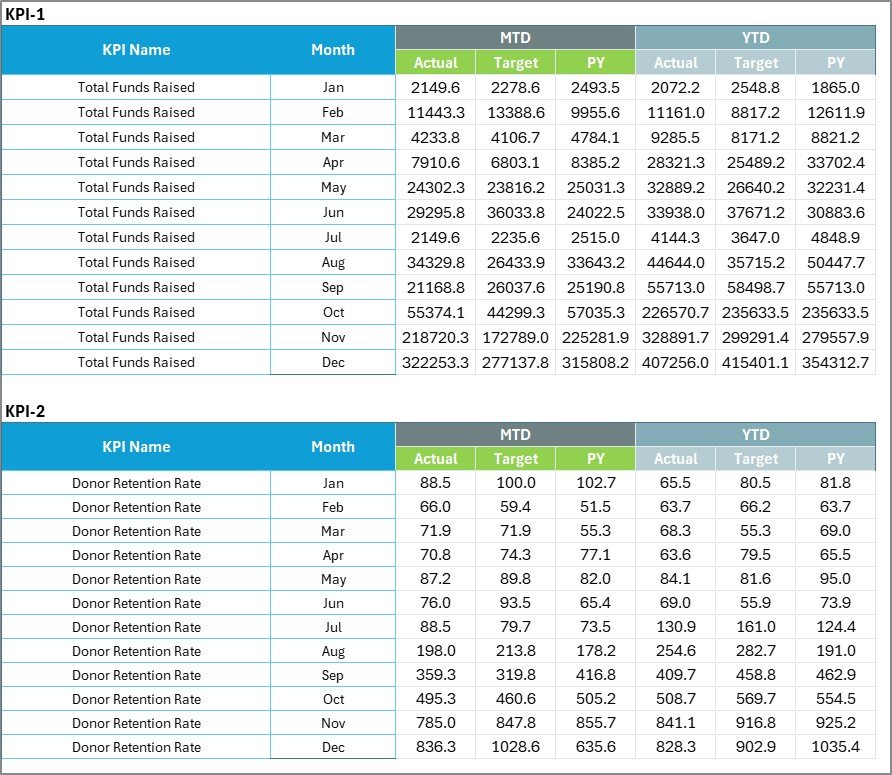
KPI Trend Sheet – Tracking Performance Over Time
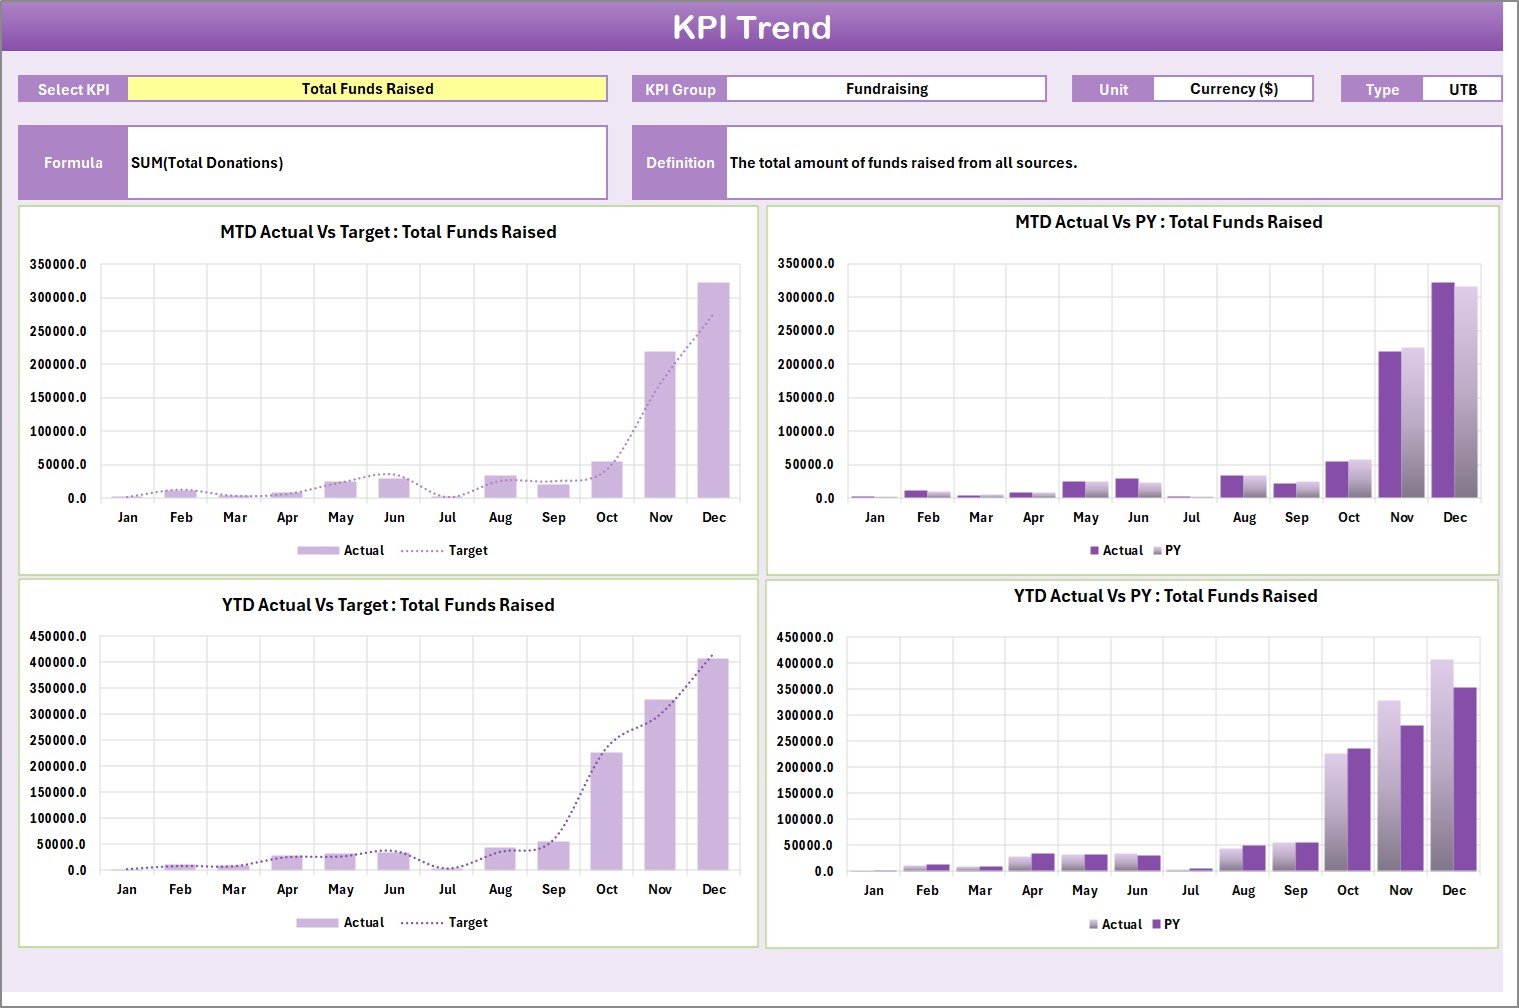
The KPI Trend Sheet is designed for in-depth analysis of each KPI’s progress.
Highlights:
✅ Dropdown Selection: Choose a KPI from a dropdown list in cell C3 to view its details.
📘 KPI Information: Displays KPI group, unit of measure, type (UTB or LTB), formula, and definition.
📊 Dynamic Trend Charts: MTD and YTD charts visually compare actual, target, and previous year values.
This visualization enables users to identify performance patterns, seasonal variations, and long-term trends — critical for strategy refinement.
Click to Purchases Non-Profit KPI Scorecard in Excel
Input Data Sheet – The Backbone of the Scorecard
The Input Data Sheet acts as the database for all KPI metrics.
Features:
-
🧮 Data Entry Simplicity: Users can enter monthly actual and target values without complex formulas.
-
🕒 Real-Time Updates: Modify or add new records anytime — the dashboard automatically reflects updates.
-
🗂️ Structured Format: Organized by KPI name, group, and time period for seamless data analysis.
This sheet ensures your data is consistent, accurate, and always up to date.
KPI Definition Sheet – The Foundation of Understanding
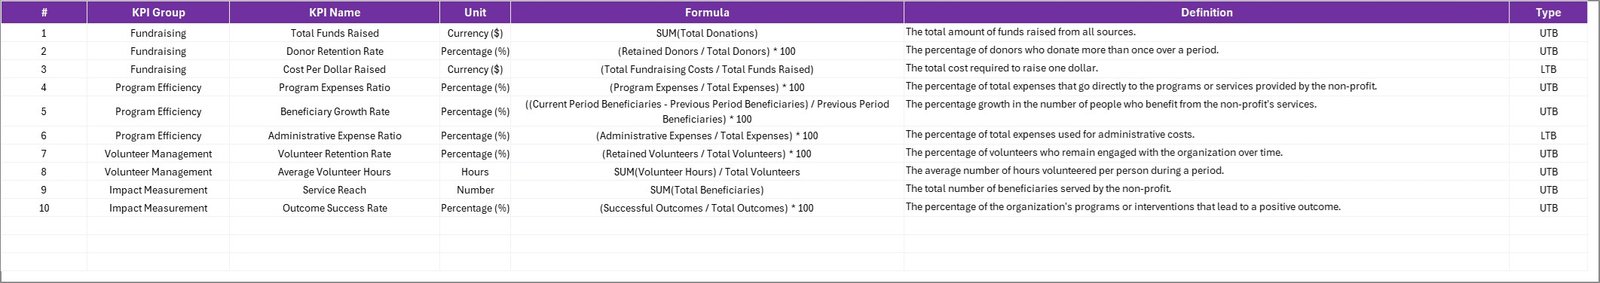
The KPI Definition Sheet provides a reference for all metrics used in the scorecard.
It includes:
-
KPI Name
-
KPI Group
-
Unit of Measure
-
Formula Used
-
KPI Definition
Having clear definitions helps teams align their understanding of what each KPI represents. It eliminates ambiguity and ensures everyone tracks metrics consistently across departments or programs.
Why Non-Profits Need a KPI Scorecard
Non-profits face unique challenges: they must balance limited resources while ensuring transparency and accountability. Measuring impact effectively is key to sustaining donor trust and organizational growth.
Here are some reasons why every non-profit should use a KPI scorecard:
-
Performance Clarity: Quickly identify which programs are succeeding and which need improvement.
-
Data-Driven Decisions: Replace assumptions with actionable insights based on real data.
-
Donor Transparency: Provide stakeholders with clear, data-backed progress reports.
-
Operational Efficiency: Streamline data tracking across fundraising, volunteer management, and outreach efforts.
-
Goal Alignment: Ensure every department works toward the same mission-driven objectives.
Key Performance Indicators for Non-Profit Organizations
Non-profit KPIs differ from those in for-profit businesses because the focus is on impact, not income. Here are some essential KPIs commonly tracked in non-profits:
1. Fundraising KPIs
-
Total Donations Received
-
Cost per Dollar Raised
-
Donor Retention Rate
-
Average Donation Size
2. Volunteer Engagement KPIs
-
Volunteer Participation Rate
-
Volunteer Hours per Event
-
Retention Rate of Volunteers
3. Program Effectiveness KPIs
-
Beneficiaries Served
-
Program Success Rate (%)
-
Impact per Dollar Spent
4. Operational Efficiency KPIs
-
Administrative Cost Ratio
-
Program Expense Ratio
-
Budget Variance
5. Marketing & Awareness KPIs
-
Website Traffic
-
Social Media Engagement
-
Event Attendance Rate
These KPIs provide a 360-degree view of performance across every function in a non-profit organization.
How the Non-Profit KPI Scorecard in Excel Works
The template is designed for simplicity and adaptability. You can track multiple KPIs across different categories, departments, or projects.
Step-by-Step Workflow:
-
Define KPIs: List your key metrics in the KPI Definition sheet.
-
Enter Data: Input actual and target values monthly in the Input Data sheet.
-
View Scorecard: Analyze MTD and YTD summaries in the Scorecard sheet.
-
Analyze Trends: Use the KPI Trend sheet for detailed visual tracking.
-
Take Action: Use insights to guide operational improvements and donor communications.
Everything updates automatically once you modify the data, saving valuable time and effort.
Advantages of the Non-Profit KPI Scorecard in Excel
Using this Excel-based KPI scorecard brings several advantages to non-profit organizations:
1. Cost-Effective
-
No need for expensive analytics software — Excel provides all the power you need for free.
2. Easy to Use
-
User-friendly interface with dropdowns and visuals that require no technical background.
3. Customizable
-
Add or remove KPIs, modify formulas, and personalize visuals to fit your organization’s structure.
4. Improves Accountability
-
Clear visual representation of KPIs ensures teams stay focused and accountable for results.
5. Boosts Donor Confidence
-
Transparent data reporting enhances credibility and helps attract more funding.
6. Enhances Strategic Planning
-
Historical and trend analysis helps leaders make better long-term decisions.
7. Real-Time Performance Insights
-
Instantly view how your organization is performing month-over-month or year-over-year.
8. Promotes Collaboration
-
Teams can align around shared goals using consistent performance metrics.
Customizing the KPI Scorecard for Your Non-Profit
Every organization is different, and this scorecard allows easy customization. Here’s how you can tailor it:
-
Adjust KPI Groups: Add new categories like “Community Outreach” or “Health Programs.”
-
Change Visuals: Use charts or progress bars to make data storytelling easier.
-
Set Dynamic Targets: Align performance benchmarks with annual goals or donor expectations.
-
Automate Reports: Use Excel formulas and pivot tables for automatic report generation.
By tweaking the scorecard layout, you can ensure it reflects your organization’s mission and objectives perfectly.
Best Practices for Using the Non-Profit KPI Scorecard
Click to Purchases Non-Profit KPI Scorecard in Excel
To get the most out of your KPI scorecard, follow these best practices:
1. Define SMART KPIs
Make sure each KPI is Specific, Measurable, Achievable, Relevant, and Time-bound.
2. Review Monthly
Regular updates ensure data accuracy and timely insights.
3. Involve Key Stakeholders
Include program heads, finance teams, and communication officers in KPI setting and review sessions.
4. Keep Data Clean
Maintain consistency in data entry to avoid inaccurate results.
5. Visualize Effectively
Use charts, progress bars, and conditional formatting to simplify complex data.
6. Benchmark Progress
Compare results across time periods or against similar organizations.
7. Document Definitions
Keep your KPI Definition sheet updated so all users interpret metrics correctly.
8. Link KPIs to Mission Goals
Every metric should directly support your organization’s mission and strategy.
Common Mistakes to Avoid
While implementing KPI scorecards, non-profits sometimes face pitfalls. Avoid these to ensure success:
-
Tracking too many KPIs at once
-
Using inconsistent data sources
-
Failing to set realistic targets
-
Ignoring underperforming areas
-
Not communicating insights effectively
Consistency and focus are key to meaningful analysis.
How KPI Scorecards Support Long-Term Sustainability
When non-profits use scorecards effectively, they build stronger foundations for sustainability.
-
Better Decision-Making: Data-driven insights lead to more effective programs.
-
Increased Funding: Demonstrating measurable impact attracts donors.
-
Improved Efficiency: Resources are allocated based on performance data.
-
Transparency: Clear metrics foster accountability within the organization.
Ultimately, a Non-Profit KPI Scorecard helps organizations achieve more — with less effort and cost.
Real-Life Use Case Example
Let’s imagine an NGO called Bright Future Foundation that focuses on education initiatives.
They use this Excel scorecard to track:
-
Fundraising Efficiency: Cost per dollar raised
-
Program Impact: Number of students enrolled
-
Volunteer Engagement: Average volunteer hours per month
-
Awareness: Event attendance and social reach
By tracking these metrics monthly, the foundation notices a pattern — donations increase after each awareness event. They allocate more budget to community campaigns, improving both engagement and funding.
This example shows how a simple Excel scorecard can drive smarter decisions and tangible impact.
How to Download and Use the Non-Profit KPI Scorecard Template
You can easily get started with this ready-to-use Excel template. Once downloaded, follow these steps:
-
Open the Excel file and navigate to the KPI Definition Sheet.
-
Enter your organization’s KPIs, groups, units, and formulas.
-
Go to the Input Data Sheet and fill in your actual and target data.
-
Review the Scorecard Sheet for overall performance.
-
Use the KPI Trend Sheet for monthly and yearly performance tracking.
That’s it — your performance dashboard is ready to guide decision-making.
Conclusion
The Non-Profit KPI Scorecard in Excel is more than a spreadsheet — it’s a strategic companion for any organization striving for measurable impact.
By combining data visualization, automation, and simplicity, it empowers non-profits to assess performance, demonstrate accountability, and continuously improve outcomes.
Whether you’re a small community NGO or a large foundation, this Excel-based KPI scorecard can help you track progress, make better decisions, and tell your success story with confidence.
❓ Frequently Asked Questions (FAQs)
1. What is a KPI Scorecard for Non-Profits?
A KPI Scorecard is a performance management tool that tracks essential indicators like fundraising, volunteer hours, and program success to measure organizational effectiveness.
2. Why should non-profits use Excel for KPI tracking?
Excel offers flexibility, affordability, and customization. Non-profits can easily adapt templates, input data, and generate visuals without advanced technical skills.
3. How many KPIs should a non-profit track?
Ideally, track 10–15 critical KPIs that align with your strategic objectives. Too many metrics can dilute focus.
4. Can I customize this Excel template?
Yes, the Non-Profit KPI Scorecard is fully customizable. You can add new KPIs, edit formulas, and change visuals as needed.
5. How often should I update the KPI data?
Monthly updates are recommended for accurate trend analysis and timely performance evaluation.
6. Can this scorecard be shared with donors?
Absolutely. The scorecard helps present results transparently and professionally, strengthening donor relationships.
7. Is this tool suitable for small non-profits?
Yes, it’s perfect for small and mid-sized organizations that want to manage data effectively without investing in expensive tools.
Visit our YouTube channel to learn step-by-step video tutorials