Protecting our oceans has become one of the biggest environmental priorities today. Marine ecosystems support life on Earth, regulate the climate, and sustain millions of people through fisheries, tourism, and coastal activities. Because of this, ocean protection programs need accurate data, faster decision-making, and a structured way to track conservation performance.
An Ocean Conservation KPI Scorecard in Excel offers a simple, visual, and practical reporting system that helps conservation teams understand their progress, identify challenges, and take action at the right time. In this article, you will explore everything about this scorecard—its structure, features, advantages, best practices, and answers to common questions.
Click to Purchases Ocean Conservation KPI Scorecard in Excel
🌊 What Is an Ocean Conservation KPI Scorecard in Excel?
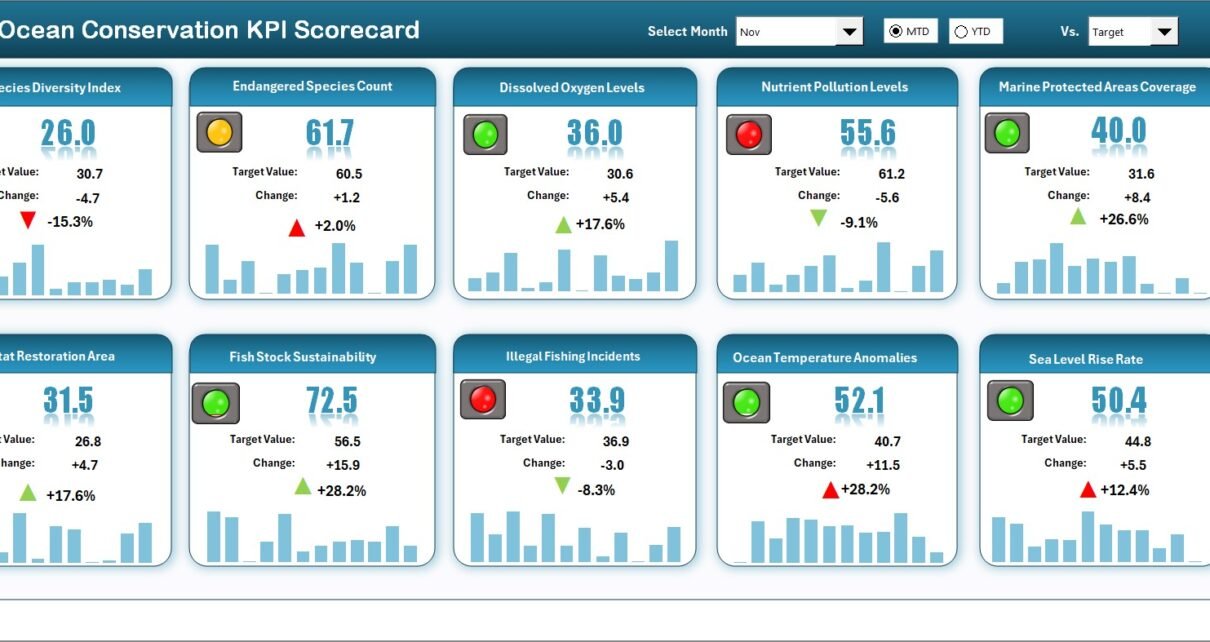
An Ocean Conservation KPI Scorecard in Excel is a ready-to-use reporting template designed to track the performance of marine protection programs. It organizes key metrics related to water quality, marine species, pollution control, coastal health, waste reduction, and community participation into one visual dashboard.
The scorecard helps teams understand Month-to-Date (MTD) and Year-to-Date (YTD) progress. Because it uses Excel, it becomes easy to use, portable, and customizable. Anyone—from researchers to NGOs to government teams—can analyze complex conservation data without advanced software.
🐬 Why Does Ocean Conservation Need a KPI Scorecard?
Ocean conservation programs collect large amounts of data. However, without a structured system, that data becomes difficult to interpret. A KPI scorecard solves this problem because it:
-
Organizes all conservation KPIs in one place
-
Displays results visually
-
Helps teams compare actual values with targets
-
Shows year-on-year progress
-
Supports faster and informed decision-making
Because conservation efforts span months, seasons, and years, teams need a reliable tool that updates quickly. Excel offers a simple solution that is easy to maintain and scale.
Click to Purchases Ocean Conservation KPI Scorecard in Excel
🧭 Structure of the Ocean Conservation KPI Scorecard in Excel
This scorecard includes four key worksheets, each built to help conservation teams record, analyze, and review KPI performance.
1️⃣ Scorecard Sheet – The Main Dashboard
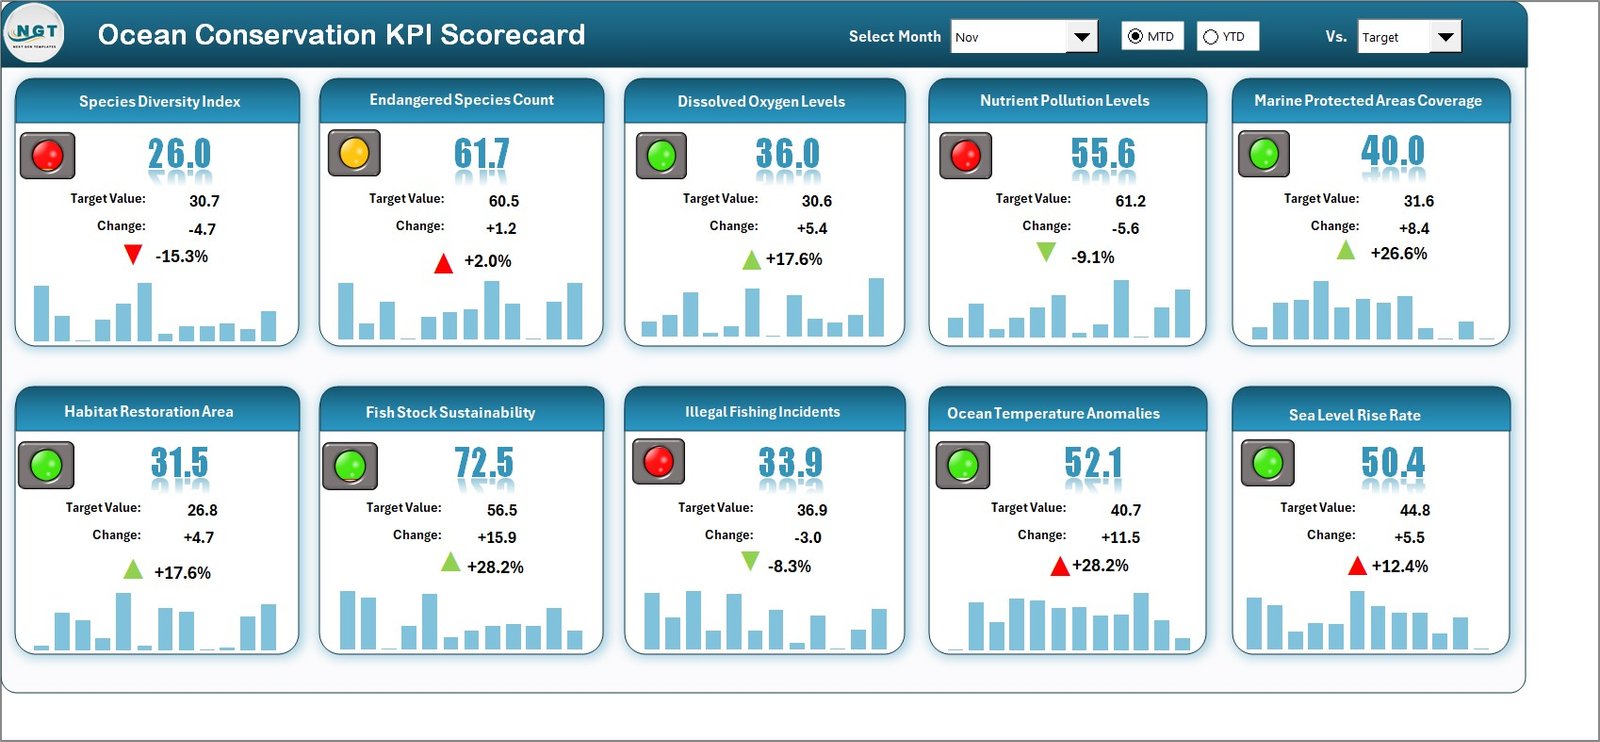
The Scorecard Sheet works as the main interface for performance analysis. It displays all KPIs along with their MTD and YTD comparisons.
⭐ Key Features of the Scorecard Sheet
-
Dropdown Menus:
Select the month and choose whether you want to analyze MTD or YTD performance. This helps you view accurate data for different reporting periods. -
Actual vs Target Comparison:
Analyze the difference between the actual KPI values and the assigned target values. You can instantly see whether your conservation program is on track. -
Visual Indicators:
Color-coded indicators highlight the performance status. Green, yellow, and red coloring helps users identify improvement areas within seconds. -
Comprehensive Overview:
The sheet displays all KPIs, their values, their nature (UTB or LTB), and monthly comparisons in one screen.
Because this sheet offers a complete snapshot of conservation data, it becomes the most frequently used part of the file.
2️⃣ KPI Trend Sheet – Track Performance Over Time
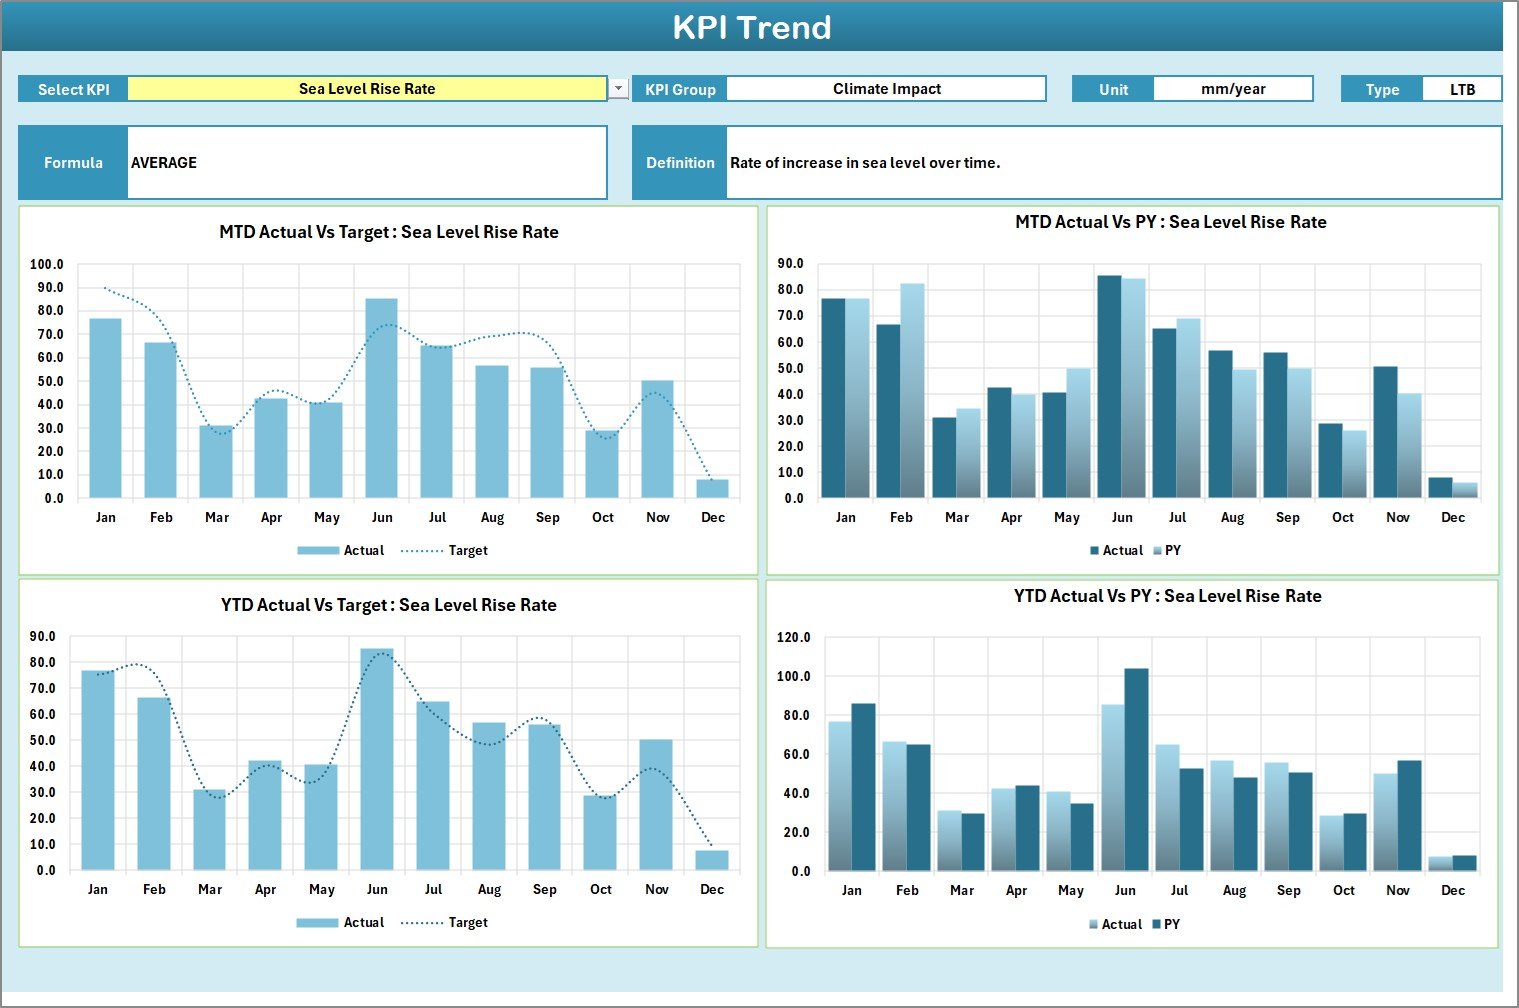
The KPI Trend Sheet helps teams understand how a KPI behaves over different months and seasons. Long-term tracking is important in conservation because many KPIs such as coral health, water clarity, and fish stock recovery require consistent monitoring.
⭐ Highlights of the Trend Sheet
-
KPI Name Selection:
Select the KPI name using the dropdown list in cell C3. -
Automated KPI Details:
Once you select a KPI, the sheet displays:-
KPI Group
-
Unit of Measurement
-
KPI Type (UTB or LTB)
-
Formula
-
KPI Definition
-
-
Trend Charts:
You can view separate charts for:-
MTD Actual vs Target vs Previous Year
-
YTD Actual vs Target vs Previous Year
-
These charts help conservation managers understand whether their strategies work, or if they need to adjust.
Click to Purchases Ocean Conservation KPI Scorecard in Excel
3️⃣ Input Data Sheet – Update All KPI Values
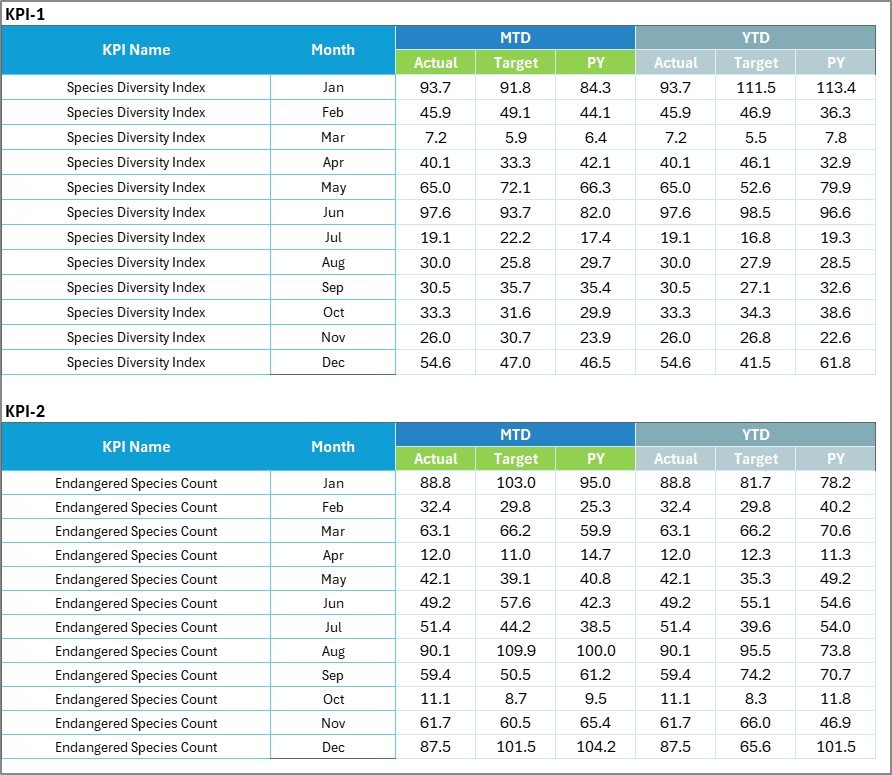
The Input Data Sheet works as the data engine of the scorecard. You can record the KPI values for each month here.
⭐ Key Benefits
-
Easy Data Entry:
Enter actual numbers, targets, and previous-year values in a structured format. -
Flexible Updates:
You can update this sheet every month. The Scorecard and Trend sheets will refresh automatically. -
Accurate Reporting:
Clean data ensures consistent reporting and prevents calculation errors.
4️⃣ KPI Definition Sheet – Standardize Key Metrics
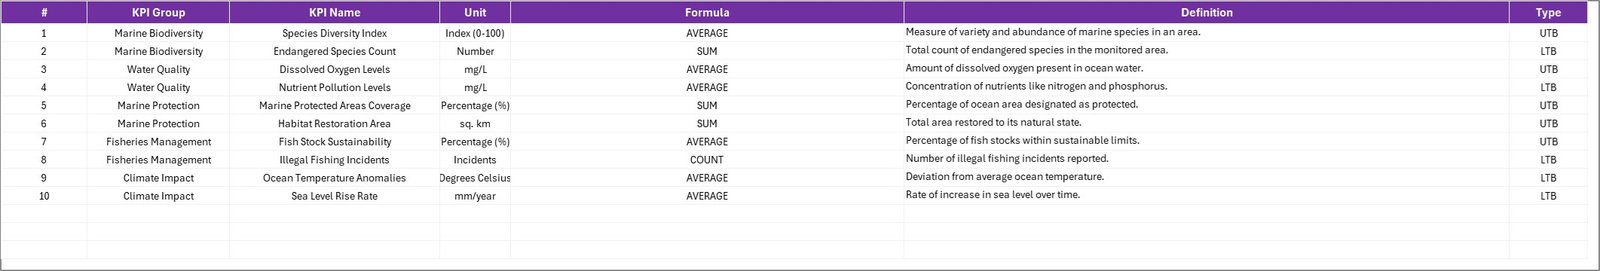
The KPI Definition Sheet helps teams maintain clarity by defining each metric clearly.
⭐ What This Sheet Includes
Enter the following information for every KPI:
-
KPI Name
-
KPI Group
-
Unit
-
Formula
-
KPI Definition
When teams use a consistent definition for each KPI, they avoid confusion and ensure everyone interprets the data correctly.
🌍 Why an Ocean Conservation KPI Scorecard Matters
The world relies on healthy oceans to maintain biodiversity, regulate climate, and support local communities. A KPI scorecard helps track how well conservation efforts work. It also shows the impact of pollution control measures, waste reduction programs, and marine life protection initiatives.
Because ocean ecosystems change rapidly, teams need updated insights to respond quickly. The KPI scorecard makes this possible.
🌊 Advantages of Using an Ocean Conservation KPI Scorecard in Excel
When your conservation program uses an Excel-based scorecard, you enjoy several benefits.
✔ 1. Better Visibility Into Conservation Efforts
Teams get a clear, unified view of all KPIs. They can see what works and what needs improvement without searching through multiple files.
✔ 2. Faster and More Informed Decisions
Because the scorecard provides real-time updates, conservation managers take action faster. For example, if marine waste increases, the team can respond quickly.
✔ 3. Improved Accountability
Transparency helps teams stay aligned with conservation goals. It also allows stakeholders to evaluate the program’s progress.
✔ 4. Easy Customization
Excel allows you to add new KPIs, adjust formulas, change layout designs, or include new metrics at any time.
✔ 5. Cost-Effective and Easy to Use
Unlike complex software, Excel is widely available. Teams do not require advanced skills to use the scorecard.
✔ 6. Strong Reporting Capabilities
The scorecard includes automated charts and dashboards that make reporting more engaging and professional.
Click to Purchases Ocean Conservation KPI Scorecard in Excel
🐳 Best Practices for the Ocean Conservation KPI Scorecard
To get better results from the scorecard, follow these best practices.
⭐ 1. Update Data Regularly
Record KPI values monthly to maintain an accurate performance history.
⭐ 2. Use Clear KPI Definitions
Clearly define each KPI to avoid confusion between teams, departments, and stakeholders.
⭐ 3. Maintain Data Accuracy
Double-check the Input Data Sheet to ensure realistic and error-free entries.
⭐ 4. Compare Performance With Previous Years
Historical comparisons highlight long-term success and show whether improvement strategies work.
⭐ 5. Use Conditional Formatting
Visual cues make it easier for users to identify Positive or Negative performance instantly.
⭐ 6. Review Trends Before Making Decisions
Trend analysis reveals deeper insights that you cannot see through single-month data.
⭐ 7. Add New KPIs as Needed
Ocean conservation is dynamic. New challenges may require new KPIs. Excel makes it easy to expand the scorecard.
Click to Purchases Ocean Conservation KPI Scorecard in Excel
🌐 Use Cases of the Ocean Conservation KPI Scorecard
This scorecard supports many marine and environmental use cases:
-
Coral reef protection programs
-
Marine pollution control
-
Plastic waste reduction
-
Fish population recovery
-
Coastal biodiversity improvement
-
Seawater quality monitoring
-
Community cleanup programs
-
Marine species tracking
-
Sustainable coastal development
Because the scorecard works for all conservation activities, it becomes a universal reporting tool for environmental teams.
🧩 How the Scorecard Supports Better Reporting
Excel offers a strong foundation for data analysis. The scorecard combines formulas, charts, dropdown lists, and structured data entry to create a clean reporting system.
Some reporting advantages include:
-
Trend analysis
-
Month-to-month progress
-
Year-over-year comparisons
-
Actual vs target performance
-
Automated visuals
-
Quick export options
Teams can present the scorecard in meetings, share it with donors, or attach it in conservation reports.
🌱 Conclusion
Ocean conservation requires smart tracking, faster insights, and clear decision-making tools. The Ocean Conservation KPI Scorecard in Excel provides all these benefits in a simple, visual, and user-friendly format. Because the scorecard includes Scorecard Sheets, Trend Sheets, Input Data Sheets, and KPI Definitions, it becomes a complete solution for data-driven conservation.
With accurate KPIs, updated data, and meaningful trends, conservation teams can protect marine life more effectively and work toward healthier oceans.
Click to Purchases Ocean Conservation KPI Scorecard in Excel
❓ Frequently Asked Questions (FAQs)
1. What is an Ocean Conservation KPI Scorecard?
It is a reporting tool that tracks marine conservation KPIs such as water quality, pollution levels, marine species recovery, and coastal health.
2. Who uses this KPI scorecard?
Marine biologists, NGOs, government agencies, environmental researchers, and conservation organizations use it regularly.
3. Why should I create KPIs for ocean conservation?
KPIs help measure progress, identify challenges, and ensure conservation programs move in the right direction.
4. Can I customize the Excel scorecard?
Yes, you can add new KPIs, modify formulas, change chart styles, or expand the layout.
5. How often should I update the data?
You should update the input sheet every month to get accurate MTD and YTD results.
6. Does the scorecard show trend charts?
Yes, the KPI Trend Sheet shows MTD and YTD trend charts for Actual, Target, and Previous Year values.
7. Is Excel enough for conservation reporting?
For most teams, yes. Excel provides structure, visual dashboards, charts, and formulas that support effective reporting.
Click to Purchases Ocean Conservation KPI Scorecard in Excel
Visit our YouTube channel to learn step-by-step video tutorials