Managing office leases sounds simple at first. However, when you handle multiple locations, industries, lease types, and financial terms, things quickly become complex. Therefore, organizations need a structured and visual system to track lease performance clearly.
That is exactly where the Office Lease Management Dashboard in Power BI becomes powerful.
Instead of reviewing scattered spreadsheets, you can monitor rent, maintenance charges, security deposits, renewals, expirations, and trends — all in one interactive dashboard.
In this detailed guide, you will learn:
- What an Office Lease Management Dashboard in Power BI is
- Why businesses need it
- Complete explanation of all 5 dashboard pages
- Key metrics you can track
- Advantages of Office Lease Management Dashboard in Power BI
- Best Practices for the Office Lease Management Dashboard
- Frequently Asked Questions with Answers
Click to buy Office Lease Management Dashboard in Power BI
What Is an Office Lease Management Dashboard in Power BI?
An Office Lease Management Dashboard in Power BI is an interactive reporting solution that helps organizations track and analyze their office lease data in real time.
It converts structured data into meaningful visual insights. As a result, decision-makers can:
- Track rent obligations
- Monitor maintenance charges
- Analyze lease renewals
- Review industry distribution
- Identify expiring leases
- Study monthly trends
Moreover, Power BI allows you to apply slicers (filters) to view data by region, lease type, industry, or status instantly. Therefore, you do not waste time preparing manual reports.
Why Do Businesses Need an Office Lease Management Dashboard?
Many companies manage leases using Excel sheets. However, when lease counts increase, manual tracking creates errors and delays. Consequently, leaders struggle to see financial exposure and renewal risks.
Here is why businesses need this dashboard:
How Can You Control Lease Costs Better?
Without proper tracking, rent and maintenance charges increase unnoticed. However, this dashboard shows:
- Monthly rent totals
- Annual rent commitments
- Security deposits
- Maintenance cost distribution
Therefore, finance teams can control expenses proactively.
How Can You Reduce Renewal Risks?
If you miss renewal dates, you may face penalties. However, this dashboard tracks:
- Renewed lease %
- Expired lease %
- Terminated leases
As a result, you can take action before deadlines approach.
How Can You Improve Financial Visibility?
Instead of reviewing static reports, you can:
- Filter by industry
- Analyze lease type distribution
- Compare active vs expired leases
- Monitor monthly performance
Therefore, leadership teams gain complete visibility.
Detailed Explanation of All 5 Dashboard Pages
The Office Lease Management Dashboard in Power BI includes 5 powerful pages. Each page focuses on a specific area of lease management.
Let us explore each page in detail.
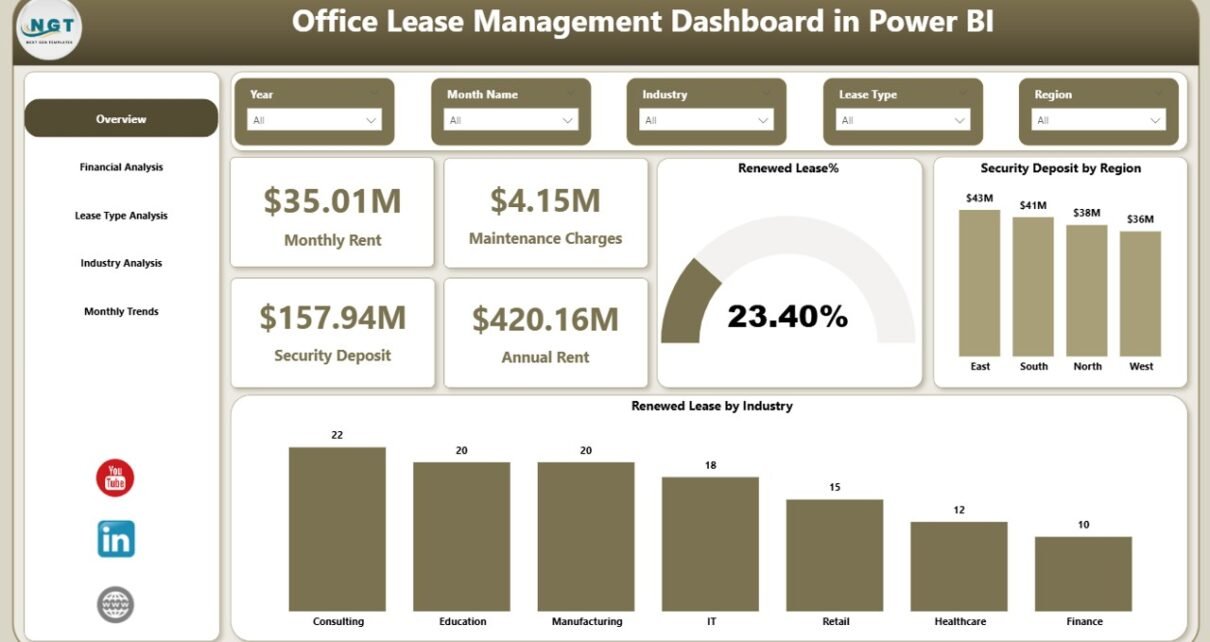
Overview Page – How Do You Get a Quick Summary?
The Overview Page works as the central control panel. It gives a snapshot of all major lease metrics.
Key Elements on the Overview Page
KPI Cards
You will see 4 important cards:
- Monthly Rent
- Maintenance Charges
- Security Deposit
- Annual Rent
These cards instantly show financial exposure.
Renewal Insights
- Renewed Lease %
- Renewed Lease by Industry
- Security Deposit by Region
Therefore, you can understand both financial and operational performance at a glance.
Slicers (Filters)
You can apply slicers to filter data by:
- Region
- Industry
- Lease Type
- Lease Status
As a result, the entire dashboard updates instantly.
Why Is the Overview Page Important?
Because it provides:
- High-level financial visibility
- Renewal performance summary
- Regional security deposit distribution
Therefore, decision-makers can quickly understand the lease portfolio health.

Click to buy Office Lease Management Dashboard in Power BI
Financial Analysis – How Can You Monitor Lease Costs?
The Financial Analysis Page focuses entirely on financial data.
Charts Available on Financial Analysis Page
- Annual Rent by Lease Type
- Maintenance Charges by Industry
- Annual Rent and Security Deposit by Lease Status
What Insights Can You Extract?
- Which lease type generates higher annual rent?
- Which industry incurs higher maintenance costs?
- How much security deposit remains under active leases?
Moreover, you can identify cost-heavy industries and optimize leasing strategies.
Why Does Financial Analysis Matter?
Because rent and maintenance form a major expense. Therefore, this page helps:
- Budget planning
- Expense forecasting
- Financial risk analysis

Click to buy Office Lease Management Dashboard in Power BI
Lease Type Analysis – How Do Different Lease Types Perform?
Lease agreements often vary. Some organizations use long-term leases, while others prefer short-term contracts.
The Lease Type Analysis Page helps you compare lease types clearly.
Charts on Lease Type Analysis Page
- Active Lease % by Lease Type
- Security Deposit by Lease Type
- Maintenance Charges by Lease Type
What Can You Learn?
- Which lease type remains most active?
- Which lease type requires higher deposits?
- Which lease type generates higher maintenance expenses?
Therefore, you can decide whether to continue certain lease structures.

Click to buy Office Lease Management Dashboard in Power BI
Industry Analysis – Which Industries Drive Lease Revenue?
If your organization leases offices across industries, you must understand which industries contribute more revenue.
The Industry Analysis Page focuses on industry-level insights.
Charts on Industry Analysis Page
- Annual Rent by Industry
- Renewed Lease by Industry
- Expired Lease % by Industry
Why Is Industry Analysis Important?
Because it helps you:
- Identify high-performing industries
- Detect industries with high expiration rates
- Adjust leasing strategies
Moreover, if one industry shows lower renewals, you can renegotiate terms proactively.

Click to buy Office Lease Management Dashboard in Power BI
Monthly Trends – How Do Lease Activities Change Over Time?
Trend analysis helps you understand patterns.
The Monthly Trends Page shows time-based insights.
Charts on Monthly Trends Page
- Maintenance Charges by Month Name
- Renewed Lease by Month Name
- Terminated Lease by Month Name
What Can You Identify?
- Seasonal increase in maintenance costs
- Peak renewal months
- Months with high lease termination
Therefore, you can plan resources and negotiations accordingly.

Click to buy Office Lease Management Dashboard in Power BI
Key Metrics You Can Track in the Office Lease Management Dashboard
This dashboard tracks multiple performance indicators, including:
- Monthly Rent
- Annual Rent
- Maintenance Charges
- Security Deposit
- Renewed Lease %
- Expired Lease %
- Terminated Lease Count
- Active Lease %
Moreover, you can calculate:
- Total Lease Portfolio Value
- Deposit Exposure by Region
- Renewal Performance by Industry
Advantages of Office Lease Management Dashboard in Power BI
Now let us explore the key benefits.
- Real-Time Insights
Because Power BI connects with live data, you can view updated numbers instantly.
- Interactive Filtering
You can use slicers to filter by region, industry, lease type, or status. Therefore, analysis becomes flexible.
- Financial Control
You can track rent and maintenance clearly. As a result, you reduce budget surprises.
- Better Renewal Planning
You can monitor renewals and expirations. Therefore, you avoid penalties.
- Visual Clarity
Instead of reading long tables, you see charts and KPIs. Consequently, decision-making becomes faster.
- Centralized Reporting
All lease information remains in one system. Therefore, you eliminate scattered spreadsheets.
Best Practices for the Office Lease Management Dashboard
To maximize results, follow these best practices:
Keep Data Clean
Always update lease data regularly. Remove duplicates and errors.
Update Lease Status Monthly
Review expired and renewed leases at least once per month.
Monitor High-Risk Leases
Identify leases nearing expiration. Then plan negotiations early.
Review Financial Trends Quarterly
Analyze maintenance and rent trends quarterly to avoid overspending.
Use Industry Insights for Strategy
Focus on industries with high renewal rates. Improve terms for industries with lower retention.
Protect Sensitive Data
Limit access to financial dashboards. Ensure secure sharing.
How Does Power BI Improve Lease Management Compared to Excel?
Although Excel works well, Power BI offers:
- Dynamic visualizations
- Better filtering
- Faster data refresh
- Improved sharing capability
- Stronger performance with large datasets
Therefore, Power BI provides scalable lease management.
How Can Organizations Use This Dashboard Strategically?
Organizations can use this dashboard to:
- Plan future office expansions
- Evaluate lease profitability
- Negotiate better contracts
- Reduce idle property cost
- Optimize security deposit allocation
Moreover, leadership teams can present lease insights during financial meetings confidently.
Conclusion
Office lease management requires accuracy, visibility, and proactive planning. However, manual tracking creates confusion and delays.
The Office Lease Management Dashboard in Power BI solves these challenges.
It provides:
- Financial clarity
- Renewal visibility
- Industry insights
- Lease type comparison
- Monthly trend analysis
Therefore, organizations can reduce risk, control expenses, and improve lease strategy.
If you want smarter lease tracking, this dashboard becomes your ideal solution.
Frequently Asked Questions with Answers
- What data do I need for this dashboard?
You need lease data including rent amount, maintenance charges, security deposit, lease type, industry, region, start date, end date, and status.
- Can I customize the dashboard?
Yes, you can customize charts, slicers, and KPIs according to your business needs.
- Can small businesses use this dashboard?
Yes, small businesses can use it effectively. Moreover, it works well for companies managing even 10–20 leases.
- Does the dashboard support large data volumes?
Yes, Power BI handles large datasets efficiently. Therefore, enterprises can manage hundreds or thousands of leases.
- How often should I update the data?
You should update lease data monthly. However, if your leases change frequently, update weekly.
- Can I share this dashboard with management?
Yes, you can publish it to Power BI Service and share secure access with leadership teams.
Visit our YouTube channel to learn step-by-step video tutorials
Watch the step-by-step video tutorial:
Click to buy Office Lease Management Dashboard in Power BI