Managing office vehicles is no longer simple. Fuel prices change frequently. Maintenance costs rise every year. Insurance premiums increase. Departments use vehicles differently. Vendors charge differently. Therefore, companies must track fleet performance with clarity and speed.
However, many businesses still manage vehicle data in scattered Excel files. As a result, managers struggle to track operating costs. They fail to compare department usage. They overlook downtime patterns. They also miss vendor cost trends.
So, how can you monitor total vehicles, purchase cost, maintenance expenses, insurance cost, downtime, mileage, and vendor performance in one interactive system?
Click to buy Office Vehicle Fleet Dashboard in Power BI
You need an Office Vehicle Fleet Dashboard in Power BI.
In this detailed guide, you will learn:
- What an Office Vehicle Fleet Dashboard in Power BI is
- Why organizations need it
- Detailed explanation of all 5 dashboard pages
- Important KPIs included
- Advantages of Office Vehicle Fleet Dashboard in Power BI
- Best practices for implementation
- Frequently Asked Questions with answers
Let us explore everything step by step.
What Is an Office Vehicle Fleet Dashboard in Power BI?
An Office Vehicle Fleet Dashboard in Power BI is a ready-to-use business intelligence solution designed to monitor and analyze office vehicle operations in real time.
It helps organizations:
- Track total vehicles
- Monitor purchase cost
- Control maintenance expenses
- Analyze insurance spending
- Compare department vehicle usage
- Evaluate vendor performance
- Study monthly cost trends
Instead of checking multiple reports, managers get a centralized dashboard that shows all important fleet KPIs in one place.
Because Power BI supports interactive slicers and filters, users can instantly switch between departments, regions, vendors, or months. Therefore, decision-makers get fast insights without manual calculations.
Why Do Organizations Need a Fleet Dashboard?
Fleet expenses form a major part of operational costs. Therefore, without proper tracking, businesses lose money silently.
Consider these common challenges:
- Departments overuse vehicles without monitoring fuel efficiency
- Maintenance costs rise due to lack of preventive tracking
- Insurance expenses increase year after year
- Downtime affects productivity
- Vendors charge differently without comparison
However, when companies implement a Power BI fleet dashboard, they gain:
- Clear cost visibility
- Department accountability
- Vendor comparison
- Downtime monitoring
- Data-driven budgeting
As a result, management reduces unnecessary expenses and improves efficiency.
Detailed Explanation of All 5 Dashboard Pages
The Office Vehicle Fleet Dashboard in Power BI contains 5 interactive pages. Each page focuses on a specific analysis area. Therefore, users can drill down into detailed performance metrics easily.
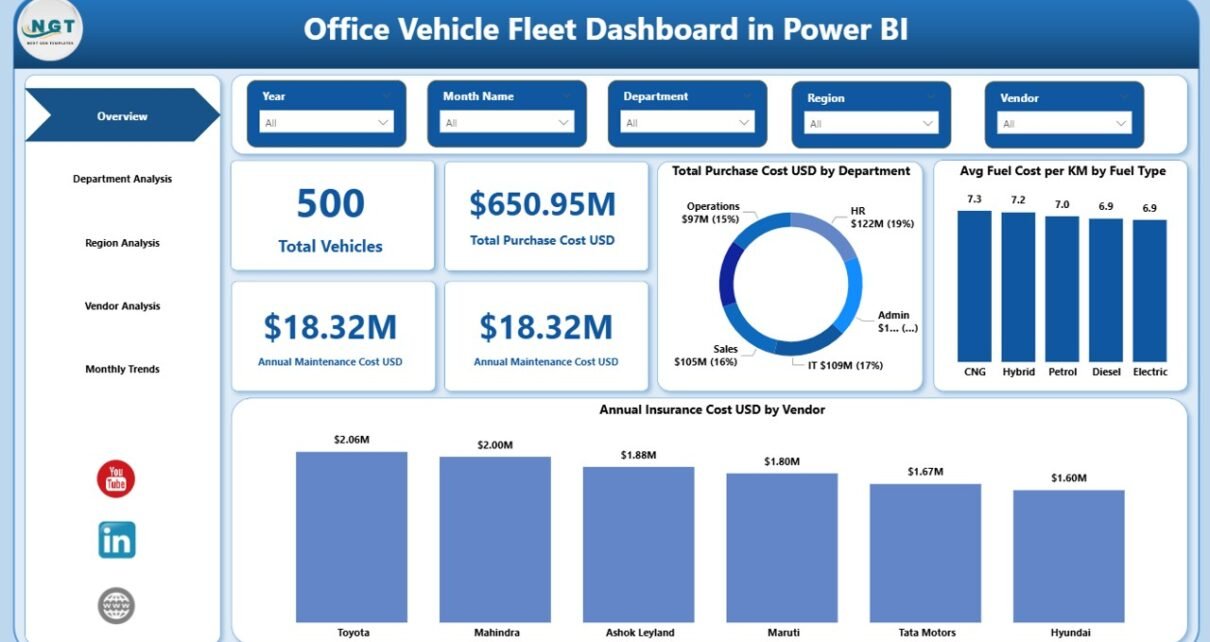
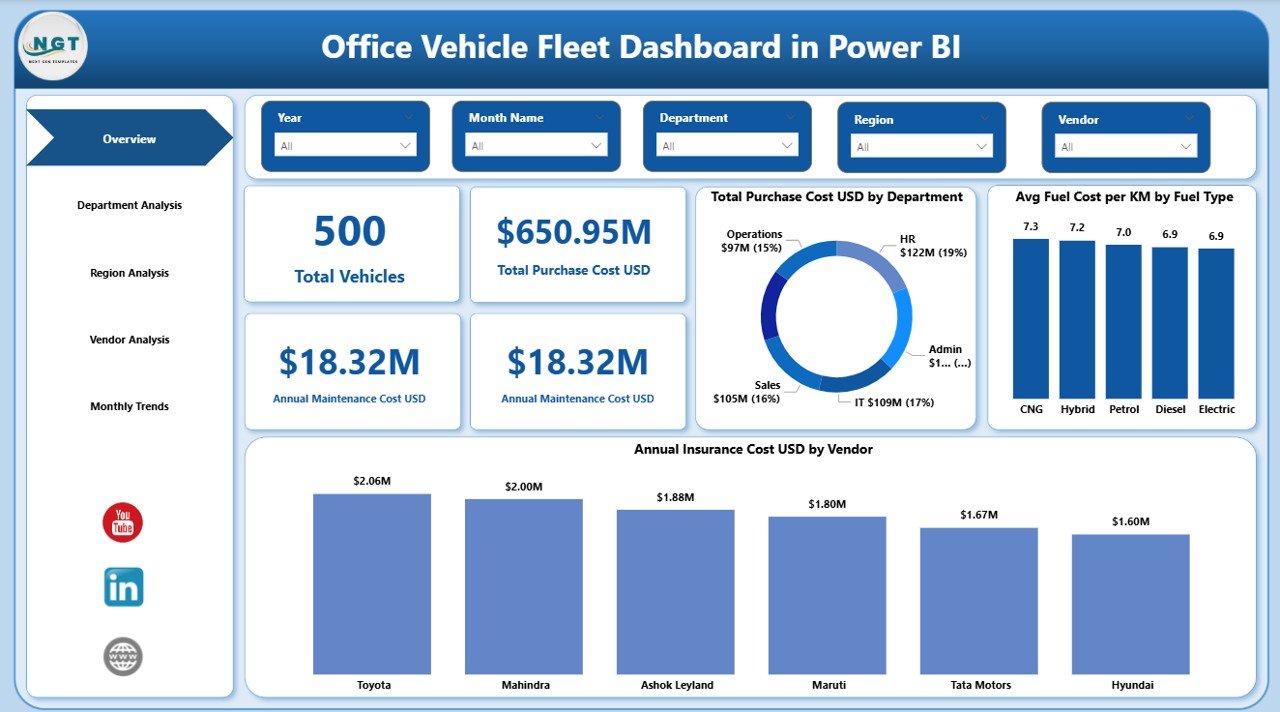
Overview Page – What Does the Main Dashboard Show?
The Overview Page acts as the command center of the fleet dashboard.
Key KPI Cards on the Overview Page:
- Total Vehicles
- Total Purchase Cost (USD)
- Annual Maintenance Cost (USD)
- Annual Insurance Cost (USD)
These KPI cards instantly show the overall fleet health.
For example:
- If total vehicles increase but maintenance cost rises sharply, managers can investigate vehicle age.
- If insurance cost grows disproportionately, finance teams can renegotiate contracts.
Because this page provides high-level metrics, senior management can review fleet performance in seconds.
Moreover, slicers allow users to filter data by:
- Year
- Department
- Region
- Vendor
Therefore, the overview remains dynamic and interactive.
Click to buy Office Vehicle Fleet Dashboard in Power BI
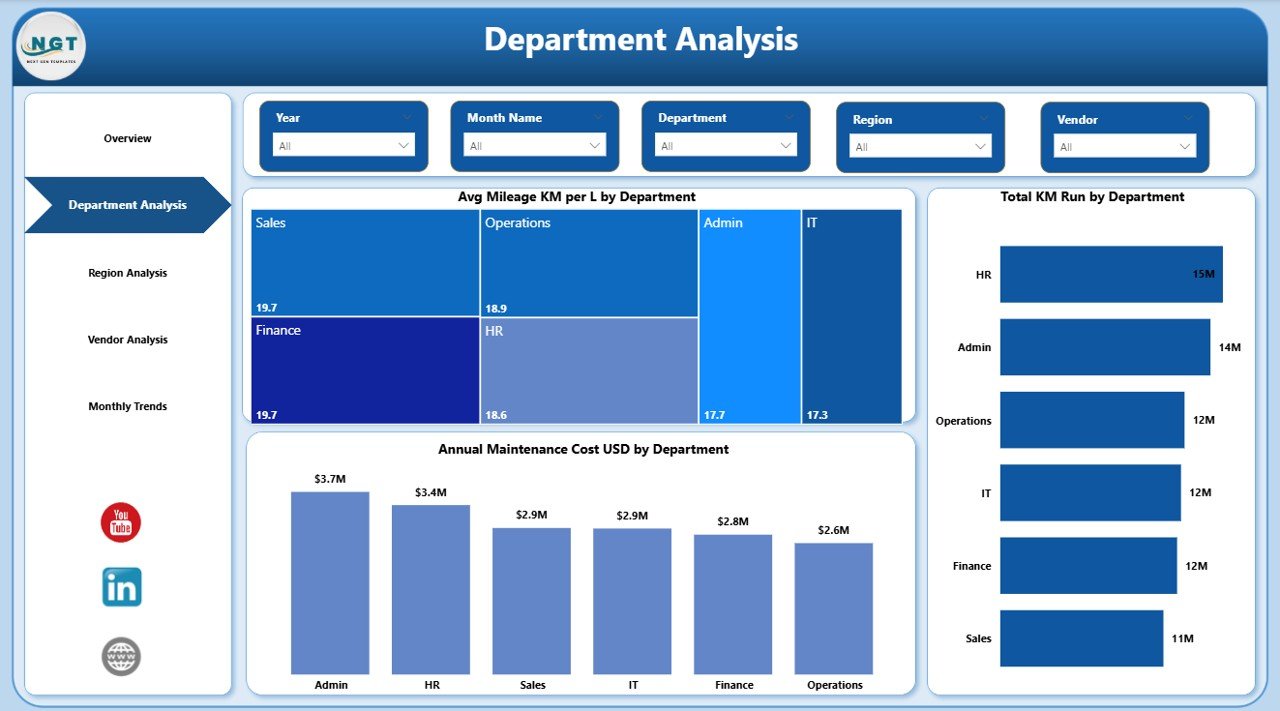
Department Analysis – How Do Departments Use Vehicles?
Different departments use vehicles differently. Sales teams travel more. Admin teams travel less. Logistics teams run heavy kilometers. Therefore, department analysis becomes essential.
Key Charts in Department Analysis:
- Average Mileage (KM per Liter) by Department
- Total KM Run by Department
- Annual Maintenance Cost by Department
This page answers critical questions:
- Which department consumes more fuel?
- Which department runs maximum kilometers?
- Which department spends more on maintenance?
For instance:
If one department shows low mileage efficiency and high maintenance cost, managers can investigate driving behavior or vehicle condition.
As a result, organizations improve accountability and optimize resource allocation.
Click to buy Office Vehicle Fleet Dashboard in Power BI
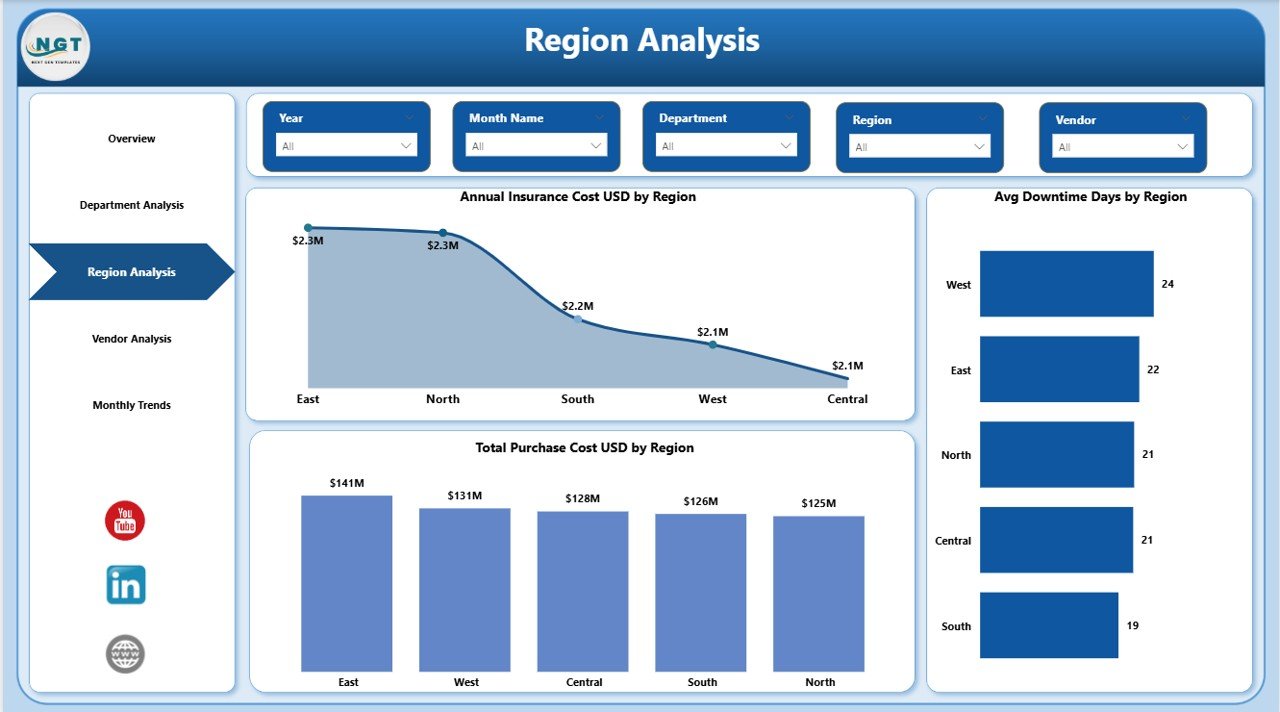
Sales Region Analysis – How Does Fleet Performance Differ by Region?
Fleet performance varies by region. Road conditions, fuel prices, and usage patterns differ. Therefore, regional analysis helps businesses control cost geographically.
Key Charts in Region Analysis:
- Annual Insurance Cost (USD) by Region
- Average Downtime Days by Region
- Total Purchase Cost (USD) by Region
This page helps management:
- Compare insurance premiums region-wise
- Identify regions with high vehicle downtime
- Analyze capital investment across regions
For example:
If one region shows high downtime, operations teams can check maintenance scheduling or vendor support. Consequently, they reduce idle time and improve vehicle availability.
Click to buy Office Vehicle Fleet Dashboard in Power BI
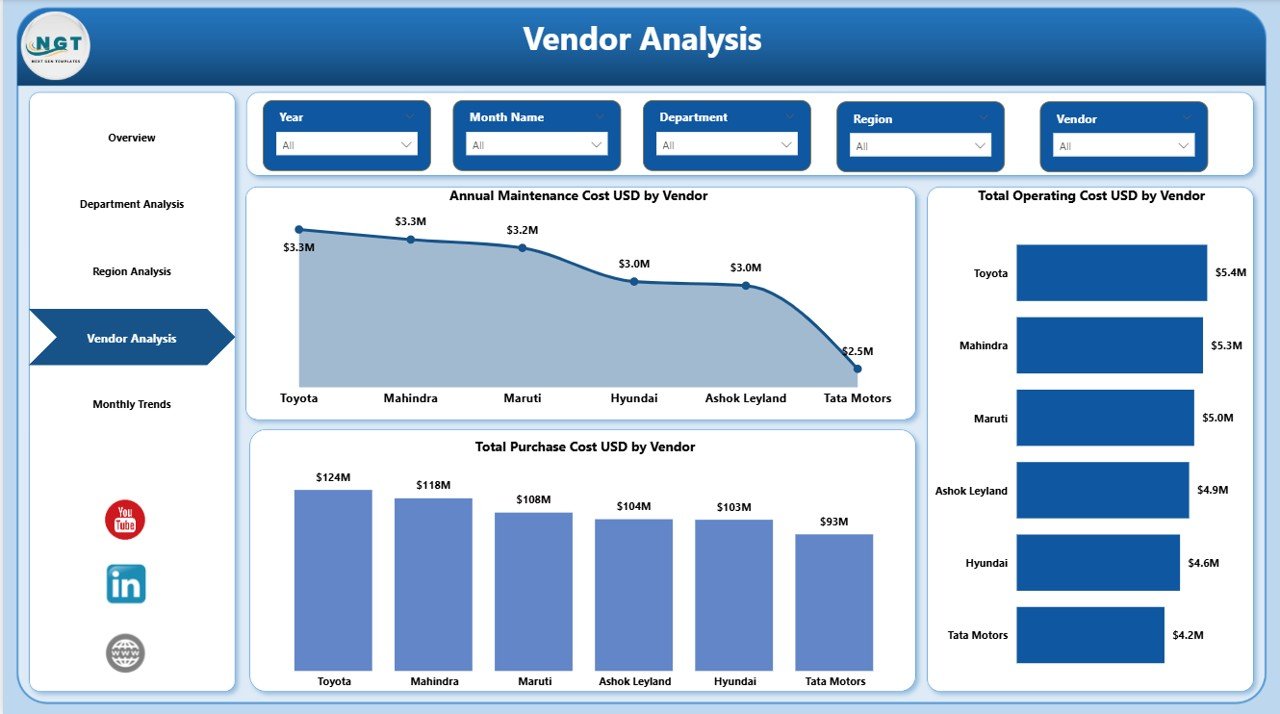
Vendor Analysis – Which Vendor Performs Best?
Vendors handle maintenance and sometimes supply vehicles. Therefore, vendor performance directly impacts fleet cost.
Key Charts in Vendor Analysis:
- Annual Maintenance Cost (USD) by Vendor
- Total Operating Cost (USD) by Vendor
This page enables:
- Vendor comparison
- Cost control
- Contract negotiation
For instance:
If one vendor charges higher maintenance cost but provides lower downtime, managers can evaluate cost-benefit. However, if both cost and downtime remain high, management can consider switching vendors.
Thus, vendor analysis strengthens procurement decisions.
Click to buy Office Vehicle Fleet Dashboard in Power BI
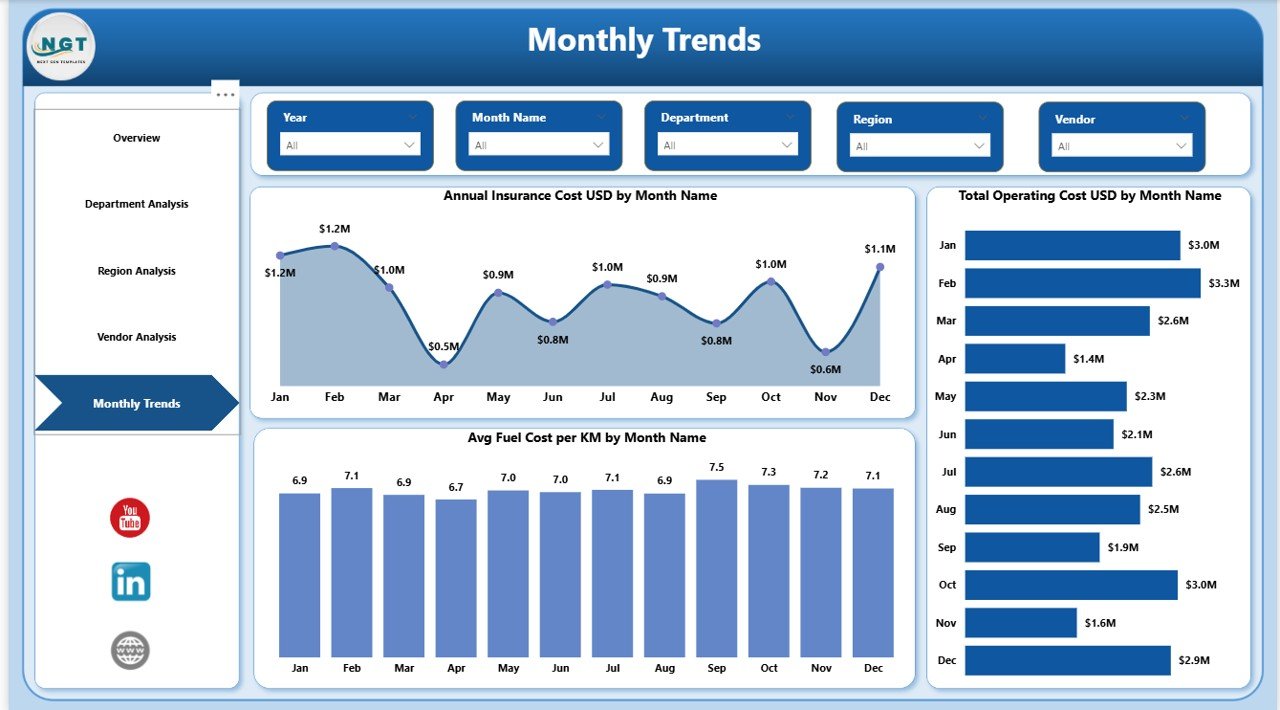
Monthly Trends – How Do Costs Change Over Time?
Monthly trends reveal patterns that yearly reports cannot show. Therefore, businesses must track expenses month by month.
Key Charts in Monthly Trends:
- Annual Insurance Cost (USD) by Month Name
- Total Operating Cost (USD) by Month Name
This page answers:
- Do insurance costs spike in specific months?
- Does operating cost increase seasonally?
For example:
If operating costs increase during peak sales months, management can prepare budgets accordingly.
Because trend charts highlight patterns clearly, decision-makers plan better for future expenses.
Click to buy Office Vehicle Fleet Dashboard in Power BI
Important KPIs Included in the Dashboard
The Office Vehicle Fleet Dashboard in Power BI tracks multiple KPIs that drive operational efficiency.
Financial KPIs
- Total Purchase Cost
- Annual Maintenance Cost
- Annual Insurance Cost
- Total Operating Cost
Operational KPIs
- Total Vehicles
- Total KM Run
- Average Mileage (KM per Liter)
- Downtime Days
Analytical KPIs
- Cost by Department
- Cost by Region
- Cost by Vendor
- Monthly Cost Trends
Together, these KPIs provide a complete fleet performance overview.
Advantages of Office Vehicle Fleet Dashboard in Power BI
Implementing this dashboard delivers significant benefits. Let us examine them clearly.
- Real-Time Data Visibility
Managers view updated metrics instantly. Therefore, they make quick decisions.
- Cost Control
Organizations track maintenance, insurance, and operating cost precisely. As a result, they reduce overspending.
- Department Accountability
Each department sees its usage and cost data. Consequently, teams drive responsibly.
- Vendor Performance Monitoring
Management compares vendors easily. Thus, procurement decisions improve.
- Regional Cost Analysis
Companies identify high-cost regions quickly. Therefore, they optimize fleet distribution.
- Better Budget Planning
Monthly trend analysis supports future forecasting. Hence, finance teams allocate budgets more accurately.
- Interactive Reporting
Power BI slicers and filters allow dynamic reporting. Therefore, users explore data independently.
Best Practices for the Office Vehicle Fleet Dashboard in Power BI
To maximize the dashboard’s effectiveness, follow these best practices.
- Keep Data Clean and Updated
Update vehicle, cost, and maintenance records regularly. Otherwise, analysis loses accuracy.
- Standardize Data Entry
Use consistent department names, vendor names, and region names. Therefore, filters work properly.
- Monitor KPIs Monthly
Review maintenance and insurance cost monthly. Consequently, you detect unusual spikes early.
- Track Preventive Maintenance
Schedule maintenance proactively. As a result, downtime reduces significantly.
- Compare Vendors Periodically
Evaluate vendor cost versus performance every quarter. Thus, you ensure fair pricing.
- Use Year Filters for Strategic Planning
Switch between years to study long-term trends. Therefore, leadership gains strategic insights.
- Share Dashboard with Decision Makers
Provide access to managers and finance teams. Consequently, everyone makes informed decisions.
How Does This Dashboard Improve Business Decisions?
This dashboard transforms raw fleet data into actionable insights.
Instead of guessing:
- Managers see real cost patterns
- Finance teams forecast accurately
- Operations reduce downtime
- Procurement negotiates better contracts
Because data drives decisions, organizations reduce waste and increase productivity.
Who Can Benefit from This Dashboard?
The Office Vehicle Fleet Dashboard in Power BI benefits:
- Corporate offices
- Logistics departments
- Sales organizations
- Government agencies
- Educational institutions
- Healthcare organizations
- Manufacturing companies
If an organization manages multiple vehicles, this dashboard becomes essential.
Conclusion
Fleet management requires precision, transparency, and timely insights. However, manual tracking creates confusion and delays.
The Office Vehicle Fleet Dashboard in Power BI solves this challenge effectively.
It provides:
- Centralized fleet monitoring
- Financial cost tracking
- Department usage analysis
- Regional performance review
- Vendor comparison
- Monthly trend insights
Therefore, businesses control costs, reduce downtime, and improve operational efficiency.
If your organization manages office vehicles, now is the right time to implement a Power BI fleet dashboard and transform your fleet management strategy.
Frequently Asked Questions (FAQs)
- What data do I need to build an Office Vehicle Fleet Dashboard in Power BI?
You need vehicle details, purchase cost, maintenance records, insurance expenses, department usage data, region information, vendor details, and monthly transaction data.
- Can I filter the dashboard by department or region?
Yes. Power BI slicers allow filtering by department, region, vendor, or year instantly.
- How often should I update the fleet dashboard?
You should update it monthly. However, weekly updates improve accuracy further.
- Can this dashboard track fuel efficiency?
Yes. It calculates average mileage (KM per liter) by department and vehicle category.
- Does the dashboard help in vendor selection?
Yes. It compares annual maintenance cost and operating cost by vendor, which supports vendor evaluation.
- Is Power BI better than Excel for fleet dashboards?
Power BI provides interactive visuals, faster filtering, and dynamic reporting. Therefore, it works better for large datasets.
- Can small businesses use this dashboard?
Yes. Even small organizations benefit because it improves cost tracking and operational control.
Visit our YouTube channel to learn step-by-step video tutorials
Watch the step-by-step video tutorial:
Click to buy Office Vehicle Fleet Dashboard in Power BI