Online marketplaces continue to grow rapidly. Businesses now sell products across platforms such as Amazon, Flipkart, Etsy, Shopify marketplaces, and many others. As competition increases, sellers and marketplace managers must track performance carefully. Otherwise, they may lose visibility into sales trends, customer behavior, and operational efficiency.
However, many marketplace teams still depend on scattered reports, manual calculations, or disconnected spreadsheets. As a result, decision-making becomes slow and inaccurate. Teams spend hours preparing reports instead of improving performance.
Therefore, businesses need a structured and automated way to monitor results. This is where the Online Marketplaces KPI Scorecard in Excel becomes extremely valuable.
An Online Marketplaces KPI Scorecard in Excel helps organizations monitor key performance indicators (KPIs), compare targets with actual performance, and analyze trends using a single interactive dashboard. Moreover, it allows managers to make faster, data-driven decisions without investing in expensive software.
In this detailed guide, you will learn everything about the Online Marketplaces KPI Scorecard in Excel, including its features, benefits, structure, best practices, and frequently asked questions.
Click to buy Online Marketplaces KPI Scorecard in Excel
What Is an Online Marketplaces KPI Scorecard in Excel?
An Online Marketplaces KPI Scorecard in Excel is a ready-to-use performance tracking system designed to measure marketplace success using Key Performance Indicators.
Instead of managing multiple reports, users can monitor all performance metrics in one organized workbook. Because Excel supports formulas, dropdowns, charts, and conditional formatting, the scorecard automatically converts raw data into meaningful insights.
This scorecard helps you:
- Track sales and operational performance
- Compare actual vs target values
- Monitor monthly and yearly trends
- Identify performance gaps quickly
- Improve marketplace strategy
Most importantly, the tool simplifies complex analytics into easy visual dashboards.
Why Is KPI Tracking Important for Online Marketplaces?
Online marketplaces operate in a highly competitive environment. Every small change in conversion rate, delivery performance, or customer satisfaction directly impacts revenue.
Without KPI tracking:
- Teams rely on assumptions instead of data.
- Problems remain unnoticed for long periods.
- Sales opportunities get missed.
- Operational costs increase.
On the other hand, when you use a KPI scorecard, you gain clear visibility into performance.
Key Outcomes of KPI Tracking
- Better decision-making
- Faster performance evaluation
- Improved customer experience
- Higher profitability
- Strong operational control
Therefore, KPI monitoring becomes essential for sustainable marketplace growth.
Key Features of the Online Marketplaces KPI Scorecard in Excel
This ready-to-use template includes structured worksheets designed to simplify performance monitoring. Let’s explore each sheet in detail.
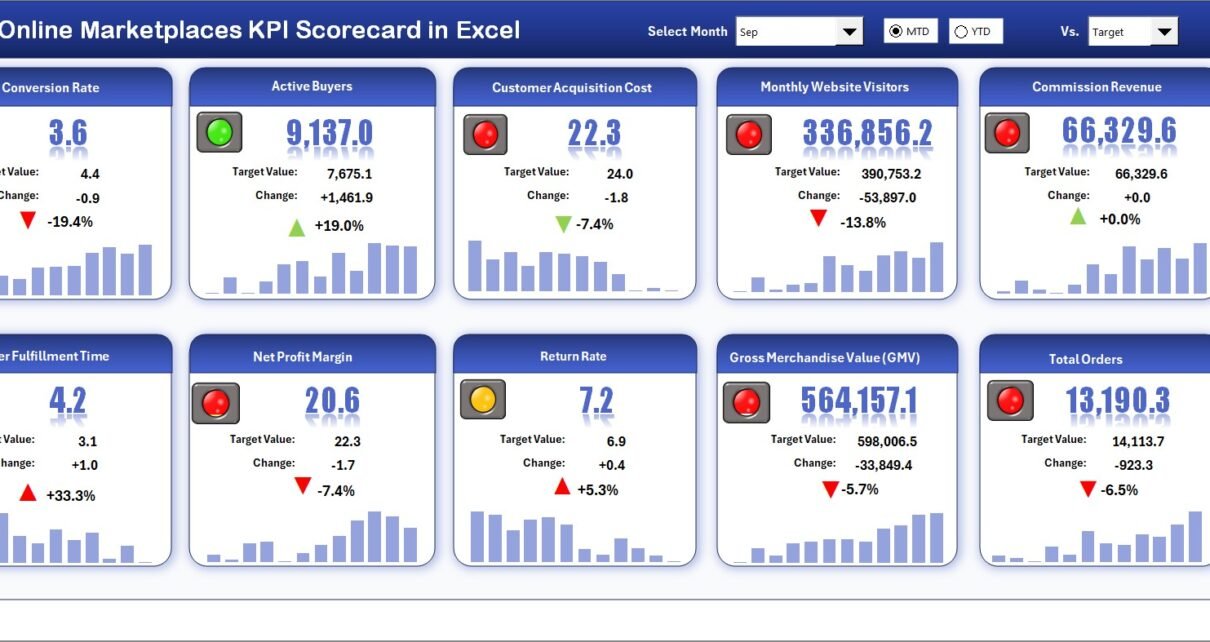
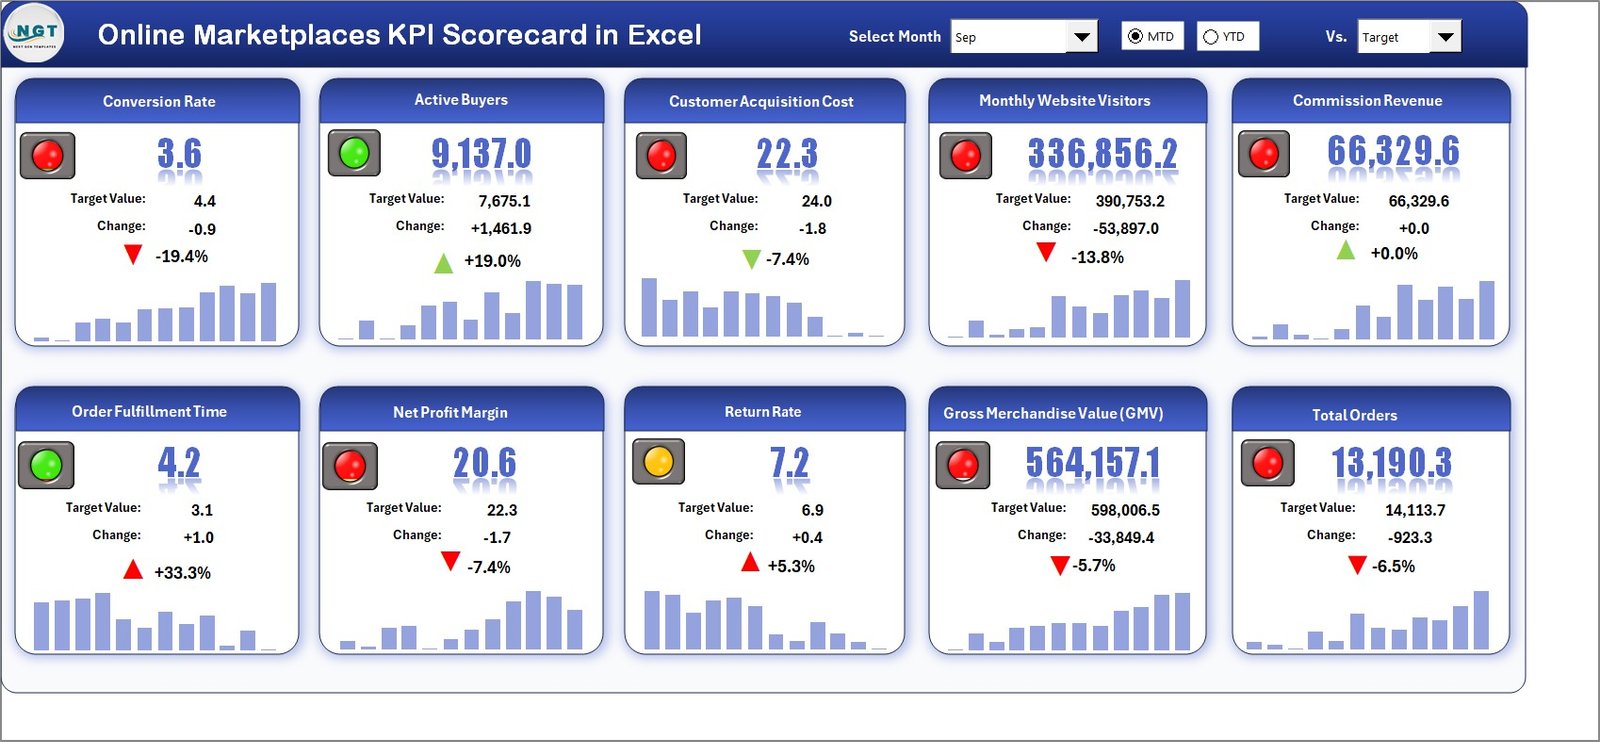
Scorecard Sheet – The Main Performance Dashboard
The Scorecard Sheet acts as the central interface of the KPI system. Users can instantly understand performance without analyzing raw data.
Main Features
- Dropdown Menus
- Select Month
- View MTD (Month-to-Date)
- View YTD (Year-to-Date)
Because of these selections, users can switch analysis instantly.
- Actual vs Target Comparison
- Displays performance against goals
- Highlights achievement gaps clearly
- Visual Indicators
- Color-coded signals show KPI status
- Conditional formatting improves readability
- Comprehensive KPI Overview
- Shows KPI group and performance together
- Displays MTD and YTD comparisons
- 10 KPIs in One View
- Managers get a quick performance snapshot
- Reduces reporting time significantly
As a result, leadership teams can evaluate performance within seconds.
Click to buy Online Marketplaces KPI Scorecard in Excel
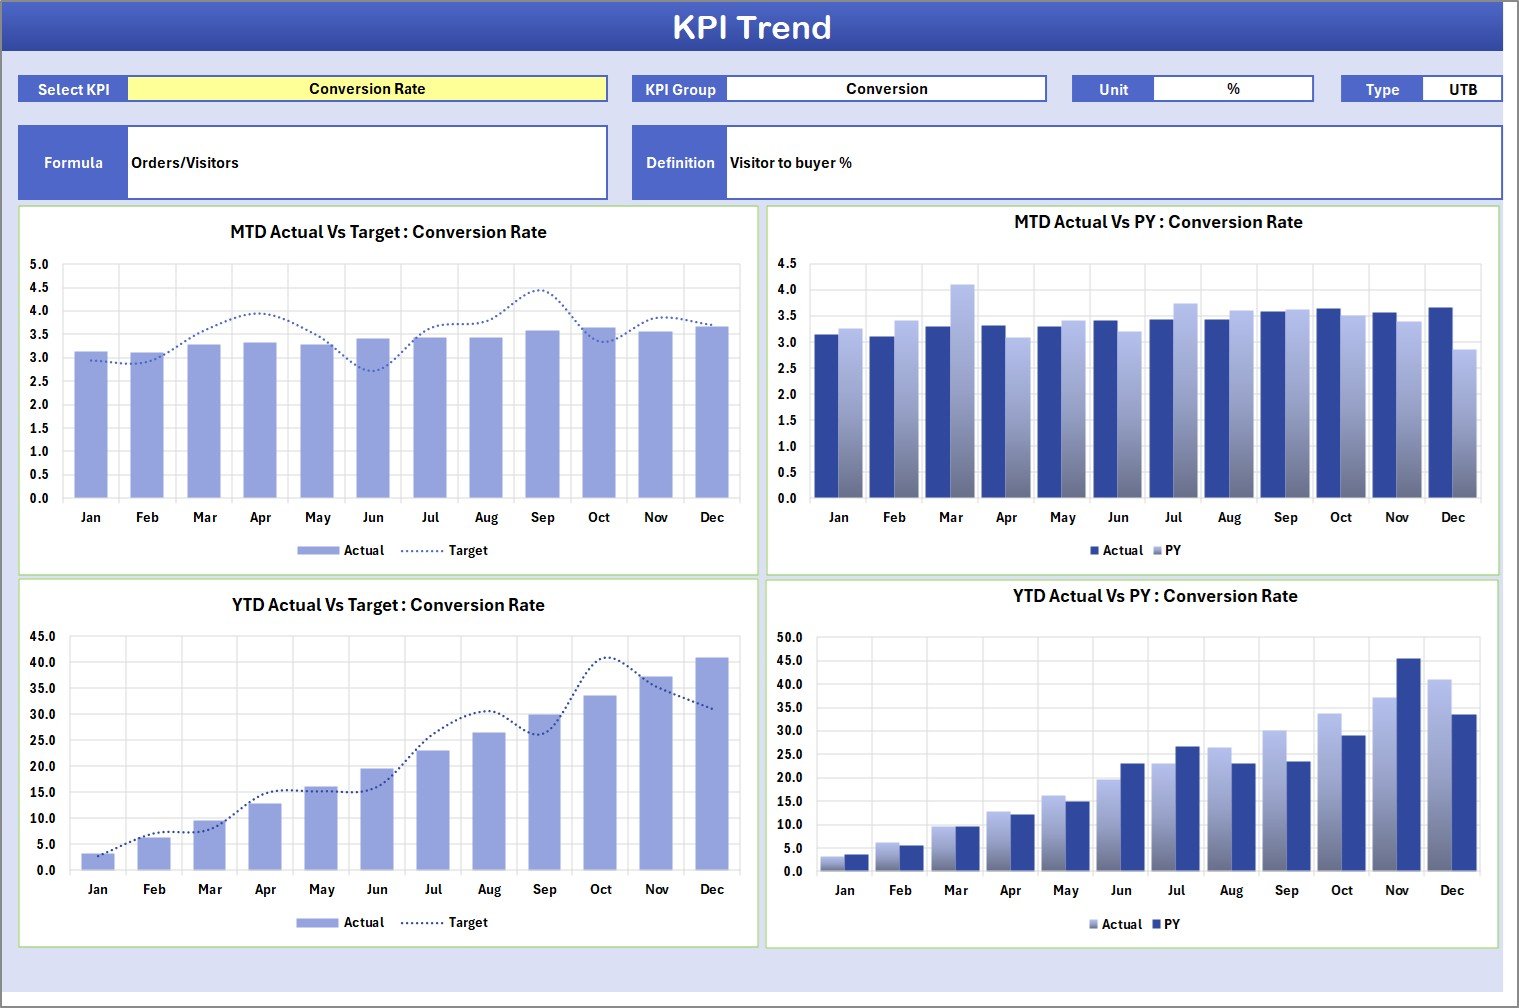
KPI Trend Sheet – Performance Trend Analysis
The KPI Trend Sheet helps users analyze KPI performance over time.
How It Works
Users select a KPI from the dropdown available in Cell C3. Immediately, the dashboard updates automatically.
Information Displayed
- KPI Group
- KPI Unit
- KPI Type (Lower the Better / Upper the Better)
- KPI Formula
- KPI Definition
Additionally, the sheet displays:
- MTD Trend Chart
- YTD Trend Chart
- Actual vs Target vs Previous Year comparison
Therefore, users can easily identify performance patterns and growth trends.
Click to buy Online Marketplaces KPI Scorecard in Excel
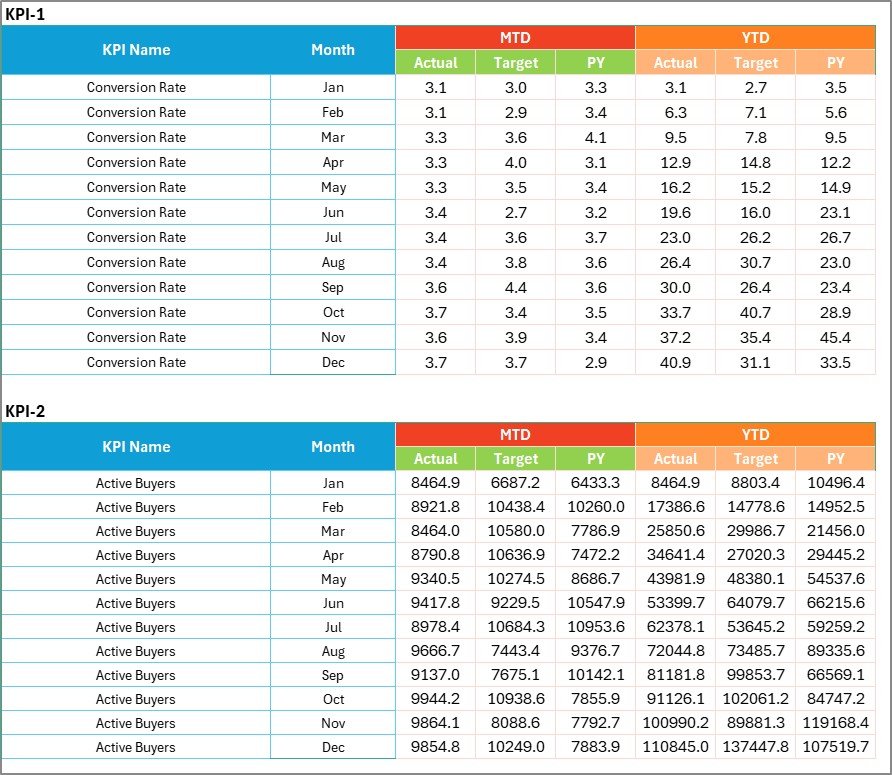
Input Data Sheet – Central Data Entry Area
The Input Data Sheet serves as the backbone of the scorecard.
Key Functions
- Record actual KPI values
- Enter targets
- Update monthly performance
- Maintain historical records
Because data entry remains simple and structured, teams can update results quickly.
Benefits
- Keeps the dashboard dynamic
- Eliminates manual recalculation
- Ensures real-time updates
Whenever new data becomes available, users only update this sheet, and the entire dashboard refreshes automatically.
Click to buy Online Marketplaces KPI Scorecard in Excel
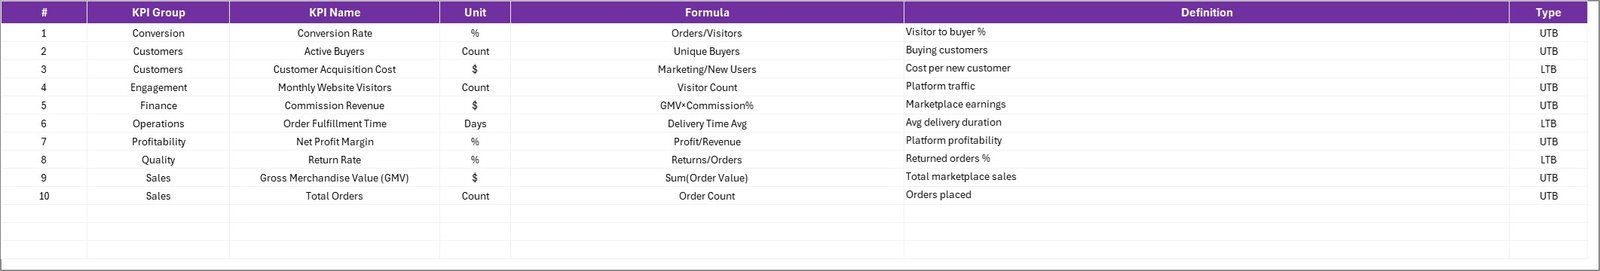
KPI Definition Sheet – KPI Documentation Hub
The KPI Definition Sheet stores all KPI-related information.
Users Enter:
- KPI Name
- KPI Group
- Unit
- Formula
- KPI Definition
This sheet ensures consistency across reporting. Moreover, new team members can easily understand KPI meanings without additional documentation.
Click to buy Online Marketplaces KPI Scorecard in Excel
What KPIs Can You Track in Online Marketplaces?
A strong KPI scorecard includes operational, financial, and customer-focused metrics.
Sales Performance KPIs
- Total Sales Revenue
- Orders Completed
- Average Order Value
- Conversion Rate
Operational KPIs
- Order Fulfillment Time
- Return Rate
- Inventory Availability
- Shipping Accuracy
Customer KPIs
- Customer Satisfaction Score
- Seller Rating
- Complaint Rate
- Repeat Purchase Rate
By combining these KPIs, businesses gain a complete performance view.
How Does the KPI Scorecard Improve Decision-Making?
A structured scorecard transforms data into actionable insights.
First, It Improves Visibility
Managers instantly see underperforming KPIs.
Next, It Enables Faster Actions
Teams quickly adjust pricing, inventory, or marketing strategies.
Finally, It Supports Strategic Planning
Historical trends help forecast future performance.
Consequently, organizations move from reactive management to proactive planning.
Advantages of Online Marketplaces KPI Scorecard in Excel
Using this KPI scorecard offers multiple operational and strategic benefits.
Centralized Performance Monitoring
- All KPIs appear in one dashboard.
- Reduces dependency on multiple reports.
Easy to Use
- No advanced technical skills required.
- Excel familiarity makes adoption simple.
Real-Time Insights
- Updates automatically after data entry.
- Provides instant performance visibility.
Cost-Effective Solution
- No subscription fees.
- No complex software installation.
Better Accountability
- Teams track targets clearly.
- Performance ownership improves.
Improved Strategic Planning
- Trend analysis supports forecasting.
- Leaders make confident decisions.
Who Can Benefit from This KPI Scorecard?
Many professionals can use this template effectively.
Marketplace Sellers
Track listing performance and sales efficiency.
E-commerce Managers
Monitor operations across multiple platforms.
Business Owners
Understand profitability trends quickly.
Operations Teams
Analyze fulfillment and logistics performance.
Marketing Teams
Evaluate campaign impact on conversions.
Thus, the scorecard supports cross-functional decision-making.
How to Use the Online Marketplaces KPI Scorecard in Excel?
Follow these simple steps to start using the template.
Step 1: Define KPIs
Enter KPI details in the KPI Definition sheet.
Step 2: Input Data
Add monthly actual values and targets.
Step 3: Select Reporting Period
Choose Month, MTD, or YTD from dropdown menus.
Step 4: Review Scorecard
Analyze performance indicators instantly.
Step 5: Study Trends
Use the KPI Trend sheet to evaluate performance over time.
Because the workflow remains simple, implementation takes only minutes.
Best Practices for the Online Marketplaces KPI Scorecard
To achieve maximum value, follow these best practices.
Select Meaningful KPIs
Focus on metrics that directly impact business goals.
Update Data Regularly
Enter data weekly or monthly to maintain accuracy.
Set Realistic Targets
Targets should challenge teams but remain achievable.
Review Trends Frequently
Analyze changes instead of only checking final numbers.
Maintain KPI Definitions
Keep formulas and explanations updated.
Use Visual Signals Wisely
Ensure colors represent performance clearly.
Train Team Members
Make sure everyone understands KPI interpretation.
By following these practices, organizations improve reporting quality significantly.
Therefore, structured scorecards solve most reporting challenges effectively.
Why Choose Excel for KPI Scorecards?
Although many analytics tools exist, Excel remains highly popular.
Reasons Excel Works Best
- Widely available software
- Flexible customization
- Easy sharing
- Powerful formulas
- Interactive charts
- No learning curve
Additionally, Excel allows businesses to scale gradually without heavy investment.
Future of KPI Tracking in Online Marketplaces
Marketplace analytics continues evolving rapidly. Businesses increasingly rely on data-driven strategies.
In the future, KPI scorecards will:
- Integrate automation tools
- Support predictive analytics
- Improve visualization techniques
- Enhance performance forecasting
However, Excel-based KPI scorecards will remain essential due to their flexibility and accessibility.
Conclusion
Online marketplaces demand continuous performance monitoring. Without structured KPI tracking, businesses struggle to understand growth opportunities and operational weaknesses.
The Online Marketplaces KPI Scorecard in Excel provides a simple yet powerful solution. It centralizes performance metrics, simplifies analysis, and enables faster decision-making.
Because the template includes Scorecard, KPI Trend, Input Data, and KPI Definition sheets, users gain a complete performance management system in one workbook.
Ultimately, organizations that track KPIs consistently achieve better efficiency, stronger customer satisfaction, and higher profitability.
If you want to transform marketplace data into actionable insights, implementing this KPI scorecard becomes a smart and practical step.
Frequently Asked Questions (FAQs)
- What is a KPI scorecard in online marketplaces?
A KPI scorecard is a structured dashboard that tracks key performance indicators such as sales, conversion rate, and operational efficiency.
- Can beginners use this Excel scorecard?
Yes. The template uses simple dropdowns and data entry fields, so beginners can use it easily.
- How often should KPI data be updated?
You should update data monthly or weekly depending on business operations.
- Can I customize KPIs?
Yes. You can modify KPI names, formulas, and definitions based on your marketplace needs.
- Does the scorecard support multiple marketplaces?
Yes. You can track combined performance from different platforms within one workbook.
- Why use Excel instead of analytics software?
Excel offers flexibility, affordability, and easy customization without subscription costs.
- What type of KPIs should online sellers track?
Sales, customer satisfaction, fulfillment performance, return rate, and conversion metrics are essential KPIs.
Click to buy Online Marketplaces KPI Scorecard in Excel
Visit our YouTube channel to learn step-by-step video tutorials
Watch the step-by-step video tutorial: