Running an optical retail business requires accurate data, quick decisions, and clear insights. However, many optical stores still try to track sales, customer behavior, and brand performance by using scattered spreadsheets. Because of this, they face delays, confusion, and reporting errors.
To solve these challenges, an Optical Retail Dashboard in Excel offers a ready-to-use and easy solution. It brings all important data into one interactive file so that store owners, branch managers, and analysts can make smarter decisions every day. In this detailed article, you will learn everything about the Optical Retail Dashboard in Excel, its features, pages, advantages, best practices, and much more.
Click to Purchases Optical Retail Dashboard in Excel
What Is an Optical Retail Dashboard in Excel?
An Optical Retail Dashboard in Excel is a smart, interactive Excel file that shows all important performance metrics for optical stores. It includes data about sales, products, brands, stores, customers, and monthly trends. It uses charts, slicers, and navigation buttons to make data simple and easy to understand.
Since it runs in Excel, anyone can use it without learning new software. Moreover, it allows full customization, which means every optical business can modify it based on their store size, product category, and operational needs.
Why Do Optical Retail Shops Need a Dashboard?
Optical shops deal with many moving parts: lenses, frames, sunglasses, accessories, brands, customer types, and product categories. Because of this, tracking everything manually becomes difficult.
An Excel-based dashboard solves the problem because it:
-
Brings all data into one file
-
Highlights important KPIs
-
Shows clean charts for faster decisions
-
Improves accuracy and reduces manual work
-
Supports planning, forecasting, and performance analysis
When store managers get real-time insights, they improve efficiency, increase sales, reduce wastage, and understand customers better.
Click to Purchases Optical Retail Dashboard in Excel
Key Features of the Optical Retail Dashboard in Excel
This dashboard comes with many powerful features that help optical retailers analyze data in the simplest way possible.
✔ Page Navigator on the Left Side
A smart page navigator lets you jump to any page instantly. Because of this, you never waste time searching for sheets.
✔ Five Dedicated Analysis Pages
The dashboard includes five powerful analysis sections:
-
Overview Page
-
Store Name Analysis
-
Product Category Analysis
-
Brand Name Analysis
-
Monthly Trends
You also get a Support Sheet and a Data Sheet where you can enter or import your raw data.
Click to Purchases Optical Retail Dashboard in Excel
What Does Each Page Show? – Page-by-Page Breakdown
Let us explore the details of all five pages in the Optical Retail Dashboard.
1. Overview Page – What Insights Does It Provide?

The Overview Page gives a complete snapshot of business performance. It shows key charts, cards, and KPIs that help you understand:
-
Overall sales
-
Cost structure
-
Satisfaction levels
-
Profit performance
This page displays four major charts:
1️⃣ Net Sales by City
You quickly understand which cities bring maximum revenue. This also helps you plan marketing and stock strategies.
2️⃣ Total Cost by Customer Type
You identify which customer groups demand more cost. This helps you optimize pricing and service strategies.
3️⃣ Average Satisfaction Rate by Lens Type
Customer satisfaction plays a major role in optical retail. This chart shows satisfaction levels for different lens types.
4️⃣ Profit by Zone
You can track which zones perform well and which zones need improvement.
Because of these insights, managers take decisions faster and improve business performance.
Click to Purchases Optical Retail Dashboard in Excel
2. Store Name Analysis – Why Is Store-Level Tracking Important?
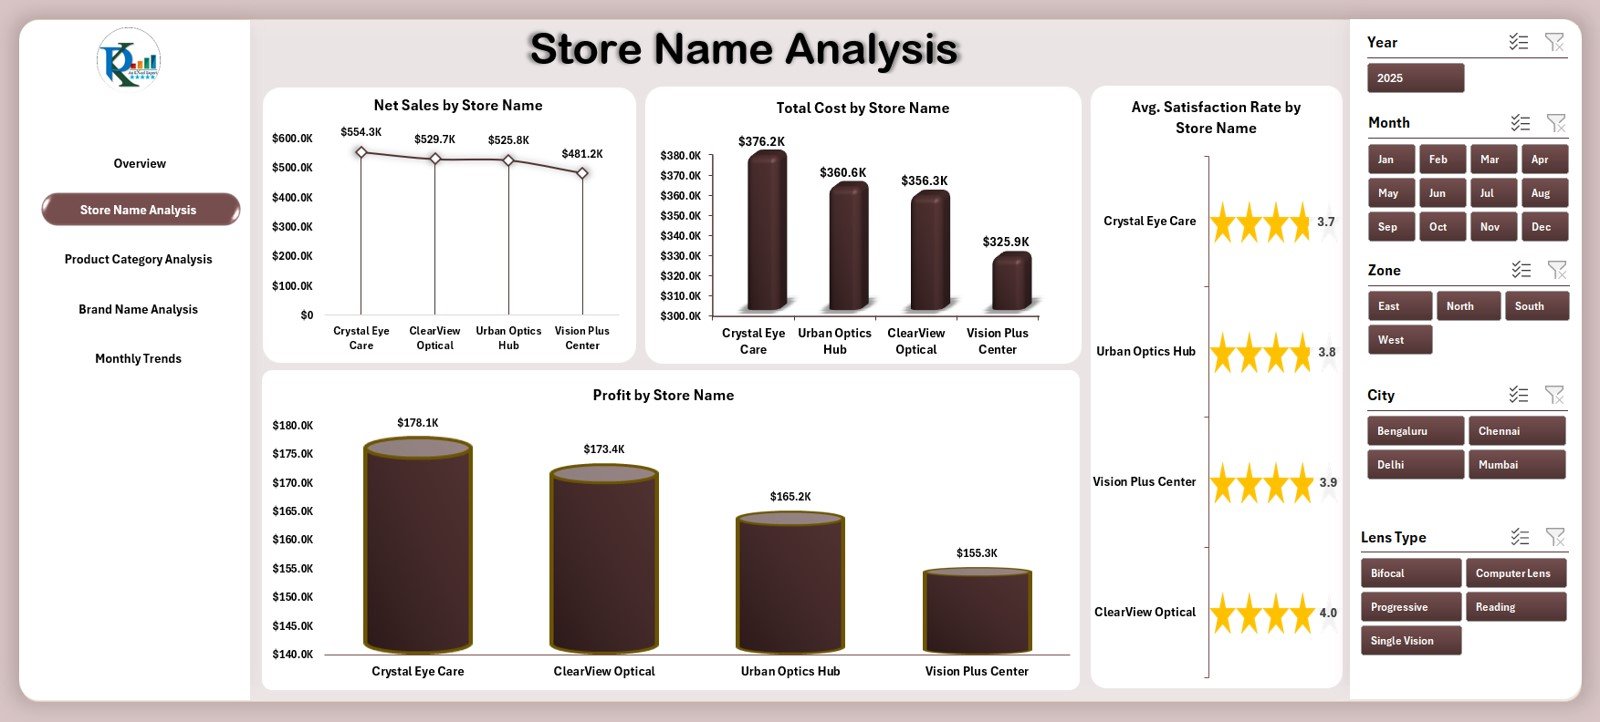
Every optical store performs differently. Therefore, store-level performance must stay visible at all times.
This page includes four important charts:
1️⃣ Net Sales by Store Name
You can compare revenue across all branches.
2️⃣ Total Cost by Store Name
You identify stores that spend more than required.
3️⃣ Average Satisfaction Rate by Store Name
You see how each store handles customer service.
4️⃣ Profit by Store Name
You understand store-level profitability instantly.
Because this page compares stores effectively, it helps owners take decisions regarding staffing, stock levels, and promotions.
3. Product Category Analysis – What Do Customers Prefer?
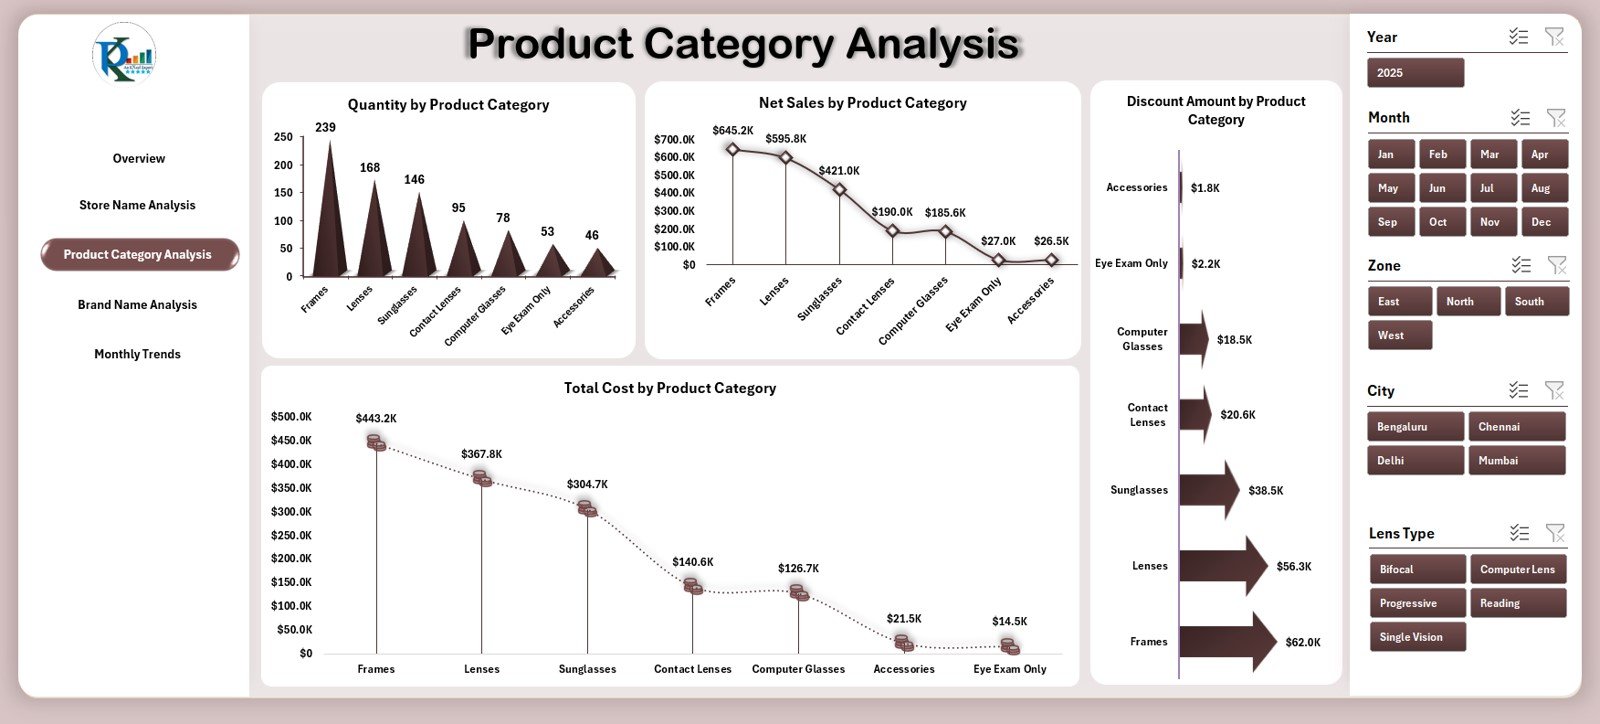
Product categories play a major role in optical retail. Frames, lenses, sunglasses, accessories, contact lenses, and other categories show different sales patterns.
This page includes four useful charts:
1️⃣ Quantity by Product Category
You understand which product category sells more units.
2️⃣ Net Sales by Product Category
This chart shows revenue contribution by each category.
3️⃣ Discount Amount by Product Category
You identify categories where heavy discounts happen often.
4️⃣ Total Cost by Product Category
You can track production, procurement, or purchase cost easily.
Since this page highlights category-level trends, you make better stocking, pricing, and promotion decisions.
Click to Purchases Optical Retail Dashboard in Excel
4. Brand Name Analysis – Which Brands Perform Better?
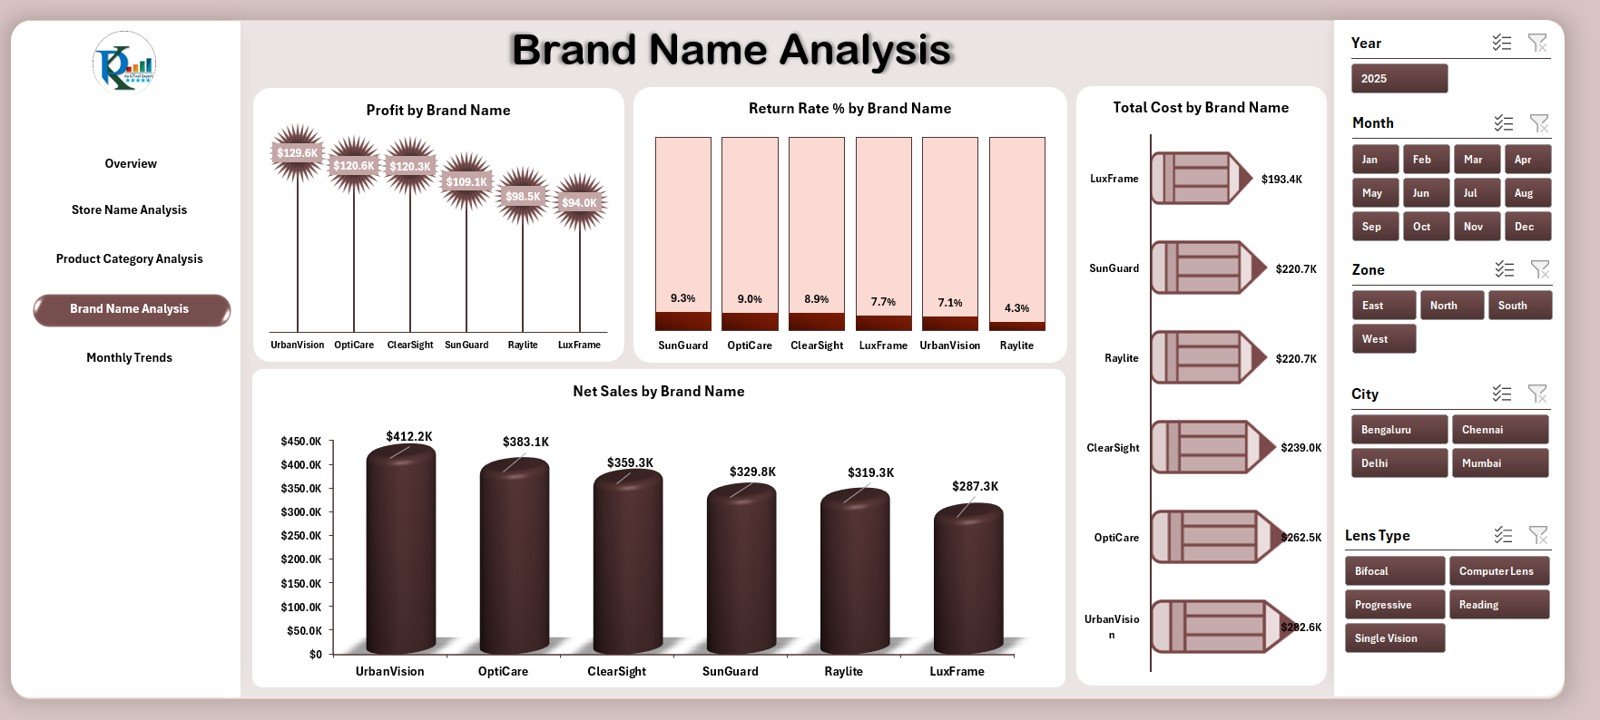
Optical stores sell multiple brands, and each brand behaves differently in the market. Because of this, brand-level tracking becomes essential.
This page includes four important charts:
1️⃣ Profit by Brand Name
Find out which brands generate maximum profit.
2️⃣ Return Rate % by Brand Name
Track how often customers return products for each brand.
3️⃣ Total Cost by Brand Name
See which brands come with higher costs.
4️⃣ Net Sales by Brand Name
Understand the sales contribution of every brand.
This section helps optical store owners decide which brands to promote, stock more frequently, or discontinue.
5. Monthly Trends – How Does Performance Change Every Month?

Monthly data offers the clearest view of business growth. Because of this, the dashboard includes powerful monthly trend charts:
1️⃣ Discount Amount by Month
Shows discount trends across months.
2️⃣ Profit by Month
Tracks monthly profitability clearly.
3️⃣ Gross Amount by Month
Shows total monthly revenue before discount.
4️⃣ Profit Margin % by Month
Helps you track margin improvement over time.
You get a clear view of seasonal trends, peak months, and low-performance periods.
Support Sheet and Data Sheet
Support Sheet
Includes lookup values, dropdown lists, categories, and calculations that help the dashboard run smoothly.
Data Sheet
This is the main sheet where you enter all raw data such as:
-
Sales
-
Quantity
-
Store name
-
Product category
-
Brand
-
Customer type
-
Satisfaction rate
-
Return rate
-
Cost and profit values
Once you paste the data, the entire dashboard updates instantly.
Click to Purchases Optical Retail Dashboard in Excel
Advantages of the Optical Retail Dashboard in Excel
A dashboard becomes useful only when it increases clarity and supports decision-making. The Optical Retail Dashboard offers many advantages, such as:
✔ Better Sales Tracking
You track sales across cities, stores, brands, and categories.
✔ Improved Customer Insights
You understand satisfaction trends and customer behavior.
✔ Clear Store-Level Performance
You compare store performance and take decisions immediately.
✔ Strong Inventory Planning
Sales and cost insights help you stock better.
✔ Fast Decision-Making
Slicers and charts make data easy to read and understand.
✔ 100% Customizable
Since it runs in Excel, every retailer can modify it easily.
✔ No Need for Extra Software
You manage everything inside one Excel file.
Opportunities for Improvement in an Optical Retail Dashboard
Although the dashboard offers many benefits, you can still improve it further. Here are some opportunities:
⭐ Add Forecasting Models
Include formulas to estimate future sales.
⭐ Add Stock Level Tracking
Track inventory shortages and reorder alerts.
⭐ Include Customer Loyalty Analysis
Analyze repeat customers and membership programs.
⭐ Add a Marketing Performance Section
Track the success of promotions and campaigns.
⭐ Expand Brand Performance KPIs
Include product-level brand analysis for deeper insights.
Click to Purchases Optical Retail Dashboard in Excel
Best Practices for Using the Optical Retail Dashboard in Excel
To get maximum value, follow these best practices:
1️⃣ Update Data Regularly
Update data daily or weekly for accurate insights.
2️⃣ Use Clean and Consistent Data
Maintain consistent spelling, product names, and store codes.
3️⃣ Remove Duplicate Records
Duplicates affect sales, cost, and profit calculations.
4️⃣ Review Dashboard Charts Frequently
Check charts to track trends and take corrective action.
5️⃣ Secure the File with Passwords
Protect formulas and sheets to maintain accuracy.
6️⃣ Customize the Dashboard Based on Your Needs
Add new KPIs, change colors, or modify formulas whenever needed.
7️⃣ Train Your Team
Teach your staff how to use slicers, filters, and pages.
Conclusion
The Optical Retail Dashboard in Excel is a complete solution for optical businesses that want to improve decision-making using clear and structured data. It provides insights at every level—store, city, product category, brand, and month. It helps teams increase sales, manage costs, understand customer satisfaction, and plan better strategies.
Because of its easy interface, ready-to-use pages, and powerful charts, this dashboard becomes one of the best tools for optical retailers who want to grow faster.
Click to Purchases Optical Retail Dashboard in Excel
Frequently Asked Questions (FAQs)
1. What is an Optical Retail Dashboard in Excel?
It is an interactive Excel file that tracks sales, costs, profits, brand performance, and customer satisfaction for optical stores.
2. Who should use this dashboard?
Store owners, managers, analysts, franchise heads, and anyone involved in decision-making for optical retail.
3. Do I need advanced Excel skills to use this dashboard?
No. The dashboard includes a simple interface and ready-to-use slicers.
4. Can I customize the dashboard?
Yes. You can modify charts, formulas, colors, and structure based on your business needs.
5. How often should I update the data?
Daily or weekly updates give the best results.
6. Does the dashboard track brand performance?
Yes. It includes charts for profit, sales, cost, and return rate for each brand.
7. Is this dashboard suitable for multiple stores?
Yes. It includes store-level analysis, making it ideal for single or multi-store optical retailers.
Click to Purchases Optical Retail Dashboard in Excel
Visit our YouTube channel to learn step-by-step video tutorials
Watch the step-by-step video tutorial: