The outsourcing industry grows every year because companies want to save time, reduce costs, and improve efficiency. Business Process Outsourcing (BPO) and Knowledge Process Outsourcing (KPO) help organizations handle customer support, back-office tasks, finance operations, analytics, and many other services. These operations generate a huge amount of data every day. When teams try to review this data manually, they feel confused and make slow decisions.
An Outsourcing (BPO KPO) Dashboard in Power BI solves this problem. It collects raw data from Excel, CRM tools, ticketing systems, or operational logs and converts it into clean, interactive visuals. Managers see everything in one place—cost, revenue, profit, customer satisfaction, employee workload, escalations, process performance, and trends. Because the dashboard shows real-time insights, leaders take confident and quick decisions.
This article explains every part of the Outsourcing (BPO KPO) Dashboard in Power BI. You will learn how it works, what it includes, the advantages, and the best practices. Finally, you will also find helpful FAQs at the end.
Click to Purchases Outsourcing (BPO KPO) Dashboard in Power BI
Why Do BPO and KPO Companies Need a Power BI Dashboard?
BPO and KPO companies work in a fast environment. They handle thousands of calls, emails, chats, tasks, or analytics projects daily. Managers need complete visibility so they can maintain performance and avoid service-level issues.
A Power BI dashboard provides that visibility. It gives a clear picture of every department, process, team, and client. Decision-makers no longer depend on manual reports or unorganized spreadsheets.
With a dashboard, teams track:
-
Cost and revenue performance
-
Customer satisfaction
-
Process efficiency
-
Profit by client, team, or project
-
Escalation count
-
Monthly trends
-
Department-wise results
-
Resource productivity
Because all data stays connected, the dashboard becomes a single source of truth for the entire outsourcing business.
How Does an Outsourcing (BPO KPO) Dashboard in Power BI Work?
The dashboard uses a structured Excel file or database as a data source. Power BI then converts this data into cards, charts, slicers, trend visuals, KPI scorecards, and interactive drill-downs. Managers filter information by team, client, month, location, department, process type, and many other elements.
The dashboard contains five powerful pages, each designed to give a different type of insight:
1. Overview Page: What Do You See on the Main Dashboard?
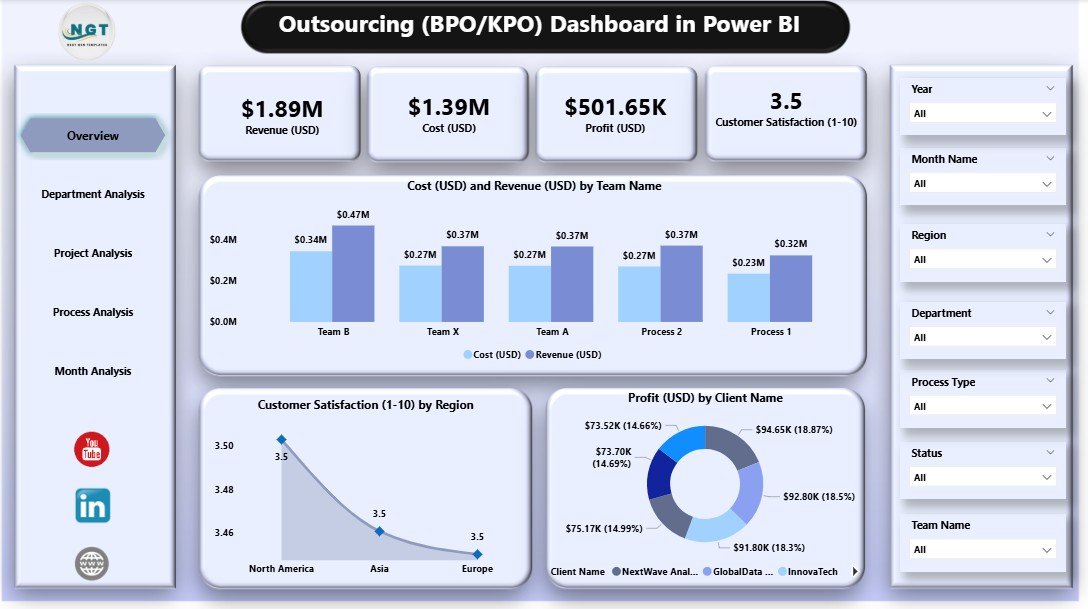
The Overview Page acts as the home screen for the entire dashboard. Decision-makers use this page to get a quick summary of business performance.
Main Highlights
-
Interactive slicers for teams, departments, clients, process types, and months
-
Four KPI cards showing:
-
Total Cost
-
Total Revenue
-
Total Profit
-
Customer Satisfaction Score
-
-
Three essential charts:
-
Cost (USD) and Revenue (USD) by Team Name
-
Customer Satisfaction by Region
-
Profit (USD) by Client Name
-
Why This Page Matters
This page shows the overall health of the operation. Managers see where money comes from, which teams drive performance, and how customers feel about services. Because they can filter data instantly, they find issues without going through multiple reports.
Click to Purchases Outsourcing (BPO KPO) Dashboard in Power BI
2. Department Analysis: How Do Departments Perform?
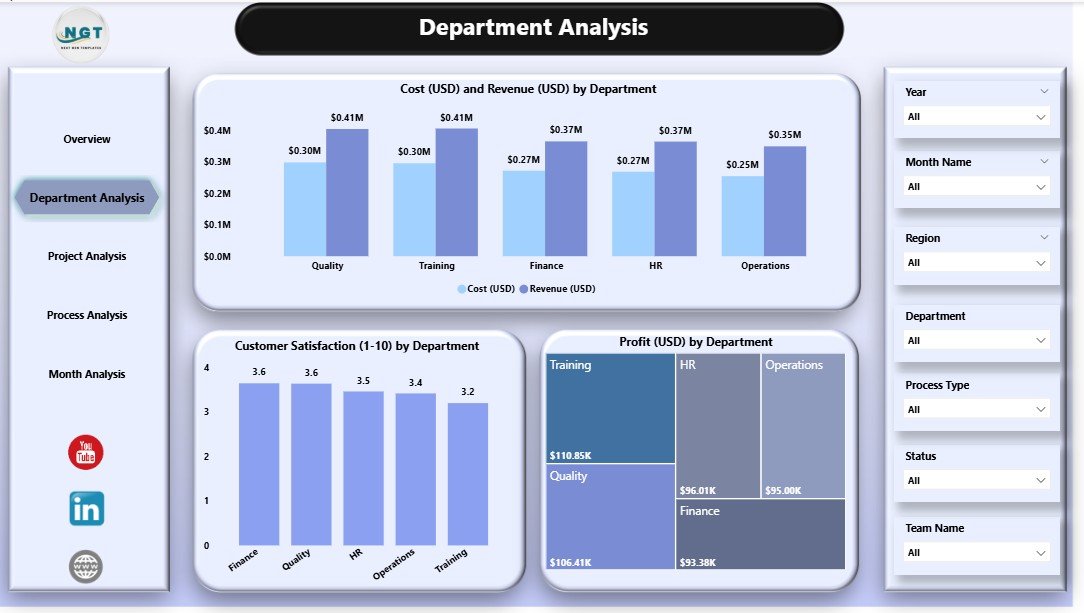
The Department Analysis page provides a deep look at department-wise performance. Companies use this page to compare different functions like Customer Support, Finance Operations, IT Support, Research Analysis, Data Processing, and more.
Key Elements
-
Slicers to switch department views
-
Three department-focused charts:
-
Cost (USD) and Revenue (USD) by Department
-
Customer Satisfaction by Department
-
Profit (USD) by Department
-
Why This Page Matters
Departments contribute differently to cost, revenue, and satisfaction. This view helps leaders find which teams perform well and which teams require improvement. Managers also identify departments that need training, resources, or process changes.
3. Product Analysis: Which Projects or Services Perform the Best?
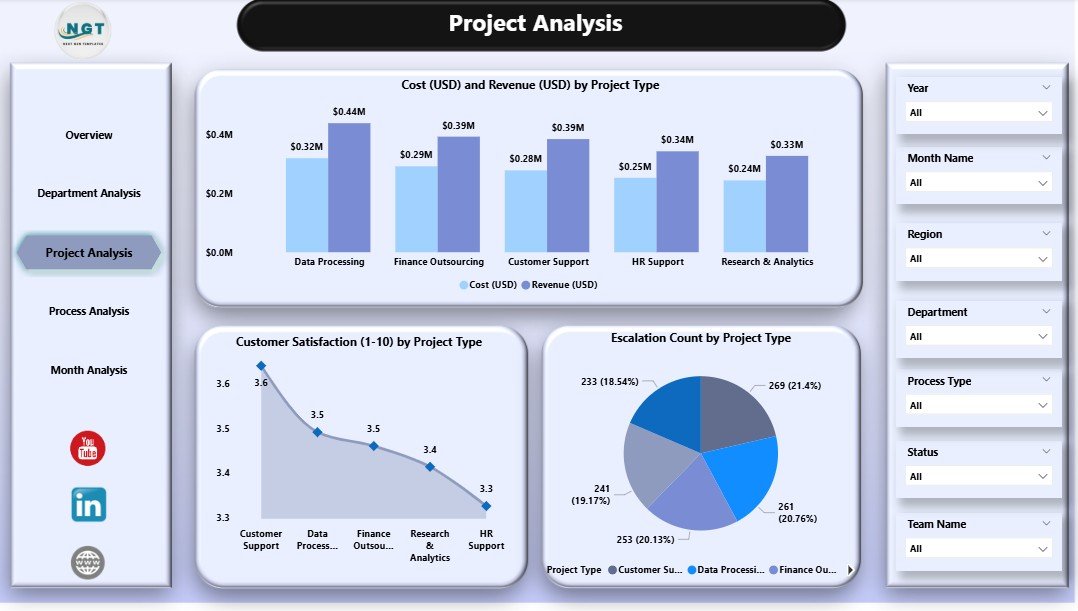
Every outsourcing company handles multiple project types. These may include call center processes, back-office tasks, research projects, accounting tasks, analytics services, and more. Each project type has different cost structures, complexity levels, and customer expectations.
The Product Analysis page helps teams understand performance based on project type.
Charts on This Page
-
Cost (USD) and Revenue (USD) by Project Type
-
Customer Satisfaction by Project Type
-
Escalation Count by Project Type
Why This Page Matters
This page helps companies understand which project types create the most value. If a project type has low profit or high escalations, managers take immediate action. If a project type performs well, companies use this insight to expand those services.
4. Process Analysis: How Efficient Are Operational Processes?
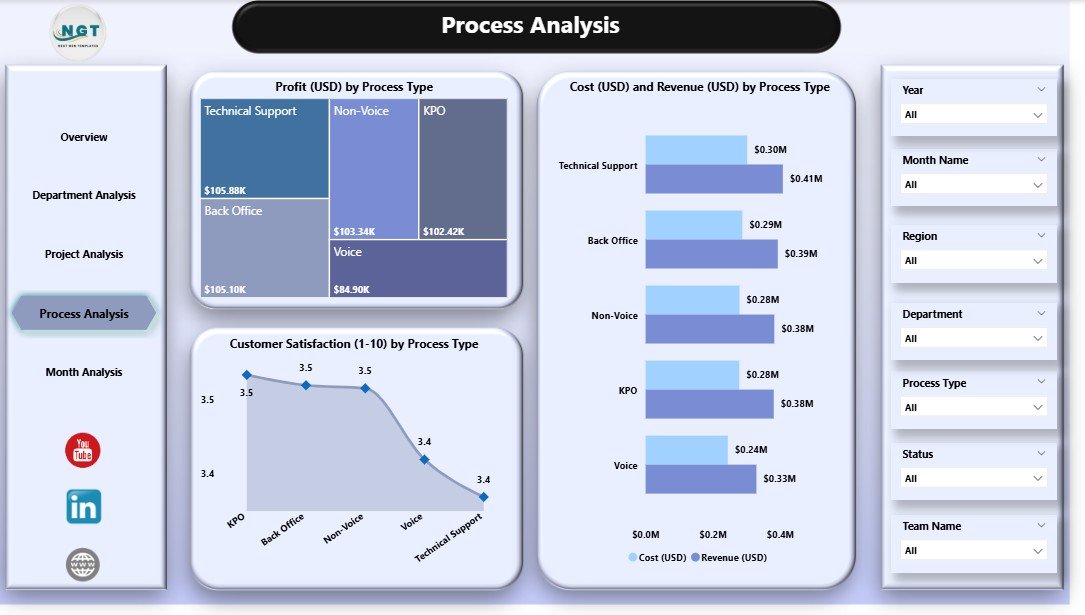
Every BPO and KPO operation depends on strong processes. Even one weak process can slow down performance or increase cost. The Process Analysis page focuses on process-level insights that help identify improvement areas.
What This Page Includes
-
Cost (USD) and Revenue (USD) by Process Type
-
Customer Satisfaction by Process Type
-
Profit (USD) by Process Type
Why This Page Matters
This page helps teams monitor process-level output. When customer satisfaction drops for one process, leaders know where to focus. When profit increases for another process, they analyze the factors behind it. This page helps maintain smooth and efficient operations.
5. Monthly Trends: How Does Performance Change Over Time?
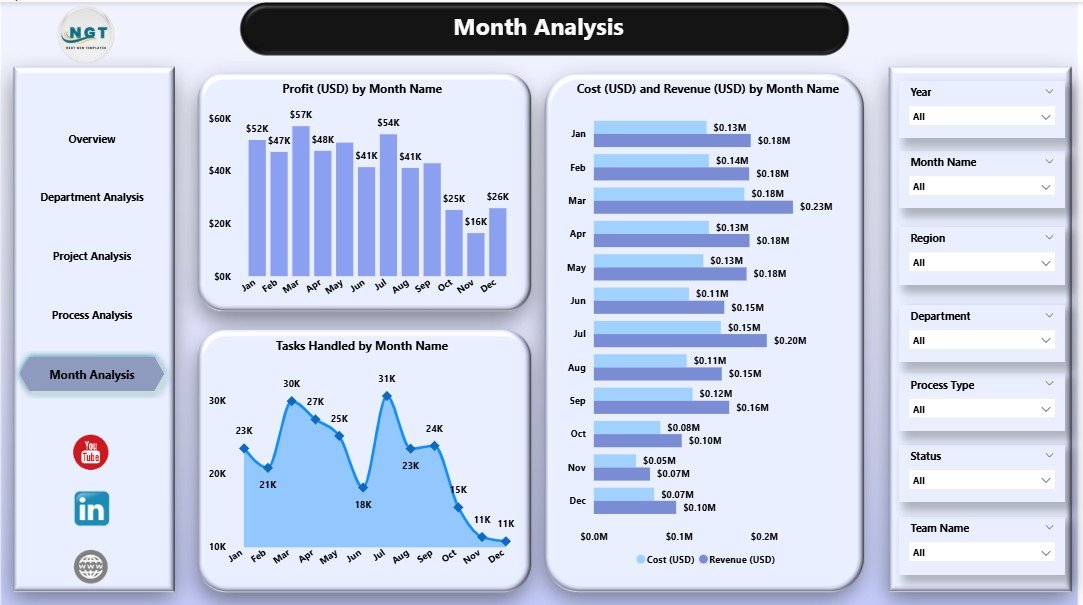
The final page is the Monthly Trends section. It shows how performance changes month by month and helps leaders predict future business patterns.
Charts Included
-
Cost (USD) and Revenue (USD) by Month
-
Profit (USD) by Month
-
Tasks Handled by Month
Why This Page Matters
Monthly trends help identify growth opportunities, seasonal changes, workload patterns, and revenue cycles. When managers track trends, they plan staffing, training, budgeting, and strategic decisions more effectively.
Advantages of an Outsourcing (BPO KPO) Dashboard in Power BI
Click to Purchases Outsourcing (BPO KPO) Dashboard in Power BI
A Power BI dashboard gives several benefits that directly improve business performance. Here are the top advantages:
1. Quick and Accurate Decision-Making
The dashboard shows real-time insights, so leaders take faster decisions. They do not search through multiple reports or wait for manual updates.
2. Complete Visibility Across Teams
Managers see cost, revenue, satisfaction, escalations, and workload in one place. This visibility helps them understand how each team or process performs.
3. Improved Customer Satisfaction
Customer satisfaction scores show the quality of service. Teams fix problems early when they track these scores.
4. Increased Profitability
Profit charts show which clients, departments, and processes create the most profit. Leaders use this data to focus on high-performing areas.
5. Better Resource Allocation
Managers plan staffing and training based on real data. They assign resources to the right projects at the right time.
6. Stronger Client Reporting
Power BI visuals make reporting simple and professional. Companies use these dashboards during client reviews and performance meetings.
7. Reduced Manual Reporting Work
The dashboard updates automatically. Teams save hours wasted on manual Excel reports.
8. Clear Trend Analysis
Monthly trends help leaders manage budgets, forecast workload, and prepare for upcoming challenges.
Best Practices for Using an Outsourcing (BPO KPO) Dashboard in Power BI
To get the most value from your dashboard, follow these best practices:
1. Keep Your Data Clean
Remove duplicates, incorrect values, and missing information. Clean data ensures accurate insights.
2. Refresh Data Regularly
Schedule automatic refreshes so managers see updated numbers anytime.
3. Use Slicers Smartly
Add slicers for department, month, client, process type, and region to make analysis easy.
4. Focus on Important KPIs
Do not overload the dashboard. Track only the KPIs that matter—cost, revenue, satisfaction, escalations, profit, and workload.
5. Maintain Consistent Formats
Use consistent color codes, labels, and chart styles across all pages.
6. Review Trends Monthly
Use the Monthly Trends page to understand performance changes and make proactive decisions.
7. Train Your Team
Train all users so they understand how to use the dashboard and extract insights correctly.
8. Use Comments and Notes
Add short descriptions, definitions, or tips to help new users understand the visuals.
Conclusion
An Outsourcing (BPO KPO) Dashboard in Power BI gives companies complete control over their operations. It helps managers understand cost, revenue, profit, satisfaction, workload, and performance at every level—team, department, project type, process type, and monthly trends. With this dashboard, leaders take smarter decisions, improve customer satisfaction, and grow profitability.
Because the dashboard uses simple visuals and slicers, even non-technical users understand the insights clearly. Whether you run a call center, data processing unit, analytics team, or research center, this dashboard becomes your most important management tool.
Frequently Asked Questions (FAQs)
1. What is an Outsourcing (BPO KPO) Dashboard in Power BI?
It is an interactive dashboard that shows cost, revenue, profit, customer satisfaction, escalation count, and performance data for outsourcing teams.
2. Who should use this dashboard?
Managers, team leads, operations heads, client managers, HR leaders, finance teams, and business owners use this dashboard to monitor performance.
3. What data sources can be used?
You can use Excel, databases, CRM tools, call center logs, HR systems, and ticketing systems.
4. Can I customize the dashboard?
Yes. You can add new KPIs, change visuals, modify filters, and use your own color theme.
5. Does the dashboard work for both BPO and KPO companies?
Yes. It works for all outsourcing models including customer service, finance operations, analytics, research, IT support, and back-office tasks.
6. How often should the dashboard data be refreshed?
Daily refresh works for most operations. High-volume teams may choose hourly refresh.
7. Does this dashboard help during client meetings?
Yes. Managers use it to present performance reports, monthly reviews, audit summaries, and SLA updates.
8. Can new users understand the dashboard easily?
Yes. The dashboard uses simple visuals, slicers, and clear labels. Even non-technical users navigate it easily.
Visit our YouTube channel to learn step-by-step video tutorials