Payroll is one of the most critical functions in any organization. It’s not just about paying employees—it’s about ensuring accuracy, compliance, and efficiency. Payroll errors, delays, or miscalculations can cause employee dissatisfaction, legal issues, and financial losses. That’s why tracking payroll performance through Key Performance Indicators (KPIs) is essential.
To simplify this process, the Payroll Management KPI Dashboard in Excel provides a structured, automated, and easy-to-use solution. It helps HR and finance professionals analyze payroll data, monitor KPIs, and make informed decisions—all within Microsoft Excel.
This article explores the structure, features, advantages, and best practices of this ready-to-use Excel dashboard designed for efficient payroll performance tracking.
Click to Purchases Payroll Management KPI Dashboard in Excel
📊 What Is a Payroll Management KPI Dashboard in Excel?
A Payroll Management KPI Dashboard is an interactive Excel-based tool that helps businesses monitor and evaluate payroll processes. It consolidates data related to payroll accuracy, timeliness, compliance, cost management, and employee satisfaction into one visual platform.
Instead of manually compiling reports or managing multiple files, this dashboard offers a centralized view of payroll performance, enabling quick insights into key metrics such as total payroll costs, average processing time, compliance rate, and error percentage.
With built-in automation, conditional formatting, and drop-down selections, users can easily switch between months, view trends, and analyze performance both month-to-date (MTD) and year-to-date (YTD).
🧩 Structure of the Payroll Management KPI Dashboard
The Payroll Management KPI Dashboard in Excel is designed with seven interlinked worksheets, each performing a unique function. Let’s explore them one by one.
1️⃣ Home Sheet – The Command Center
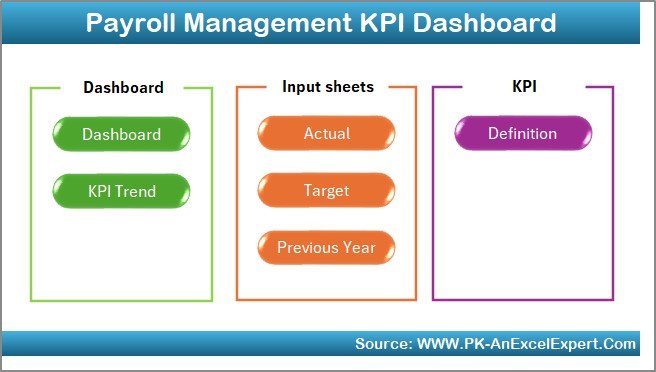
The Home Sheet acts as the navigation hub of the workbook.
It includes six interactive buttons that allow users to jump directly to different worksheets—like Dashboard, KPI Trend, Actuals, Targets, and KPI Definition—making navigation seamless.
This page gives users a clear entry point, ensuring anyone using the file for the first time can easily understand its flow.
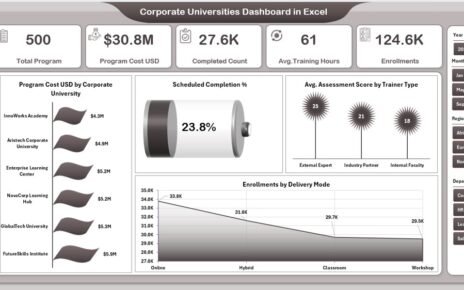
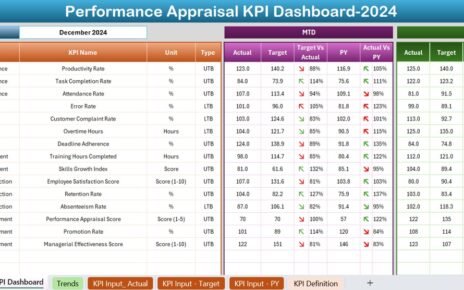
2️⃣ Dashboard Sheet – The Heart of Payroll Analytics
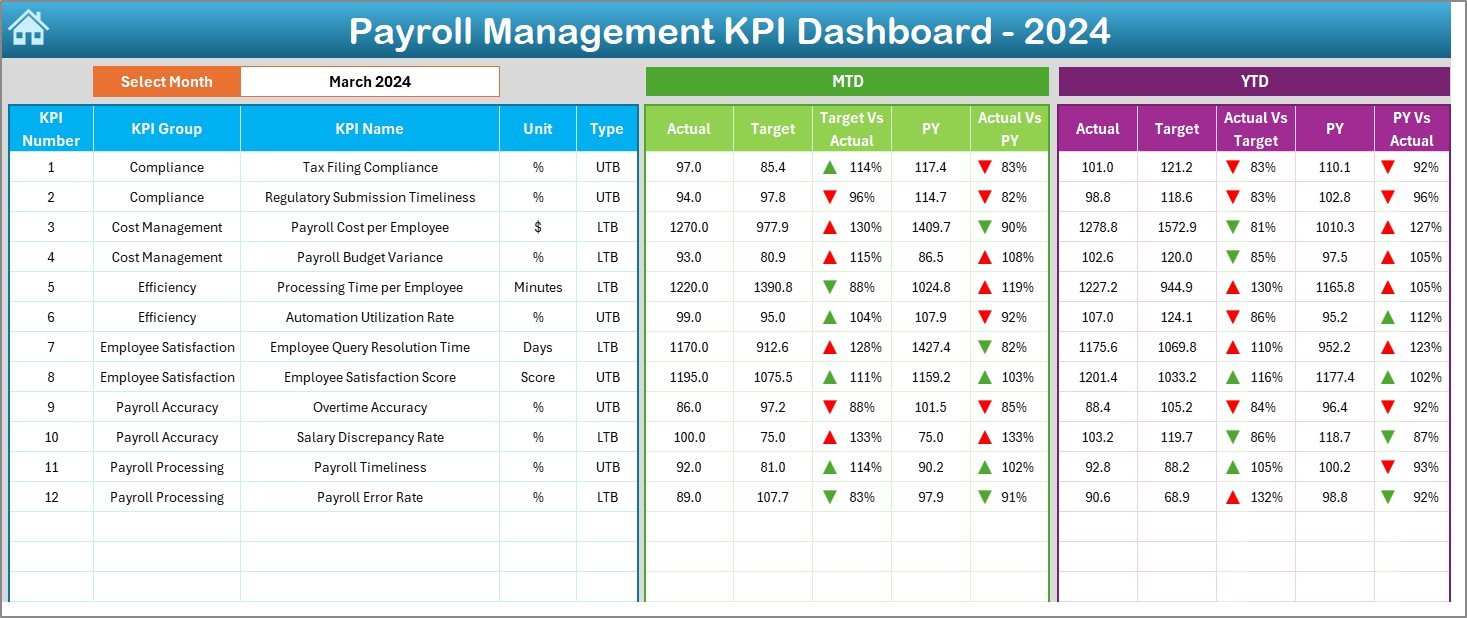
This is the main analytical page of the workbook and the most visual one.
Key Highlights:
-
🗓️ A drop-down (cell D3) allows users to select any month.
-
🔄 The entire dashboard automatically updates to reflect data for that specific month.
-
📊 Displays both MTD (Month-to-Date) and YTD (Year-to-Date) results.
-
🎯 Compares Actual vs Target values and Previous Year vs Current Year performance.
-
📈 Uses conditional formatting (up/down arrows) to indicate trends and target achievement visually.
This page gives a quick summary of payroll health—whether the process is running efficiently or requires attention.
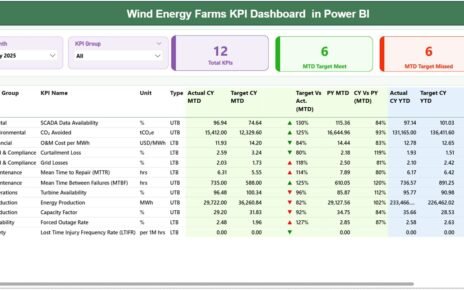
3️⃣ KPI Trend Sheet – In-Depth Performance Analysis
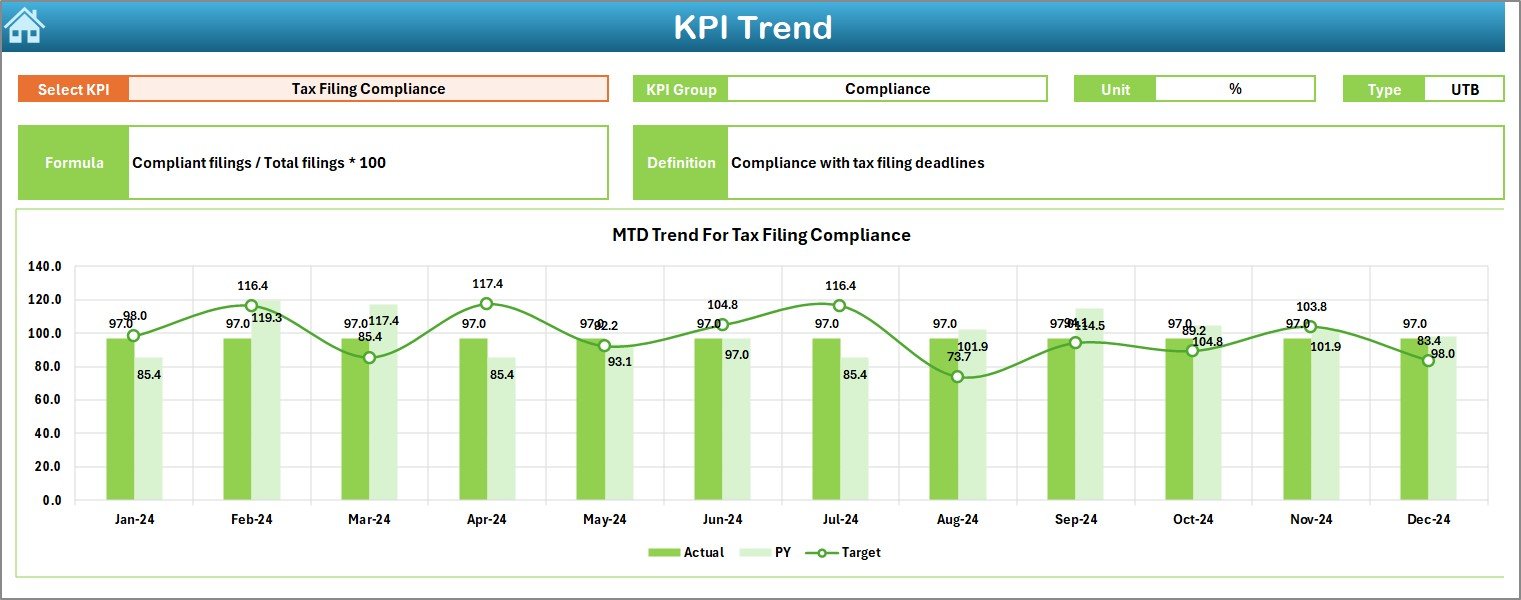
The KPI Trend Sheet provides a detailed view of how individual payroll KPIs perform over time.
Features include:
-
🎯 KPI Selection Dropdown (cell C3): Choose the specific KPI you want to review.
-
📖 Displays KPI details such as Group, Unit, Formula, and Type (UTB or LTB).
-
📉 Trend Charts: Show Actual, Target, and Previous Year data for MTD and YTD.
This tab helps HR and finance leaders monitor the long-term progress of payroll efficiency, identify performance fluctuations, and anticipate issues before they escalate.
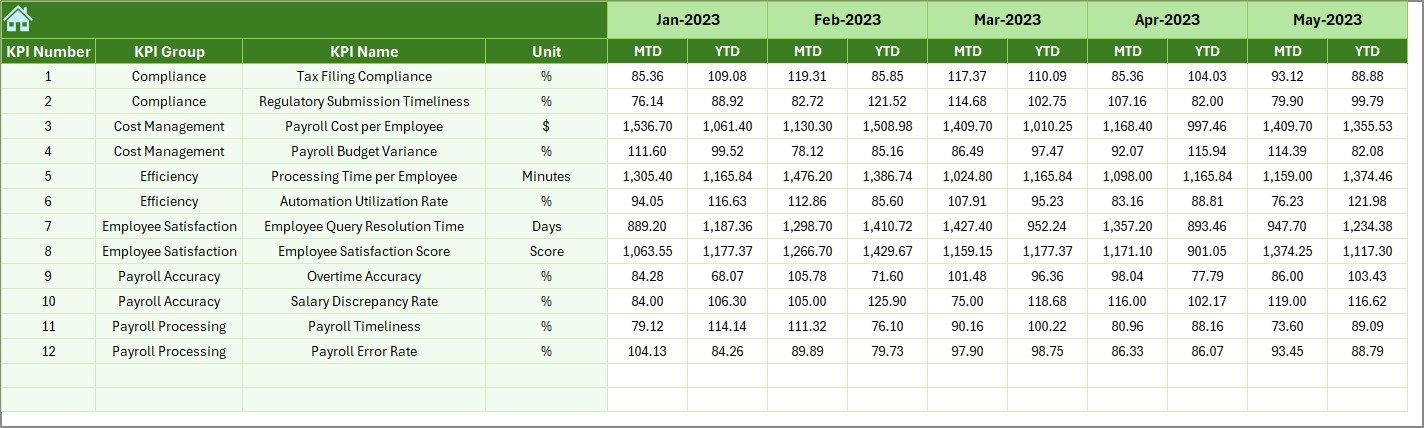
4️⃣ Actual Numbers Input Sheet – Data Entry Simplified
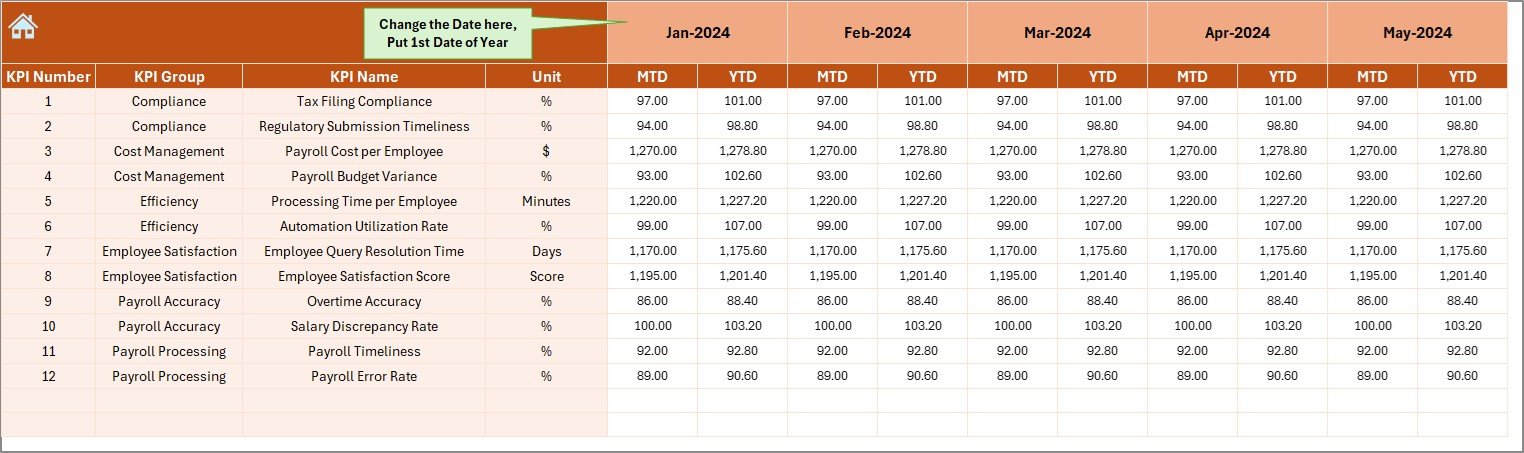
This sheet is where the actual data for KPIs is entered.
Key Points:
-
📆 Define the first month of the fiscal year in cell E1.
-
✍️ Input MTD and YTD actual figures for each KPI.
-
⚙️ Data automatically connects with dashboard visuals and charts.
This sheet ensures that all the performance calculations and visuals remain accurate as fresh data is added monthly.
5️⃣ Target Sheet – Define Your Goals
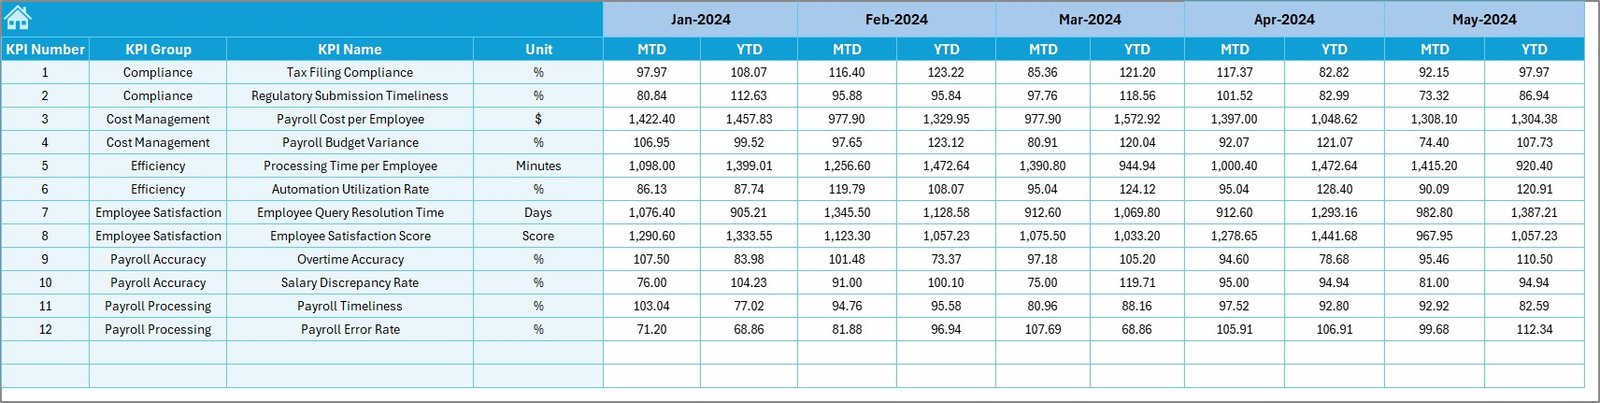
Every organization needs payroll benchmarks, and that’s exactly what this sheet provides.
What You Can Do:
-
Set monthly targets for each KPI, both for MTD and YTD metrics.
-
Align targets with business objectives and compliance standards.
Having predefined goals helps you evaluate whether payroll operations are meeting expectations consistently.
6️⃣ Previous Year Number Sheet – Historical Comparison
This worksheet stores previous year’s data for each KPI.
Purpose:
It helps compare current results with last year’s performance to determine improvement or regression trends.
Benefit:
By reviewing past performance, organizations can set more realistic targets and identify areas that consistently face challenges.
7️⃣ KPI Definition Sheet – The Foundation of the Dashboard
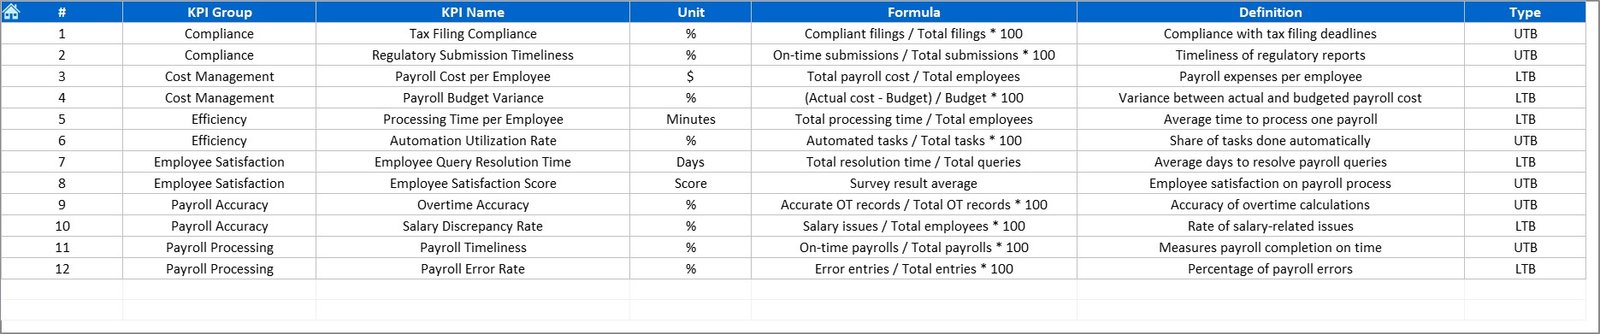
The KPI Definition Sheet lists all KPI details, ensuring transparency and standardization.
Columns Include:
-
KPI Name
-
KPI Group
-
Unit of Measurement
-
Formula
-
Definition
Having all KPIs clearly defined avoids confusion and ensures everyone in the organization measures performance using the same criteria.
Click to Purchases Payroll Management KPI Dashboard in Excel
📈 Key Features of the Payroll Management KPI Dashboard
Here’s what makes this Excel-based payroll dashboard stand out:
-
✅ Automated Calculations: All MTD and YTD metrics update automatically once data is entered.
-
📊 Dynamic Charts: View performance through visual graphs and conditional formatting.
-
🧩 Customizable KPIs: Add or modify KPIs as per organizational needs.
-
🔄 Integrated Data Flow: All sheets are interlinked to ensure consistency.
-
💼 Comprehensive Reporting: Monitor cost, compliance, processing time, and accuracy in one place.
-
🕒 MTD/YTD Toggle: Analyze both short-term and long-term trends with ease.
-
💬 Color-Coded Indicators: Instantly identify performance gaps or achievements using visual cues.
💡 Why Use Excel for Payroll KPI Tracking?
While modern HR software tools exist, Excel remains one of the most powerful and cost-effective platforms for payroll management.
Here’s why:
-
No license fees or software dependency.
-
Easy integration with Power BI or Google Sheets.
-
Supports formulas, pivot tables, and macros for automation.
-
Can be used offline and shared easily via email or cloud.
-
Provides full customization control to HR or finance teams.
Excel gives you both flexibility and functionality—ideal for organizations that prefer control without investing in expensive tools.
🚀 Advantages of Payroll Management KPI Dashboard in Excel
🎯 1. Centralized Performance View
Get a complete view of all payroll-related KPIs in one place, helping HR and finance teams make faster decisions.
⚙️ 2. Automation Reduces Manual Work
Eliminate repetitive tasks with built-in formulas and automatic updates across sheets.
💡 3. Improved Accuracy
Real-time comparisons and conditional formatting reduce the chances of data entry errors.
📈 4. Data-Driven Insights
Visual reports highlight trends that drive meaningful business actions.
💬 5. Customizable for Any Business
Adapt the dashboard to any industry—retail, healthcare, IT, manufacturing, or services.
🧮 6. Cost-Effective Solution
Excel provides powerful functionality without requiring additional software purchases.
🧭 7. Better Strategic Alignment
Track how payroll operations align with organizational goals like cost reduction, compliance, and employee satisfaction.
🔍 Opportunities for Improvement
To enhance this Excel tool even further, consider these improvement areas:
-
🔄 Automate Data Imports: Use Power Query or VBA macros to pull payroll data directly from HR systems.
-
☁️ Enable Real-Time Sharing: Store the workbook on OneDrive or SharePoint for multi-user collaboration.
-
📧 Add Automated Alerts: Create formulas or conditional triggers to notify managers of target breaches.
-
📊 Integrate with Power BI: Combine Excel data with Power BI visuals for advanced analytics.
-
🔐 Add Password Protection: Secure sensitive payroll information with restricted access.
-
🧾 Expand KPI Library: Include metrics like absenteeism cost or benefits utilization for deeper insights.
🧭 Best Practices for Using Payroll KPI Dashboard in Excel
Follow these tips to get the best results:
1️⃣ Define Clear KPI Objectives
Each KPI should have a specific purpose aligned with your payroll goals—accuracy, speed, or compliance.
2️⃣ Maintain Data Consistency
Use standardized date formats, employee IDs, and currency symbols for clarity.
3️⃣ Update Regularly
Input data monthly to ensure MTD and YTD trends remain accurate.
4️⃣ Review Trends Frequently
Analyze KPI trend charts to identify process inefficiencies early.
5️⃣ Use Conditional Formatting Logically
Avoid overloading visuals with too many colors—focus on clarity and actionability.
6️⃣ Share Reports with Stakeholders
Present monthly summaries to HR, finance, and leadership teams for transparency.
7️⃣ Create Backup Copies
Keep historical backups to track how payroll performance evolves over time.
8️⃣ Train Staff
Ensure HR staff understand how to input and interpret data for reliable results.
Click to Purchases Payroll Management KPI Dashboard in Excel
🧩 Real-World Applications of the Dashboard
The Payroll Management KPI Dashboard in Excel is versatile and can be used in:
-
Corporate HR Departments: Track payroll accuracy, compliance, and budget variance.
-
Payroll Outsourcing Firms: Monitor client payroll delivery and SLA performance.
-
Government Agencies: Ensure timely payments and compliance with statutory requirements.
-
Small Businesses: Simplify payroll tracking without complex HRMS software.
-
Finance Teams: Compare payroll costs against business budgets and revenue.
It’s an ideal solution for professionals seeking actionable insights without heavy system dependencies.
📊 How This Dashboard Enhances Decision-Making
-
Helps identify areas where payroll processing can be automated or optimized.
-
Enables monthly and yearly performance comparisons for better forecasting.
-
Improves cost control and helps ensure compliance with labor laws.
-
Strengthens coordination between HR, finance, and compliance teams.
🧾 Conclusion
The Payroll Management KPI Dashboard in Excel transforms complex payroll data into meaningful insights. With dynamic visuals, structured input sheets, and KPI trend analysis, it empowers HR and finance professionals to manage payroll operations more efficiently.
From accuracy tracking to cost control and compliance measurement, this Excel template provides everything needed to maintain payroll excellence. Whether you’re managing a small team or a large workforce, this tool ensures data-driven payroll management that saves time, reduces errors, and improves strategic decision-making.
Click to Purchases Payroll Management KPI Dashboard in Excel
Frequently Asked Questions (FAQs)
1. What is a Payroll KPI Dashboard?
It’s an Excel-based tool that tracks payroll performance metrics like accuracy, timeliness, and cost efficiency.
2. Can I add my own KPIs?
Yes. The dashboard is completely customizable—you can add or modify KPIs based on business needs.
3. How does MTD and YTD analysis work?
MTD shows current month performance, while YTD accumulates results for the year to date.
4. Does it update automatically?
Once actual and target data are entered, the dashboard updates visuals and calculations instantly.
5. Is this suitable for small businesses?
Absolutely. It’s user-friendly, scalable, and ideal for businesses of any size.
6. Can I compare with the previous year?
Yes, the Previous Year Number sheet allows direct year-over-year comparison.
7. How can I share it with others?
You can share the Excel file via email or host it on OneDrive for real-time collaboration.
8. Does it require advanced Excel skills?
No, the dashboard uses simple formulas and dropdowns—anyone with basic Excel knowledge can use it.
9. Can I integrate it with Power BI?
Yes, you can connect Excel data to Power BI for enhanced visual analytics.
10. Who should use this dashboard?
HR managers, payroll teams, finance controllers, and auditors can all use this tool for accurate payroll management.
Click to Purchases Payroll Management KPI Dashboard in Excel
Visit our YouTube channel to learn step-by-step video tutorials