In today’s fast-paced global trade environment, ports handle massive volumes of cargo every single day. However, managing port logistics efficiently becomes challenging when data stays scattered across multiple systems. As a result, decision-making slows down, delays increase, and operational costs rise.
So, how can port authorities, logistics managers, and shipping companies monitor performance, reduce delays, and improve profitability—all in one place?
👉 The answer is the Port Logistics Dashboard in Power BI.
This powerful and ready-to-use dashboard helps you track, analyze, and optimize all critical logistics KPIs in real time. Moreover, it transforms raw data into actionable insights using dynamic visuals, filters, and comparisons.
In this detailed guide, you will learn everything about this dashboard, including its features, benefits, best practices, and FAQs.
What is a Port Logistics Dashboard in Power BI?
A Port Logistics Dashboard in Power BI is an advanced reporting tool designed to monitor and analyze port operations efficiently.
Instead of using multiple reports, this dashboard allows you to:
- Track container movements and cargo types
- Monitor shipping delays and performance
- Analyze costs, revenue, and profit
- Evaluate port-wise and shipping line performance
- Identify trends and operational bottlenecks
Therefore, businesses can make faster and smarter decisions while improving overall efficiency.
Why Do You Need a Port Logistics Dashboard?
Managing port logistics without a centralized dashboard creates several challenges. For example, teams often struggle to identify delays, track costs, and analyze performance.
However, with this dashboard, you can:
- Centralize all logistics data in one place
- Monitor KPIs in real time
- Improve operational visibility
- Reduce delays and inefficiencies
- Increase profitability
Click to buy Port Logistics Dashboard in Power BI
As a result, you gain complete control over your logistics operations.
Click to buy Port Logistics Dashboard in Power BI
What Are the Key Features of the Port Logistics Dashboard?
This dashboard includes 5 powerful pages in Power BI. Each page focuses on a specific area of logistics analysis.
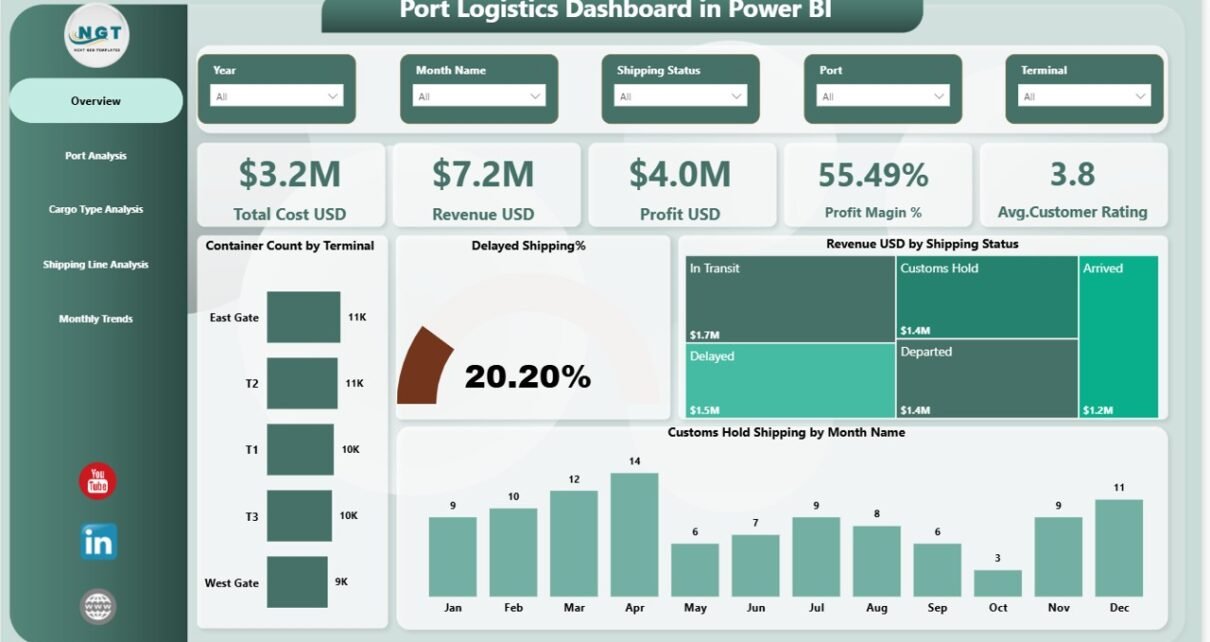
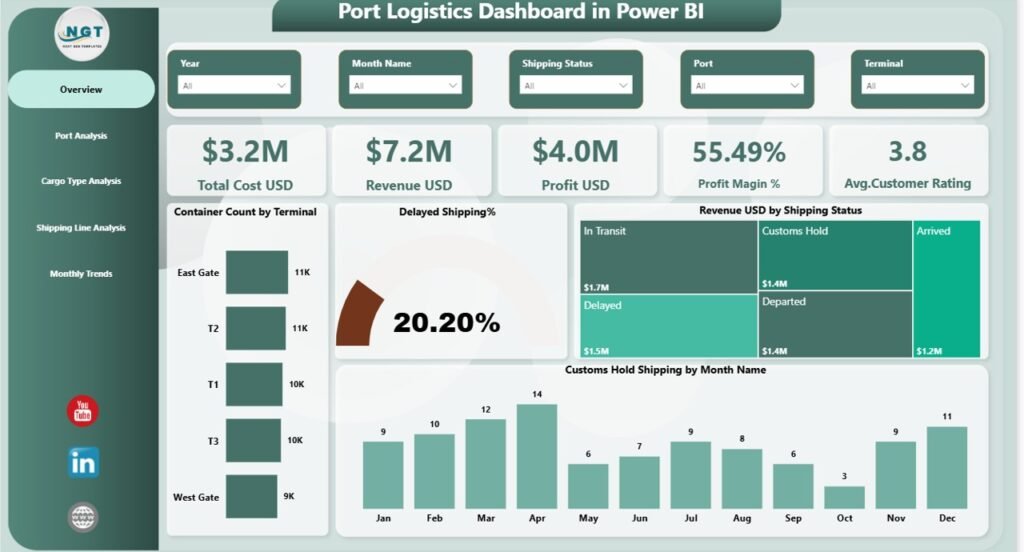
Overview Page – Your Command Center
The Overview Page acts as the main control panel of the dashboard. Here, you can quickly understand overall performance.
KPI Cards Included:
- Total Cost (USD)
- Revenue (USD)
- Profit (USD)
- Profit Margin (%)
- Average Customer Rating
Charts Available:
- Container Count by Terminal
- Delayed Shipping (%)
- Revenue by Shipping Status
- Customer Hold Shipping by Month
As a result, you can instantly evaluate performance and identify issues.
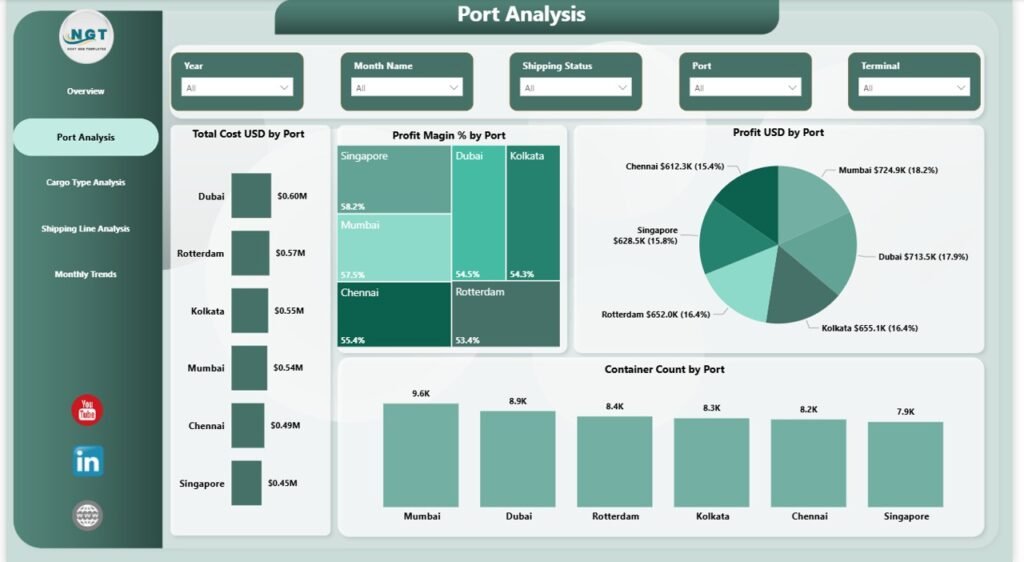
Port Analysis – How Do Different Ports Perform?
The Port Analysis Page helps you compare performance across multiple ports.
Key Charts:
- Total Cost (USD) by Port
- Profit (USD) by Port
- Container Count by Port
👉 Therefore, you can identify which ports perform best and which need improvement.
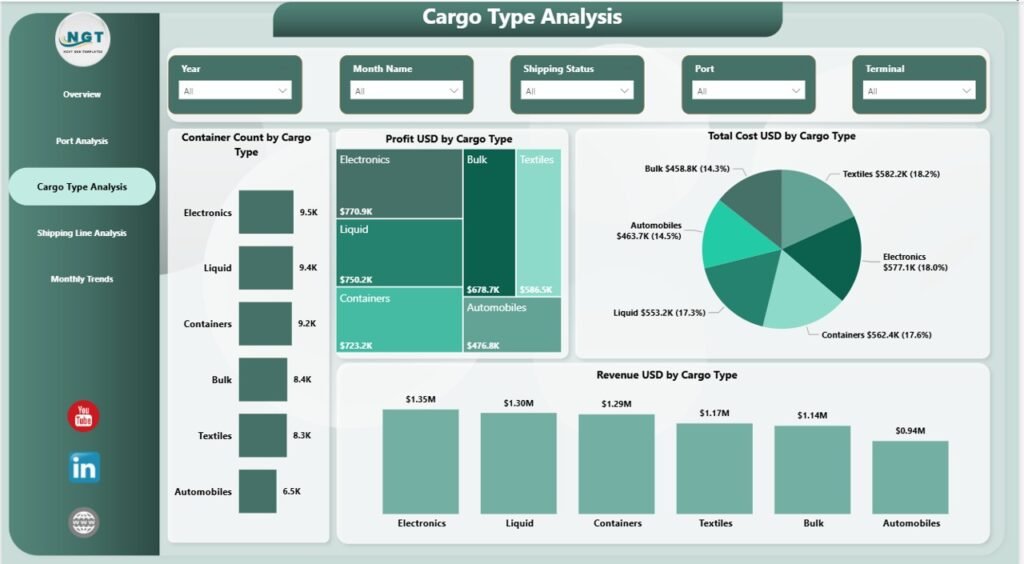
Cargo Type Analysis – Which Cargo Drives Profit?
The Cargo Type Analysis Page provides insights into different cargo categories.
Key Charts:
- Container Count by Cargo
- Profit (USD) by Cargo Type
- Total Cost (USD) by Cargo Type
- Revenue (USD) by Cargo Type
This helps you focus on high-performing cargo types and optimize operations.
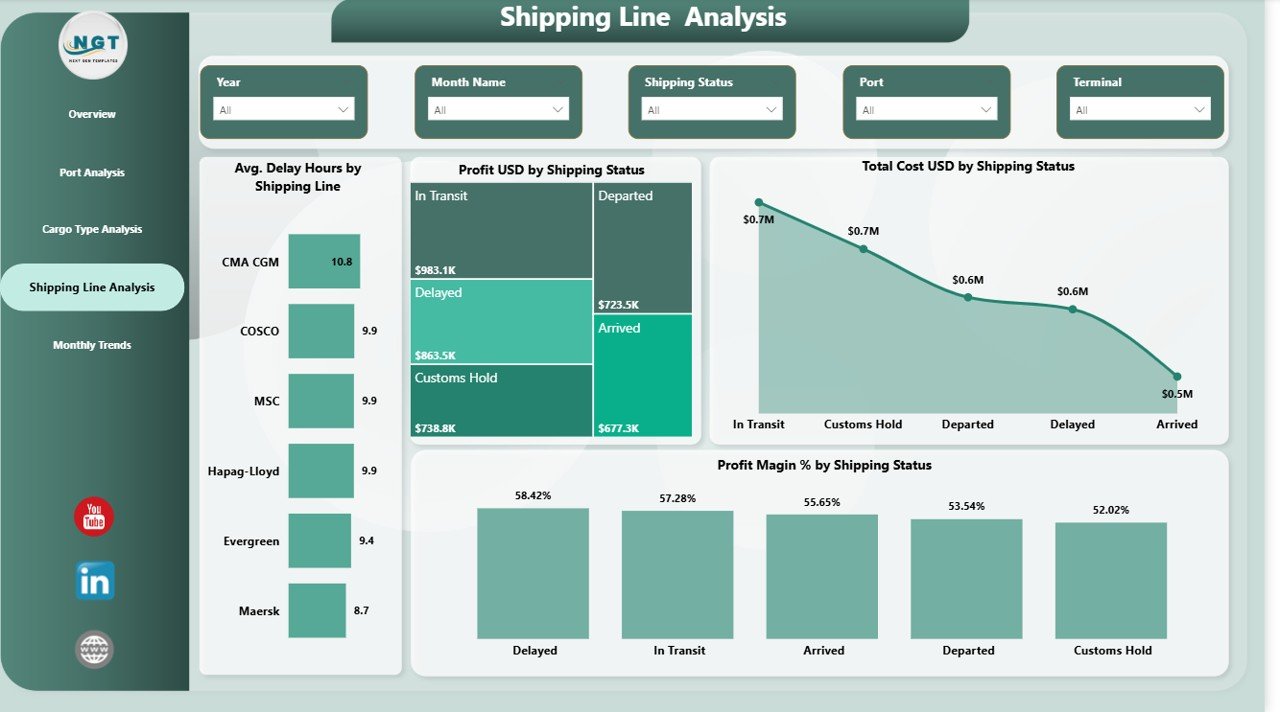
Shipping Line Analysis – Which Shipping Lines Perform Best?
The Shipping Line Analysis Page evaluates shipping partners and their efficiency.
Key Charts:
- Average Delay Hours by Shipping Line
- Total Cost (USD) by Shipping Status
- Profit Margin (%) by Shipping Status
As a result, you can choose reliable shipping partners and reduce delays.
Click to buy Port Logistics Dashboard in Power BI
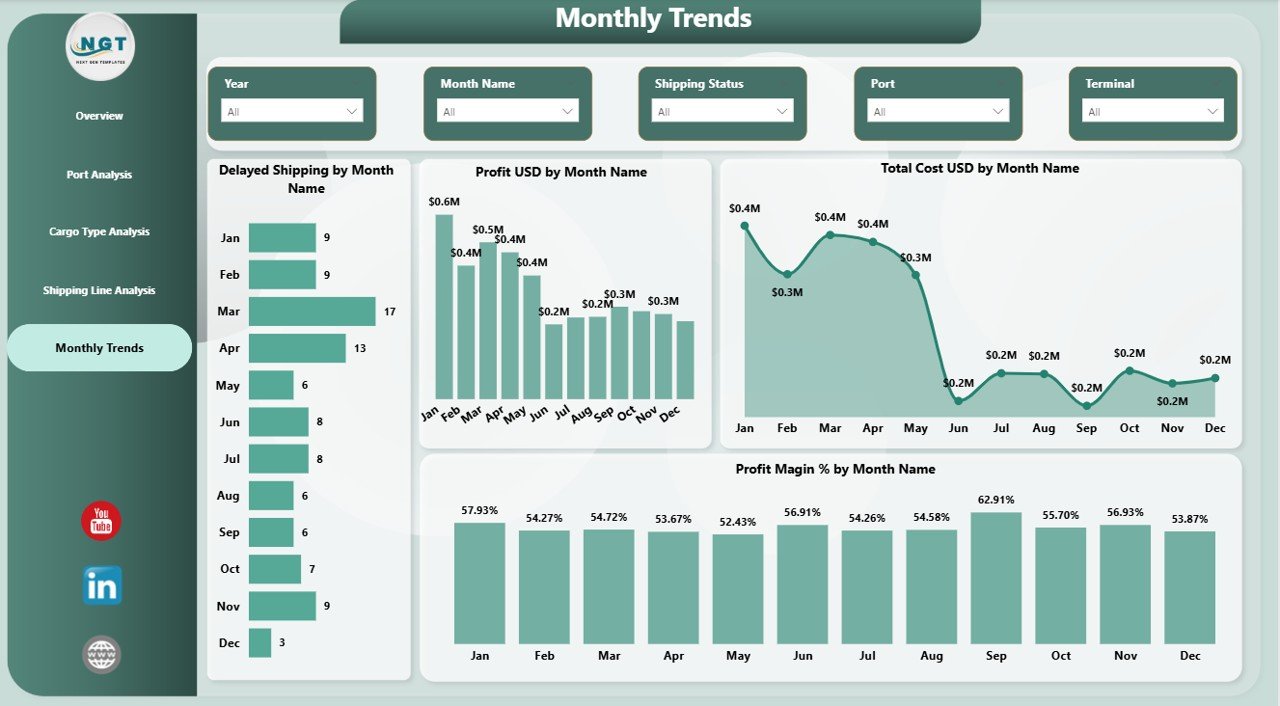
Monthly Trend – How Does Performance Change Over Time?
The Monthly Trend Page tracks performance trends over time.
Key Charts:
- Delayed Shipping by Month
- Profit (USD) by Month
- Total Cost (USD) by Month
- Profit Margin (%) by Month
Therefore, you can identify seasonal trends and plan accordingly.
Click to buy Port Logistics Dashboard in Power BI
How Does This Dashboard Improve Port Logistics?
This dashboard does more than just display numbers. Instead, it enables data-driven decision-making.
Key Improvements:
- Real-time monitoring of operations
- Faster identification of delays
- Better cost and revenue control
- Improved customer satisfaction
- Enhanced strategic planning
As a result, businesses can operate more efficiently and profitably.
Advantages of Port Logistics Dashboard in Power BI
Using this dashboard provides several powerful advantages:
Key Benefits:
- Centralized Data Management – Access all logistics data in one place
- Improved Visibility – Monitor KPIs instantly
- Better Decision-Making – Use data to guide actions
- Reduced Delays – Identify bottlenecks quickly
- Increased Profitability – Optimize cost and revenue
- User-Friendly Interface – Easy to use for all users
- Interactive Reports – Drill down into details
Opportunities for Improvement in Port Logistics
Although this dashboard offers powerful insights, you can further enhance its impact.
Areas to Improve:
- Integrate real-time IoT data from ports
- Add predictive analytics for delays
- Include weather and external factors
- Automate alerts for critical KPIs
- Expand data sources for deeper insights
Best Practices for the Port Logistics Dashboard
To get the best results, you should follow these best practices:
Data Management:
- Keep your data clean and updated
- Use standardized formats
- Validate data regularly
Dashboard Usage:
- Use slicers to filter data effectively
- Focus on key KPIs first
- Analyze trends before making decisions
Optimization Tips:
- Update data frequently
- Customize visuals based on user needs
- Train your team to use the dashboard
As a result, you can maximize the dashboard’s effectiveness.
Who Can Benefit from This Dashboard?
This dashboard works perfectly for multiple professionals:
- Port Authorities
- Logistics Managers
- Supply Chain Professionals
- Business Analysts
- Shipping Companies
- Import/Export Businesses
Therefore, anyone involved in logistics can benefit from this tool.
How to Use the Port Logistics Dashboard in Power BI?
Using this dashboard is simple and effective.
Step-by-Step Process:
- Import your logistics data into Power BI
- Connect data sources to the dashboard
- Use slicers to filter by month, port, or cargo
- Analyze KPI cards and charts
- Identify trends and issues
- Take data-driven actions
As a result, you can improve operations quickly.
What KPIs Should You Track in Port Logistics?
Tracking the right KPIs ensures better performance.
Important KPIs:
- Container Throughput
- Shipping Delay %
- Cost per Shipment
- Revenue per Cargo Type
- Profit Margin %
- Customer Satisfaction Score
How Does Power BI Enhance Logistics Analytics?
Power BI offers several advanced features that improve analytics.
Key Features:
- Interactive dashboards
- Real-time data updates
- Drill-down analysis
- Custom visualizations
- Integration with multiple data sources
Therefore, it becomes a powerful tool for logistics management.
Conclusion
In conclusion, the Port Logistics Dashboard in Power BI is a powerful solution for managing complex logistics operations. It not only centralizes your data but also provides deep insights into performance, costs, and trends.
Moreover, by using this dashboard, you can reduce delays, improve efficiency, and increase profitability. As a result, your organization can stay competitive in today’s fast-moving logistics industry.
If you want to make smarter decisions and optimize your logistics operations, this dashboard is a must-have tool.
Frequently Asked Questions (FAQs)
What is a Port Logistics Dashboard in Power BI?
A Port Logistics Dashboard is a tool that helps track and analyze port operations using interactive visuals and KPIs.
.Who should use this dashboard?
Port managers, logistics professionals, and shipping companies can use this dashboard.
. Can I customize this dashboard?
Yes, you can customize it based on your business needs and data sources.
Does this dashboard support real-time data?
Yes, Power BI allows real-time data integration.
. What are the main KPIs in this dashboard?
Key KPIs include cost, revenue, profit, delay percentage, and container count.
. How does this dashboard reduce delays?
It helps identify bottlenecks and inefficient processes quickly.
Is this dashboard easy to use?
Yes, it features a user-friendly interface with interactive visuals.
Can small businesses use this dashboard?
Yes, it is suitable for both small and large organizations.
Visit our YouTube channel to learn step-by-step video tutorials
Click to buy Port Logistics Dashboard in Power BI