Modern ports handle thousands of vessel movements, cargo shipments, and logistics operations every day. Therefore, port authorities, shipping companies, and logistics managers must constantly monitor operational performance, safety metrics, fuel consumption, and cargo handling efficiency.
However, many port organizations still rely on manual reports, scattered spreadsheets, and disconnected systems. As a result, managers often struggle to track operational performance, identify delays, analyze fuel consumption, and monitor safety incidents effectively.
Therefore, organizations increasingly adopt Power BI dashboards to transform operational data into meaningful insights. A well-designed Port Operations Dashboard in Power BI allows decision-makers to visualize key port performance indicators and monitor operations in real time.
Click to Purchases Port Operations Dashboard in Power BI
Instead of reviewing multiple reports, port managers can evaluate vessel operations, cargo handling activities, fuel consumption, and safety performance from a single interactive dashboard.
In this detailed guide, we will explore:
-
What a Port Operations Dashboard in Power BI is
-
Why port authorities need operational dashboards
-
Key features of this Power BI dashboard
-
Important port performance metrics
-
Advantages of using this dashboard
-
Best practices for implementing it
-
Frequently asked questions
Let’s explore everything step by step.
What is a Port Operations Dashboard in Power BI?
A Port Operations Dashboard in Power BI is an interactive business intelligence tool that helps port managers monitor and analyze port activities using visual reports and real-time analytics.
The dashboard consolidates operational data such as:
-
Vessel movements
-
Cargo operations
-
Fuel consumption
-
Safety incidents
-
Delay times
-
Port performance metrics
Then Power BI transforms this data into interactive charts, KPI cards, and analytical visuals.
Because of this, managers can quickly understand port performance and make better operational decisions.
For example, a port authority can instantly answer questions like:
-
Which vessel type consumes the most fuel?
-
Which operation type causes the highest delay?
-
Which cargo type has the most safety incidents?
-
Which region consumes the most fuel?
Therefore, the Port Operations Dashboard in Power BI becomes a powerful decision-making tool for maritime logistics and port management.
Why Do Port Authorities Need a Port Operations Dashboard?
Port operations involve complex processes including vessel handling, cargo management, fuel monitoring, and safety management. Consequently, managers must monitor several KPIs simultaneously.
Without a dashboard, teams often rely on manual reporting, which creates several problems.
Common Challenges Without a Dashboard
⚓ Data scattered across multiple spreadsheets
⚓ Limited visibility into operational performance
⚓ Slow decision-making
⚓ Difficulty identifying delays and inefficiencies
⚓ Poor monitoring of safety incidents
However, when organizations implement a Power BI dashboard, they can centralize operational data and analyze performance easily.
Benefits of Using a Dashboard
🚢 Real-time visibility into port operations
🚢 Faster data-driven decisions
🚢 Better monitoring of vessel operations
🚢 Improved safety performance tracking
🚢 Accurate analysis of operational delays
Therefore, port authorities can significantly improve operational efficiency by implementing a Port Operations Dashboard in Power BI.
Key Features of the Port Operations Dashboard in Power BI
This Power BI dashboard contains five analytical pages, each designed to provide detailed insights into port operations.
These pages allow managers to analyze operational performance from different perspectives.
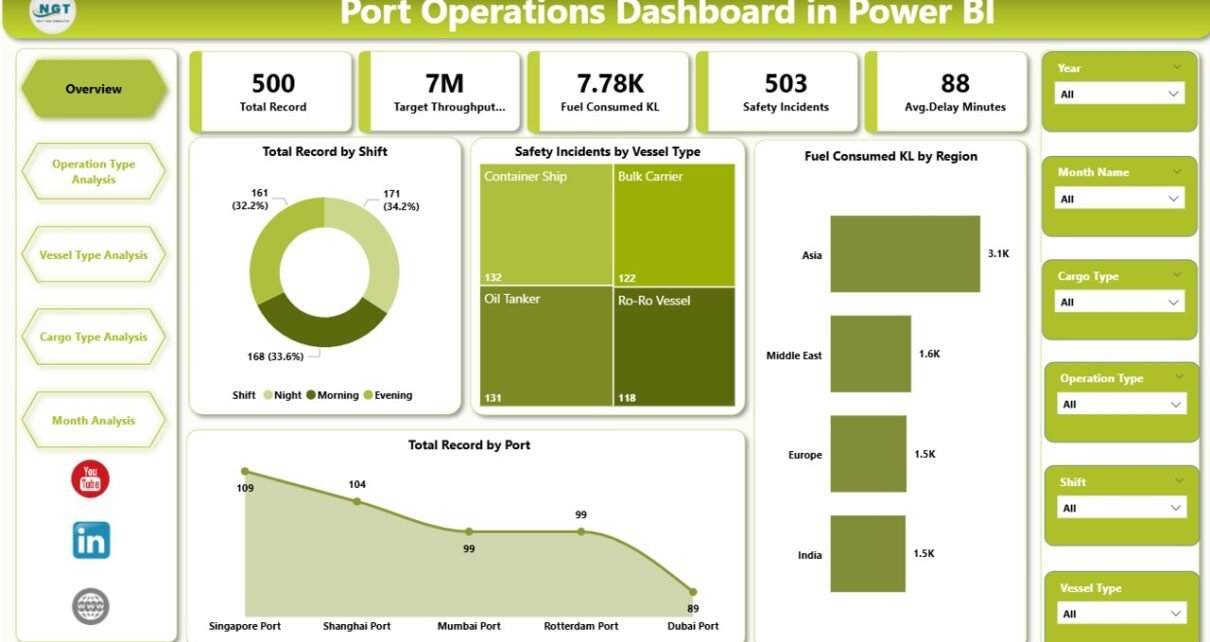
1. Overview Page – Central Performance Monitoring
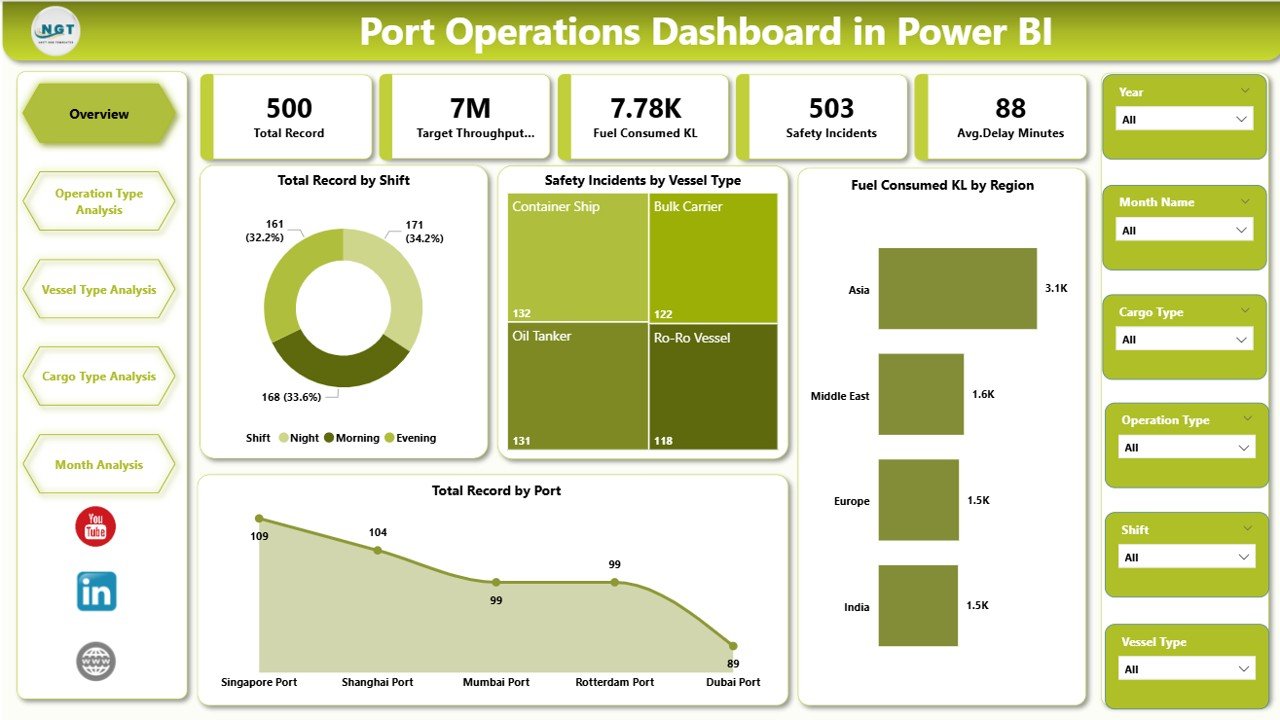
The Overview Page serves as the main dashboard interface. It provides a high-level summary of port operations and performance indicators.
Additionally, users can apply slicers (filters) to analyze data dynamically.
KPI Cards
The dashboard displays several key operational indicators:
-
Total Record by Shift
-
Safety Incident by Vessel Type
-
Fuel Consumed (KL) by Region
-
Total Record by Port
These KPI cards quickly highlight operational performance.
Charts on the Overview Page
The dashboard also includes several analytical charts:
-
Total Record by Shift
-
Safety Incident by Vessel Type
-
Fuel Consumed KL by Region
-
Total Record by Port
Because these visuals appear on the main page, decision-makers can immediately understand the overall operational status of the port.
2. Operation Type Analysis
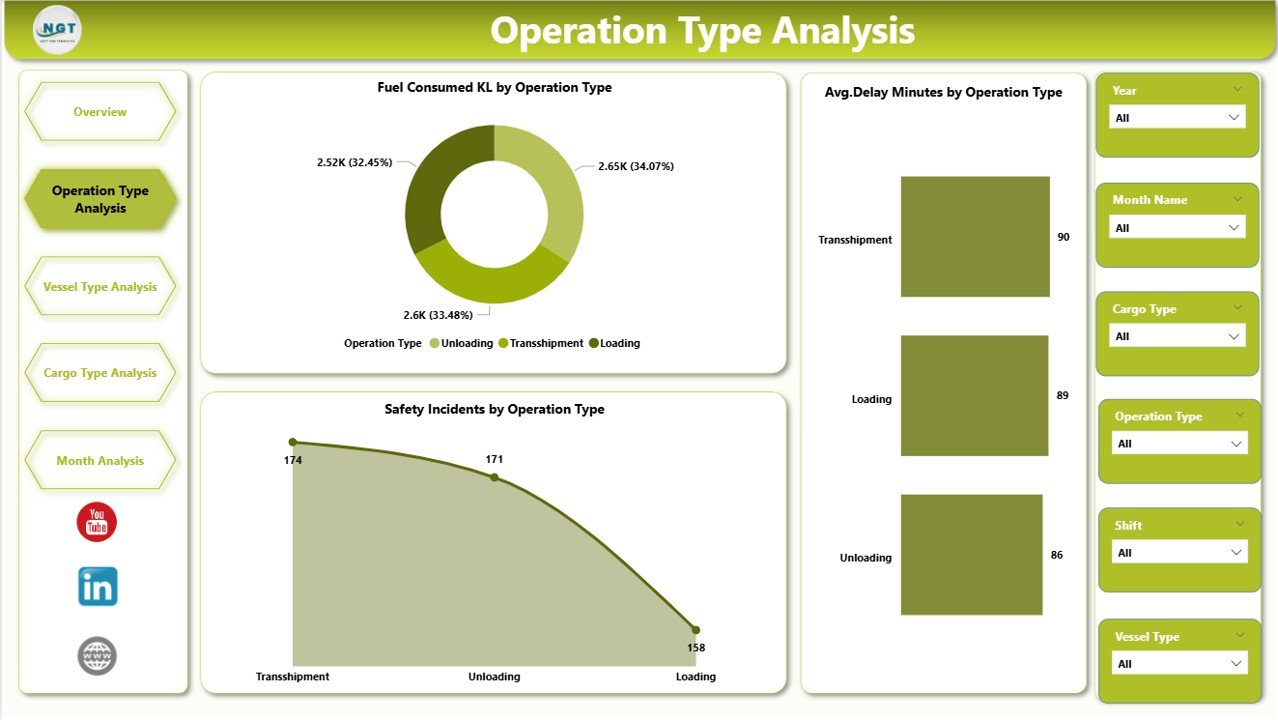
The Operation Type Analysis Page focuses on analyzing operations based on different operational activities.
Ports handle various operations such as loading, unloading, docking, maintenance, and cargo transfer. Therefore, analyzing performance by operation type helps managers identify inefficiencies.
Charts Included
Click to Purchases Port Operations Dashboard in Power BI
📊 Fuel Consumed KL by Operation Type
📊 Average Delay Minutes by Operation Type
📊 Safety Incidents by Operation Type
Using these charts, managers can easily determine:
-
Which operations consume the most fuel
-
Which operations cause the most delays
-
Which operations involve higher safety risks
Consequently, managers can take corrective action to improve operational efficiency.
3. Vessel Type Analysis
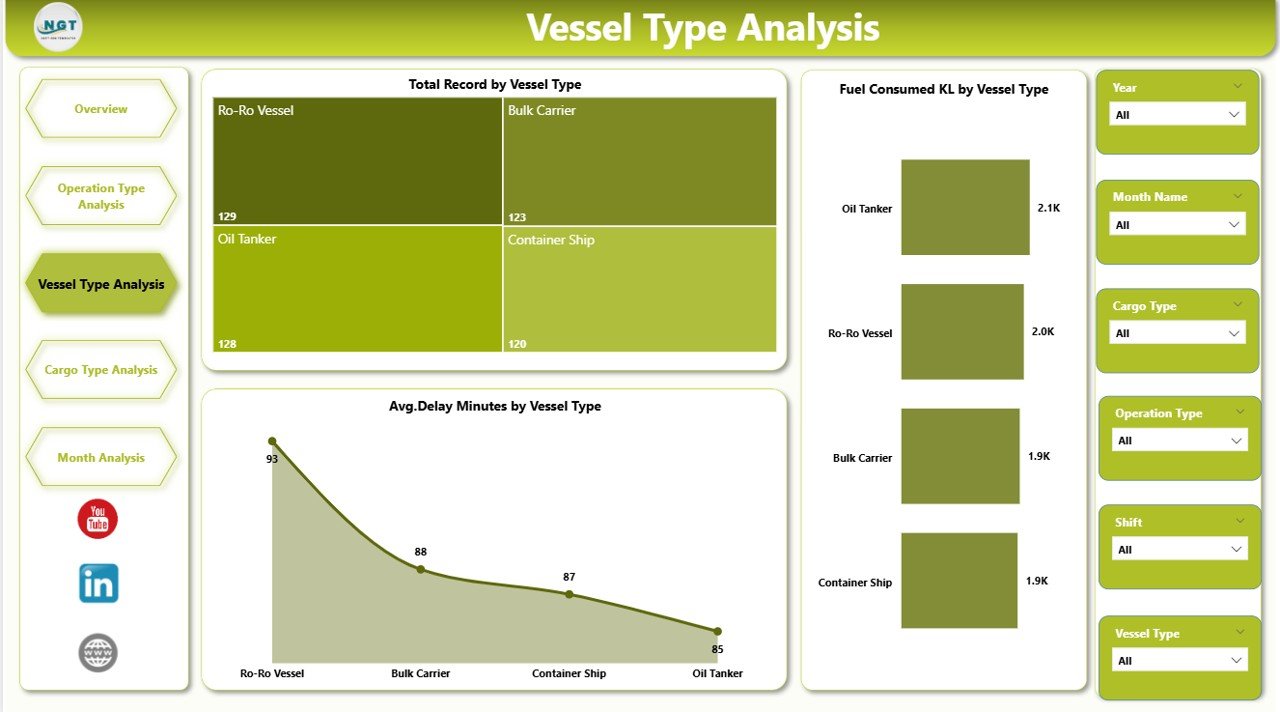
Different types of vessels operate in ports such as:
-
Cargo ships
-
Tankers
-
Container ships
-
Bulk carriers
-
Passenger vessels
Each vessel type may impact port performance differently.
Therefore, the Vessel Type Analysis Page helps managers understand operational patterns related to vessel types.
Charts in This Section
📊 Fuel Consumed KL by Vessel Type
📊 Average Delay Minutes by Vessel Type
📊 Total Record by Vessel Type
Using these insights, port authorities can:
-
Identify high-fuel-consuming vessel types
-
Understand vessel-related delays
-
Monitor vessel traffic volume
As a result, port operations become more efficient and predictable.
4. Cargo Type Analysis
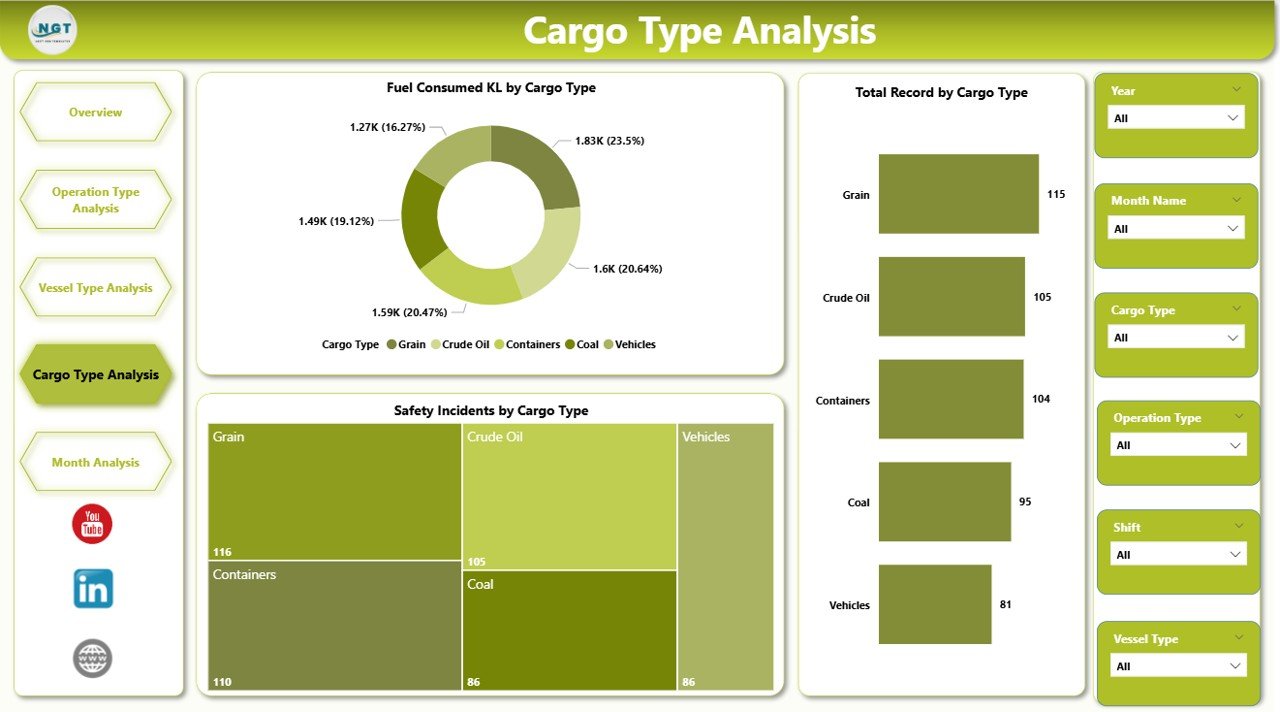
Cargo handling forms the core of port operations. Different cargo types require different handling processes, safety procedures, and equipment.
Therefore, analyzing cargo performance becomes essential.
The Cargo Type Analysis Page focuses on understanding how different cargo types affect port operations.
Charts Included
📊 Fuel Consumed KL by Cargo Type
📊 Safety Incidents by Cargo Type
📊 Total Record by Cargo Type
Using these insights, port managers can:
-
Identify high-risk cargo categories
-
Monitor cargo handling efficiency
-
Improve safety protocols
Consequently, the port can ensure smoother cargo operations.
Click to Purchases Port Operations Dashboard in Power BI
5. Month Analysis
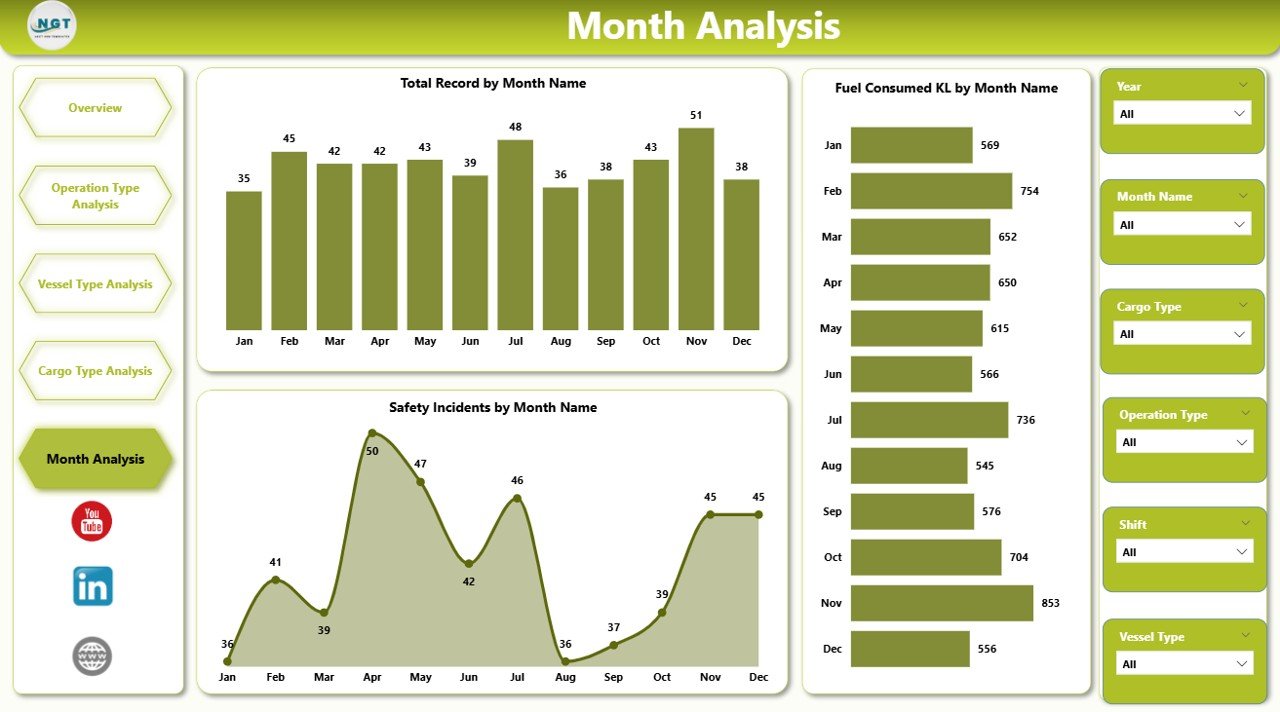
Port operations fluctuate throughout the year due to seasonal trade patterns, demand variations, and shipping schedules.
Therefore, analyzing monthly trends helps organizations forecast operations and plan resources effectively.
Charts on the Month Analysis Page
📊 Fuel Consumed KL by Month
📊 Safety Incidents by Month
📊 Total Record by Month
These charts help managers identify:
-
Seasonal cargo movement patterns
-
Monthly operational performance
-
Trends in safety incidents
As a result, organizations can improve planning and operational efficiency.
What Key Metrics Should a Port Operations Dashboard Track?
A well-designed dashboard must monitor critical operational KPIs.
Some important port performance indicators include:
Operational Metrics
⚓ Total vessel operations
⚓ Total cargo records
⚓ Port traffic volume
Fuel Efficiency Metrics
⚓ Fuel consumed by vessel type
⚓ Fuel consumed by region
⚓ Fuel consumption by cargo operations
Delay Metrics
⚓ Average delay minutes
⚓ Delay by operation type
⚓ Vessel turnaround time
Safety Metrics
⚓ Safety incidents by cargo type
⚓ Safety incidents by vessel type
⚓ Monthly safety trends
Tracking these metrics helps organizations improve operational performance.
Advantages of Port Operations Dashboard in Power BI
Implementing a Port Operations Dashboard in Power BI provides numerous advantages.
1. Real-Time Operational Visibility
Managers can instantly monitor vessel activities, cargo movements, and operational performance.
2. Data-Driven Decision Making
Because Power BI visualizes operational data, decision-makers can identify issues quickly and take corrective action.
3. Improved Operational Efficiency
Managers can identify delays, optimize operations, and improve vessel turnaround time.
4. Better Safety Monitoring
The dashboard highlights safety incidents across vessel types, cargo types, and operations.
Therefore, organizations can implement stronger safety protocols.
5. Centralized Data Monitoring
Instead of reviewing multiple reports, managers can analyze operations through a single dashboard.
6. Improved Resource Planning
Monthly analysis allows organizations to forecast demand and allocate resources efficiently.
Best Practices for the Port Operations Dashboard
Click to Purchases Port Operations Dashboard in Power BI
To maximize the value of the dashboard, organizations should follow several best practices.
1. Use Clean and Structured Data
Ensure the source data remains consistent and well-organized.
2. Track the Right KPIs
Focus on operational, safety, and fuel efficiency metrics.
3. Use Interactive Filters
Slicers allow users to analyze operations by vessel type, cargo type, and region.
4. Monitor Trends Regularly
Regular monitoring helps managers detect operational issues early.
5. Keep Dashboard Design Simple
Avoid cluttered visuals. Instead, use clean charts and clear metrics.
6. Update Data Frequently
Frequent data refresh ensures accurate operational insights.
How Can Power BI Improve Port Operations?
Power BI transforms raw operational data into meaningful insights.
Because of this capability, organizations can improve operations in several ways.
Operational Optimization
Managers can identify inefficient processes and optimize operations.
Delay Reduction
Analyzing delay patterns helps organizations reduce turnaround times.
Safety Improvements
Monitoring safety incidents enables proactive risk management.
Cost Control
Tracking fuel consumption helps reduce operational costs.
Therefore, Power BI significantly enhances port performance management.
Conclusion
Port operations involve complex logistics, multiple stakeholders, and large operational data sets. Therefore, organizations must adopt modern analytics tools to manage operations effectively.
The Port Operations Dashboard in Power BI provides a powerful solution for monitoring vessel movements, cargo operations, fuel consumption, delays, and safety incidents.
Because the dashboard organizes operational data into interactive visuals, managers can quickly identify trends and performance issues.
As a result, port authorities can improve efficiency, enhance safety, reduce operational delays, and make smarter data-driven decisions.
Therefore, implementing a Port Operations Dashboard in Power BI becomes an essential step toward modern port management.
Frequently Asked Questions (FAQs)
What is a Port Operations Dashboard?
A Port Operations Dashboard is a visual reporting tool that monitors vessel activities, cargo handling, fuel consumption, and safety metrics using charts and KPIs.
Why should ports use Power BI for operations analytics?
Power BI provides interactive dashboards, real-time insights, and powerful data visualization capabilities. Therefore, it helps port authorities monitor operations efficiently.
What data is required for a Port Operations Dashboard?
Click to Purchases Port Operations Dashboard in Power BI
Typical data includes:
-
Vessel type
-
Cargo type
-
Operation type
-
Fuel consumption
-
Delay minutes
-
Safety incidents
-
Port location
-
Monthly operational data
Who can use a Port Operations Dashboard?
Several professionals benefit from this dashboard:
-
Port authorities
-
Maritime logistics managers
-
Shipping companies
-
Cargo operations managers
-
Maritime analysts
How often should port operational data be updated?
Organizations should update operational data daily or weekly to ensure accurate analysis and timely decision-making.
Visit our YouTube channel to learn step-by-step video tutorials