Port operations depend heavily on strong procurement management. Every purchase, contract, and supplier decision directly impacts cost, efficiency, and operational continuity. Therefore, port authorities and procurement teams must track performance accurately and act quickly when issues arise.
That is exactly where the Port Procurement KPI Dashboard in Power BI plays a vital role.
This in-depth guide explains everything you need to know about the Port Procurement KPI Dashboard in Power BI. You will learn how it works, why it matters, how to use it, and how it improves procurement performance. Moreover, you will also discover its advantages, best practices, and frequently asked questions.
Click to buy Port Procurement KPI Dashboard in Power BI
What Is a Port Procurement KPI Dashboard in Power BI?
A Port Procurement KPI Dashboard in Power BI is a visual and interactive reporting tool that helps port authorities monitor procurement performance using real-time data.
Instead of working with multiple Excel sheets, emails, and manual reports, this dashboard centralizes all procurement KPIs into a single, easy-to-use interface. As a result, decision-makers can analyze performance, track targets, and identify gaps without delay.
Moreover, the dashboard uses Excel as a data source, which makes it simple to maintain and update without technical complexity.
Why Do Ports Need a Procurement KPI Dashboard?
Ports handle large volumes of procurement activities every month. They manage vendor contracts, material purchases, service agreements, and operational supplies. Without proper tracking, procurement teams often face issues such as:
- Cost overruns
- Missed targets
- Delayed procurement cycles
- Poor vendor performance
- Lack of visibility into KPIs
However, when teams use a Procurement KPI Dashboard in Power BI, they gain complete control over procurement data. They can track performance in real time, compare targets, and improve decision-making.
Key Objectives of the Port Procurement KPI Dashboard
This dashboard focuses on the following goals:
- Track procurement performance in real time
- Compare actual vs target values
- Monitor monthly and yearly trends
- Identify underperforming KPIs
- Improve cost efficiency
- Support data-driven decisions
Because of these goals, the dashboard becomes an essential tool for port procurement teams.
Structure of the Port Procurement KPI Dashboard in Power BI
The dashboard consists of three powerful pages, each designed to serve a specific purpose.
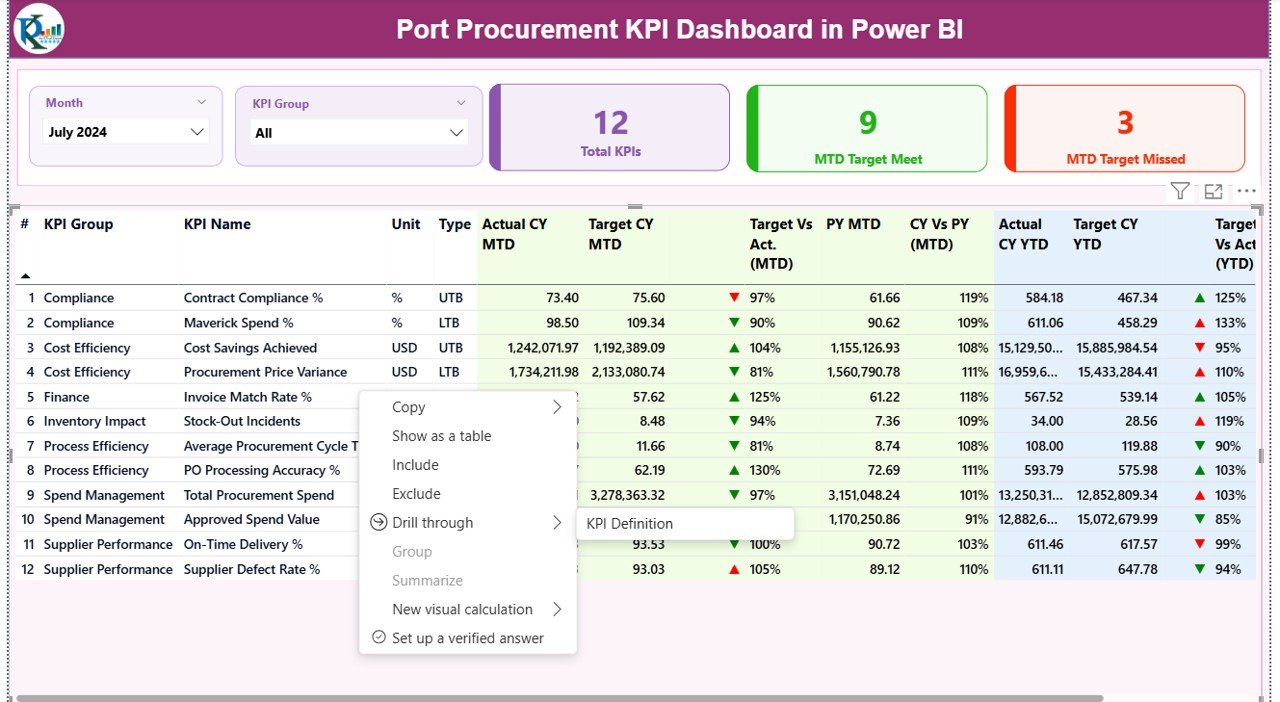
Summary Page – Complete KPI Overview
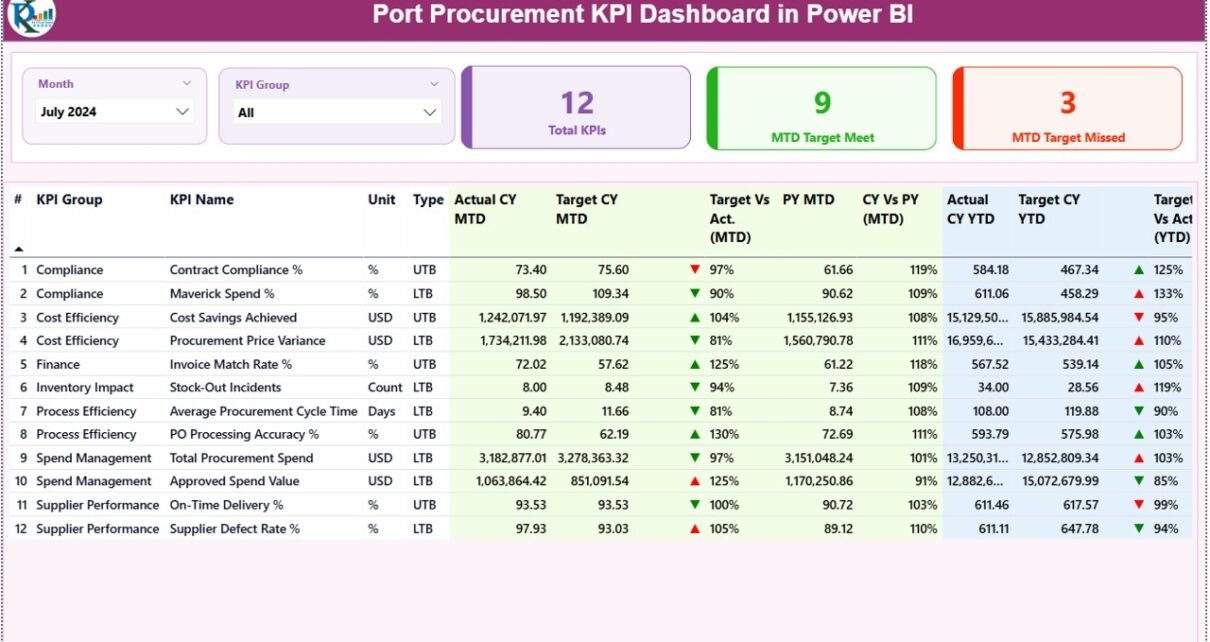
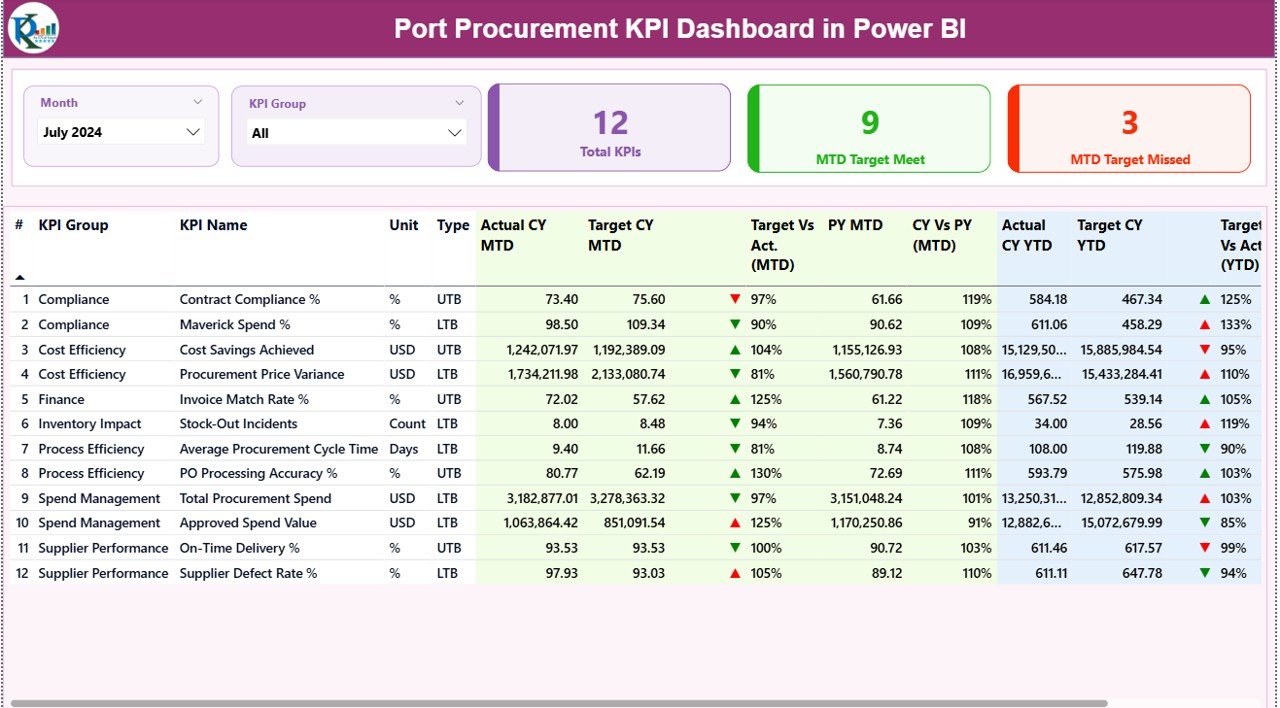
The Summary Page acts as the central dashboard. It provides a high-level overview of all procurement KPIs.
Key Elements of the Summary Page
Filters and Slicers
- Month Slicer – Select any month for analysis
- KPI Group Slicer – Filter KPIs by category
These slicers help users analyze specific periods or KPI groups instantly. KPI Summary Cards
The dashboard displays three major KPI cards at the top:
- Total KPIs Count
- MTD Target Met Count
- MTD Target Missed Count
These cards instantly show performance status and help management take quick action.
Detailed KPI Table
The table provides a complete breakdown of each KPI with the following fields:
- KPI Number – Unique identification number
- KPI Group – Category of KPI
- KPI Name – Name of the KPI
- Unit – Unit of measurement
- Type –
LTB (Lower the Better)
UTB (Upper the Better)
MTD Performance Metrics
- Actual CY MTD – Actual current year month-to-date value
- Target CY MTD – Target value for the current month
- MTD Icon – Green arrow for good performance Red arrow for poor performance
- Target vs Actual (MTD) – Calculated using:
Actual ÷ Target - PY MTD – Previous year MTD value
- CY vs PY (MTD) – Performance comparison between years
YTD Performance Metrics
- Actual CY YTD – Year-to-date actual value
- Target CY YTD – Year-to-date target
- YTD Icon – Visual indicator of performance
- Target vs Actual (YTD) – Percentage comparison
- PY YTD – Previous year YTD value
- CY vs PY (YTD) – Year-over-year comparison
This structure helps users identify trends, gaps, and performance issues instantly.
Click to buy Port Procurement KPI Dashboard in Power BI
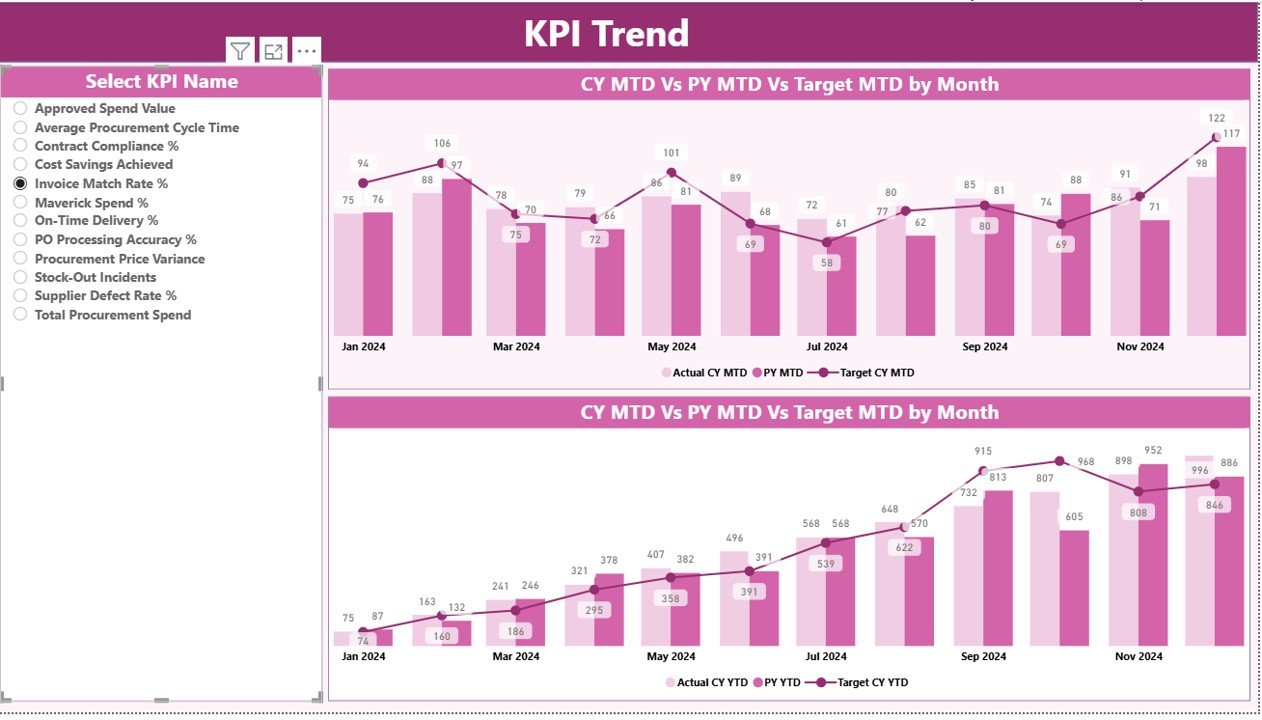
KPI Trend Page – Performance Analysis Over Time
The KPI Trend Page helps users analyze how performance changes over time.
Key Features of the KPI Trend Page
Two interactive combo charts
Comparison of:
Current Year Actual
Previous Year Actual
Target Values
Separate views for:
MTD performance
YTD performance
KPI Selection Slicer
Users can select any KPI from the slicer to view detailed trends. This feature helps management understand performance behavior over time.
Click to buy Port Procurement KPI Dashboard in Power BI
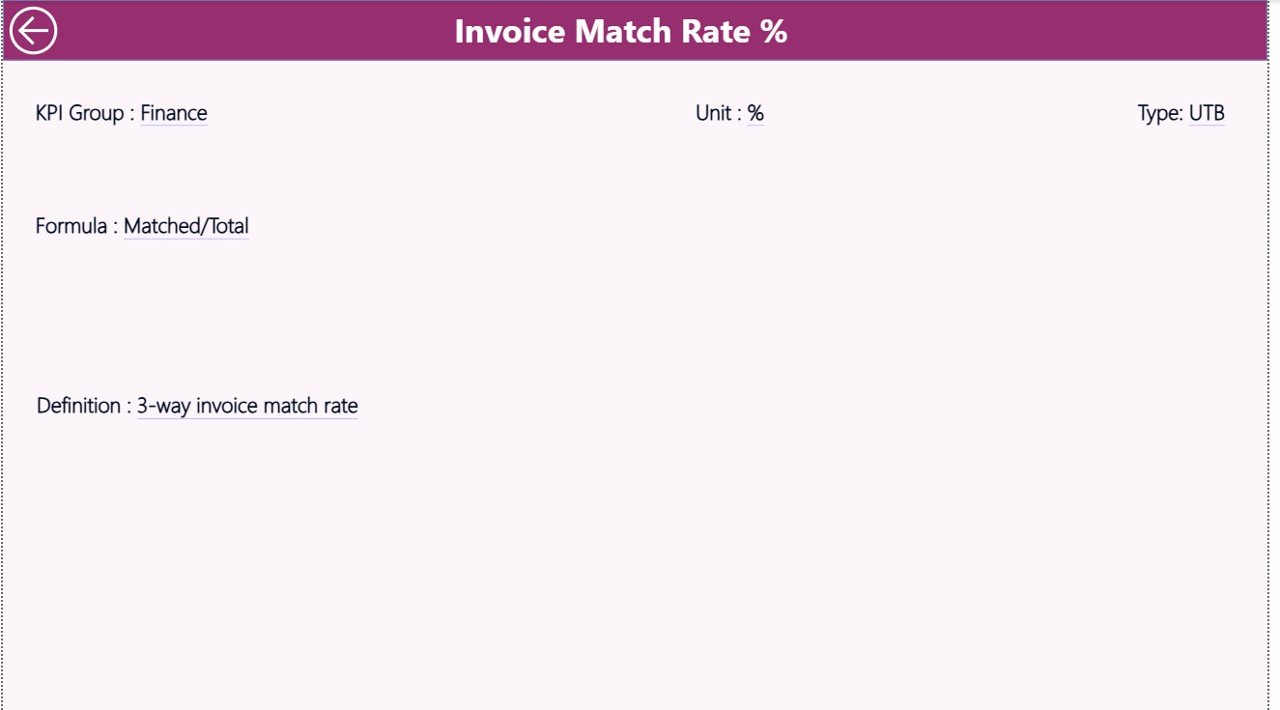
KPI Definition Page – Complete KPI Explanation
The KPI Definition Page works as a drill-through page.
What This Page Shows
- KPI Name
- KPI Group
- KPI Formula
- KPI Definition
- KPI Type (LTB or UTB)
This page helps users understand:
- How KPIs get calculated
- What each KPI means
- Why a KPI matters
Users can return to the main page using the Back button located at the top left corner.
Click to buy Port Procurement KPI Dashboard in Power BI
Excel Data Structure Used in the Dashboard
The dashboard connects to an Excel file that contains structured data. This setup makes data entry simple and flexible.
Input_Actual Sheet
In this sheet, users enter:
- KPI Name
- Month (First date of the month)
- MTD Actual Value
- YTD Actual Value
This sheet captures real performance data.
Input_Target Sheet
This sheet stores target values:
- KPI Name
- Month
- Target MTD
- Target YTD
The dashboard uses this data to calculate performance percentages.
Click to buy Port Procurement KPI Dashboard in Power BI
KPI Definition Sheet
This sheet contains:
- KPI Number
- KPI Group
- KPI Name
- Unit
- Formula
- Definition
- KPI Type (LTB or UTB)
This structure ensures clarity and standardization.
Advantages of Port Procurement KPI Dashboard in Power BI
Real-Time Performance Tracking
The dashboard shows live KPI status, which helps teams react quickly.
Improved Decision-Making
Visual insights help management make data-driven decisions.
Easy to Use
Since the dashboard uses Excel as a data source, users can update data without technical knowledge.
Time-Saving
The dashboard eliminates manual reporting and reduces effort.
Clear KPI Visibility
Visual indicators highlight underperforming KPIs instantly.
Better Cost Control
Procurement teams can track spending trends and reduce wastage.
Professional Reporting
The dashboard creates management-ready reports for reviews and meetings.
Best Practices for Using the Port Procurement KPI Dashboard
Keep Data Updated Regularly
Update actual and target data every month to maintain accuracy.
Use Clear KPI Definitions
Always define KPIs properly to avoid confusion.
Track Trends, Not Just Numbers
Analyze trends instead of focusing only on current values.
Review KPI Performance Monthly
Conduct monthly reviews to identify gaps early.
Use Consistent Measurement Units
Maintain uniform units across all KPIs for better comparison.
Train Users
Provide basic training so users understand how to interpret the dashboard.
Who Should Use This Dashboard?
This dashboard suits:
- Port Authorities
- Procurement Managers
- Supply Chain Teams
- Operations Managers
- Finance Teams
- Performance Analysts
Any organization involved in port procurement can benefit from this dashboard.
Why Power BI Is Ideal for Procurement Dashboards
Power BI offers:
- Interactive visuals
- Fast performance
- Easy Excel integration
- Automated calculations
- Drill-down capability
- Professional reporting
Because of these features, Power BI works perfectly for procurement analytics.
Conclusion
The Port Procurement KPI Dashboard in Power BI provides a powerful and user-friendly solution for monitoring procurement performance. It simplifies data analysis, improves visibility, and supports faster decision-making.
With clear KPIs, visual indicators, trend analysis, and Excel-based input, this dashboard helps procurement teams stay in control and achieve their targets efficiently.
If you want to improve procurement performance, reduce costs, and gain better insights, this dashboard offers the perfect solution.
Frequently Asked Questions (FAQs)
- What is a Port Procurement KPI Dashboard?
A Port Procurement KPI Dashboard is a Power BI report that tracks procurement performance using key metrics such as cost, targets, and efficiency.
- Can I use Excel as a data source?
Yes, the dashboard uses Excel files for data input, making it simple and flexible.
- What KPIs does the dashboard track?
It tracks MTD, YTD, target vs actual, previous year comparison, and KPI performance status.
- Is this dashboard customizable?
Yes, you can add or modify KPIs, targets, and visuals based on your needs.
- Who should use this dashboard?
Procurement teams, port managers, finance teams, and decision-makers can use it.
- Does it support trend analysis?
Yes, the KPI Trend page shows month-wise and year-wise trends.
- Can beginners use this dashboard?
Yes, the dashboard uses simple visuals and Excel-based data entry.
Visit our YouTube channel to learn step-by-step video tutorials
Watch the step-by-step video tutorial:
Click to buy Port Procurement KPI Dashboard in Power BI