The energy sector changes fast, and power generation companies must track performance, cost, downtime, and revenue in real time. When this data stays scattered across spreadsheets and manual reports, managers do not get clear insights. As a result, decision-making slows down, operational issues increase, and financial outcomes weaken.
A Power Generation Dashboard in Power BI solves all these challenges. It brings every key metric of power production into one interactive, visual, and easy-to-understand dashboard. You track fuel cost, revenue, total cost, downtime, plant performance, month-wise trends, and many other KPIs from a single place.
Click to Purchases Power Generation Dashboard in Power BI
In this detailed guide, you will learn everything about the Power Generation Dashboard in Power BI, including its structure, pages, features, benefits, best practices, and answers to common questions. Let’s explore how this dashboard helps every power plant operate efficiently.
What Is a Power Generation Dashboard in Power BI?
A Power Generation Dashboard in Power BI is a ready-to-use energy analytics solution that shows all critical power plant KPIs in one place. It helps power companies, utility organizations, plant managers, and energy analysts track production, cost, revenue, downtime, and fuel performance with real-time visuals.
Because the dashboard runs in Power BI, you enjoy:
-
Faster decision-making
-
Accurate trend analysis
-
Fully interactive charts
-
Dynamic slicers for filtering
-
Centralized reporting
-
Improved operational efficiency
This dashboard works for all types of power plants, including:
-
Thermal power plants
-
Solar power plants
-
Hydro power plants
-
Wind power plants
-
Biomass plants
-
Gas-based plants
Therefore, any energy company can use this dashboard to improve monitoring and planning.
Key Features of the Power Generation Dashboard in Power BI
This dashboard contains five powerful pages that cover every area of power generation analytics. Each page includes slicers, visual cards, and charts to analyze performance from different angles.
Let’s go through each page in detail.
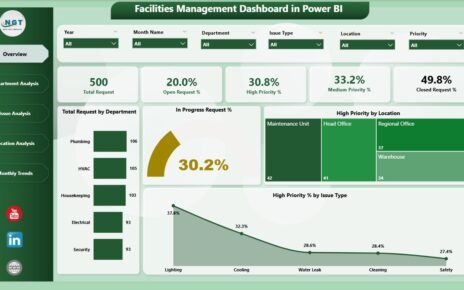
1. Overview Page – How It Helps You Understand Power Performance

The Overview Page is the most important part of this dashboard. It gives you a complete summary of operational and financial performance.
What You See on the Overview Page
✔️ Slicers to filter by department, fuel type, or plant
✔️ 5 information cards showing key KPIs
✔️ 3 visual charts for financial and operational insights
Main Charts on This Page
-
Profit (USD) by Department
-
Total Cost (USD) & Revenue (USD) by Fuel Type
-
Fuel Cost (USD) by Unit Name
These visuals help you:
-
Compare profit across departments
-
Understand which fuel type brings the highest revenue
-
Track fuel cost variations across units
-
Identify cost-heavy areas quickly
Because this page gives an instant snapshot, it becomes your go-to place for daily monitoring.
2. Why the Department Analysis Page Is Important

Every department plays a key role in power generation. However, cost, downtime, and revenue differ across departments. The Department Analysis Page shows these differences clearly.
Charts Available on This Page
-
Total Cost (USD) & Revenue (USD) by Department
-
Average Downtime (Hours) by Department
-
Fuel Cost (USD) by Department
What This Page Helps You Understand
-
Which departments run efficiently
-
Which departments show higher fuel cost
-
How downtime affects productivity
-
Revenue contribution of each department
Because you can compare all departments side-by-side, you make faster decisions on cost control and productivity improvement.
3. Plant Type Analysis – Evaluate Performance by Plant Category

Different plant types behave differently based on their fuel, equipment, environment, and operating model. The Plant Type Analysis Page helps you compare performance across all plant types.
Charts on This Page
-
Total Cost (USD) & Revenue (USD) by Plant Name
-
Average Downtime (Hours) by Plant Name
-
Operating Cost (USD) by Plant Type
What You Learn
-
Which plant delivers the highest revenue
-
Which plant type has more downtime
-
Cost differences among plant categories
-
Profitability across plants
Since every plant has unique challenges, this page helps you analyze them individually and make improvement plans.
Click to Purchases Power Generation Dashboard in Power BI
4. Fuel Type Analysis – Track Performance by Fuel Source

Fuel type affects cost, downtime, efficiency, and overall profit. Therefore, it is important to compare all fuel types in one place. The Fuel Type Analysis Page gives you that clarity.
Charts Included
-
Total Cost (USD) & Revenue (USD) by Fuel Type
-
Average Downtime (Hours) by Fuel Type
-
Operating Cost (USD) by Fuel Type
Insights You Gain
-
Which fuel type leads to lower cost
-
Which fuel source delivers higher revenue
-
Which fuel type causes more downtime
-
Operating cost differences across fuels
This page becomes essential when planning fuel procurement, evaluating supplier performance, or analyzing energy mix efficiency.
5. Monthly Trends Page – How It Helps You Track Seasonal Performance

Power generation companies experience seasonal changes. Therefore, you must monitor month-wise cost, revenue, and fuel usage. The Monthly Trends Page gives you a clear view of these patterns.
Charts on This Page
-
Total Cost (USD) & Revenue (USD) by Month
-
Fuel Cost (USD) by Month
-
Operating Cost (USD) by Month
Why This Page Matters
-
You track monthly fluctuations
-
You identify seasonal behavior
-
You compare peak and low performance
-
You improve forecasting and budgeting
-
You plan maintenance considering downtime
With trend analysis, you understand the bigger picture and make informed strategic decisions.
Why Every Power Plant Needs a Power Generation Dashboard in Power BI
Power plants generate huge volumes of data every day. When this data stays in Excel files, emails, or manual logs, the management struggles to analyze it quickly. A Power BI dashboard removes these problems and brings everything into one visual space.
Main Reasons Why This Dashboard Is Essential
-
It improves transparency
-
It reduces reporting time
-
It supports real-time decision-making
-
It gives you visual clarity
-
It tracks cost and downtime effectively
-
It highlights performance issues early
-
It strengthens energy forecasting
-
It helps in strategic planning
This dashboard works as a complete analytics solution for any power company.
Advantages of a Power Generation Dashboard in Power BI
Using this dashboard offers many benefits. Here are the most important advantages:
1. Better Visibility of Operations
You view every KPI in one dashboard. Therefore, you track performance without switching between multiple reports.
2. Faster Decision-Making
Interactive visuals help you understand issues instantly. This speed improves problem solving.
3. Accurate Cost and Revenue Analysis
Since the dashboard tracks every cost and revenue point, you get clear financial insights that lead to smarter budgeting.
4. Reduced Downtime and Better Planning
Trend visuals help you identify downtime patterns so you plan maintenance and resource allocation better.
5. Improved Fuel Efficiency
You compare fuel types and calculate the best fuel mix based on performance and cost.
6. Smooth Department Coordination
All departments get transparent data, which improves teamwork and communication.
7. Easy Customization
Because the dashboard runs in Power BI, you customize visuals and filters as per your needs.
Best Practices for Using the Power Generation Dashboard in Power BI
To get the maximum benefits from this dashboard, follow these best practices:
1. Update Your Data Regularly
Fresh data gives you accurate insights and helps you track daily performance.
2. Use Slicers Effectively
Filter by plant, fuel type, or department to get targeted insights.
3. Monitor Downtime Trends
Downtime affects revenue and efficiency. Review monthly downtime visuals to plan maintenance properly.
4. Compare Departments Frequently
Department-wise comparison helps you catch inefficiencies early.
5. Track Fuel Cost Movements
Fuel cost controls overall profit. Check fuel trends regularly to understand fluctuations.
6. Share Dashboard Reports with Teams
Collaboration improves performance across all plant units.
7. Review Monthly Trends Before Making Decisions
Monthly patterns help you forecast future production, cost, and revenue.
Conclusion
A Power Generation Dashboard in Power BI helps power plants track production, cost, downtime, fuel efficiency, and revenue from one unified place. Since the dashboard uses interactive visuals, managers understand performance faster and make better decisions.
This dashboard becomes essential when you want clear insights, improved planning, and real-time monitoring. Whether you manage a small plant or a large multi-unit operation, Power BI simplifies energy analytics and supports long-term success.
Frequently Asked Questions (FAQs)
Click to Purchases Power Generation Dashboard in Power BI
1. What is a Power Generation Dashboard in Power BI?
It is an interactive reporting tool that tracks power generation KPIs such as cost, revenue, downtime, fuel usage, and plant performance.
2. Who can use this dashboard?
Plant managers, energy analysts, utility companies, power plant operators, and financial teams use this dashboard.
3. Can I customize the dashboard?
Yes. Power BI allows full customization, including charts, filters, visuals, and data sources.
4. What data do I need to run this dashboard?
You need cost data, revenue data, downtime logs, fuel usage records, plant performance information, and department-wise metrics.
5. Does the dashboard work for all plant types?
Yes. It works for thermal, solar, wind, hydro, gas, and other power plant categories.
6. How often should I update the data?
You should update it daily or weekly based on your reporting needs.
7. Why is downtime analysis important?
Downtime affects production efficiency and revenue. Monitoring it helps improve planning and maintenance.
8. Can this dashboard improve cost control?
Yes. With clear visuals on fuel cost, operating cost, and total cost, you control expenses more effectively.
Visit our YouTube channel to learn step-by-step video tutorials