In today’s dynamic workplace, retaining skilled employees is more crucial than ever. Project managers face constant pressure to not only deliver successful outcomes but also to manage human capital effectively. That’s why we created the Project Management Employee Retention KPI Dashboard in Excel – a powerful, ready-to-use tool that empowers teams to measure, monitor, and improve employee retention efforts.
This comprehensive dashboard brings together all your key employee retention metrics in one place. Let’s explore how it works, what makes it unique, and how you can implement it in your workflow today.
Click to Purchases Project Management Employee Retention KPI Dashboard in Excel
What is an Employee Retention KPI Dashboard?
An Employee Retention KPI Dashboard is a centralized visual tool used to track and analyze key performance indicators related to retaining employees. It allows project managers and HR professionals to:
- Identify high turnover risks early
- Compare retention performance against targets
- Analyze trends over time
- Make data-driven decisions for improving workforce stability
When powered by Excel, the dashboard becomes even more accessible and flexible. No expensive software or licenses needed. Just plug in your data and gain instant insights.
Why Use Excel for Employee Retention Dashboards?
While many platforms exist for workforce analytics, Excel remains a popular choice. Here’s why:
- ✅ Ease of use – Most project managers already know Excel basics.
- ✅ Customization – You can tailor every part of the dashboard to your needs.
- ✅ Cost-effective – No subscription or cloud service required.
- ✅ Offline access – Work from anywhere, even without the internet.
Key Features of the Project Management Employee Retention KPI Dashboard
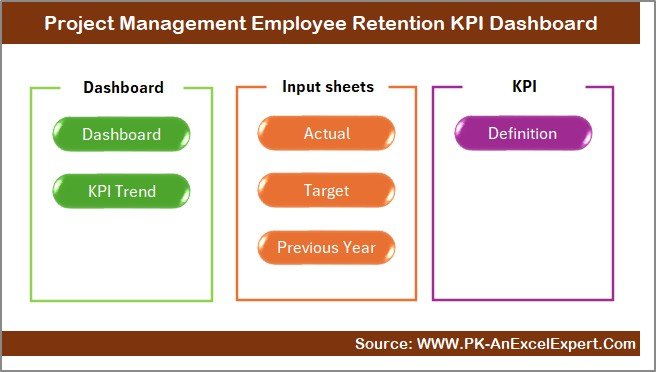
This ready-to-use Excel dashboard is smartly divided into seven worksheets that make your KPI tracking efficient and user-friendly:
Home Sheet
- Acts as a clickable index page
- Includes 6 navigation buttons to jump to various sections quickly
- Helps new users understand the structure of the file in seconds
Click to Purchases Project Management Employee Retention KPI Dashboard in Excel
Dashboard Sheet
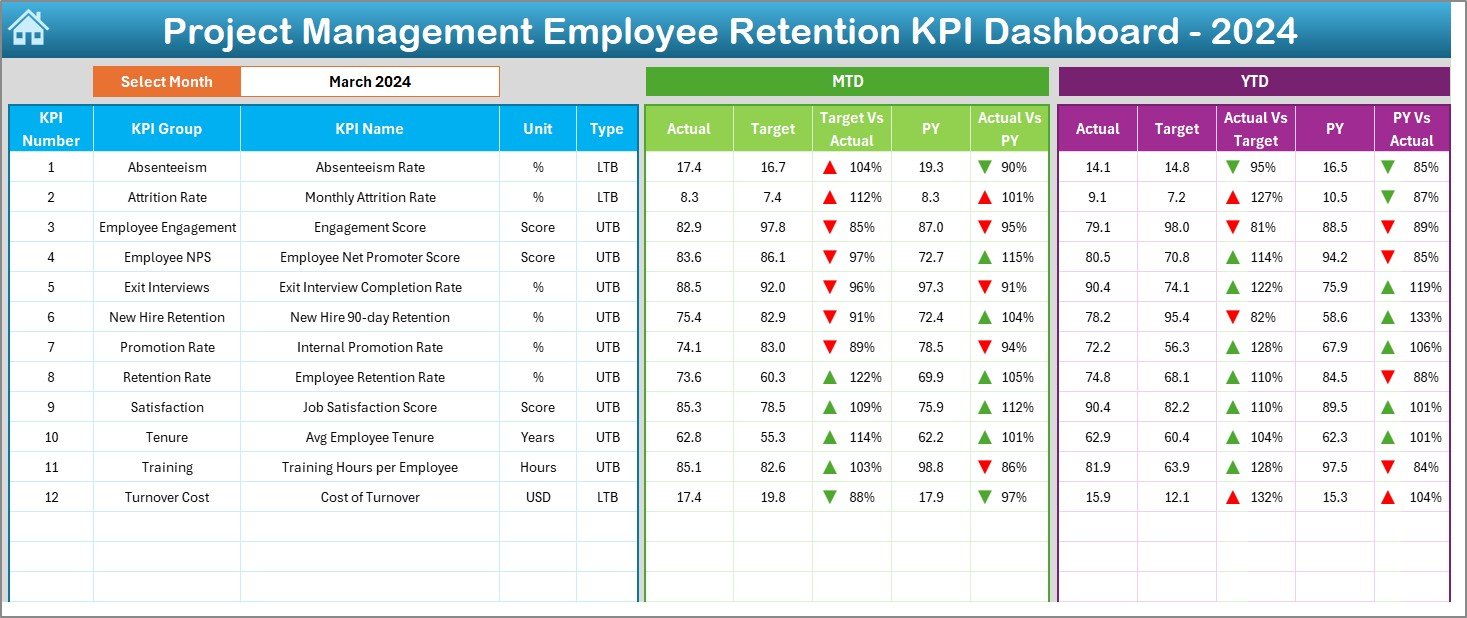
- This is your main summary view
- Use cell D3 to select a month from the dropdown
Displays:
- MTD Actual, Target, and Previous Year
- YTD Actual, Target, and Previous Year
- Automatically highlights gaps using conditional formatting with up/down arrows
KPI Trend Sheet
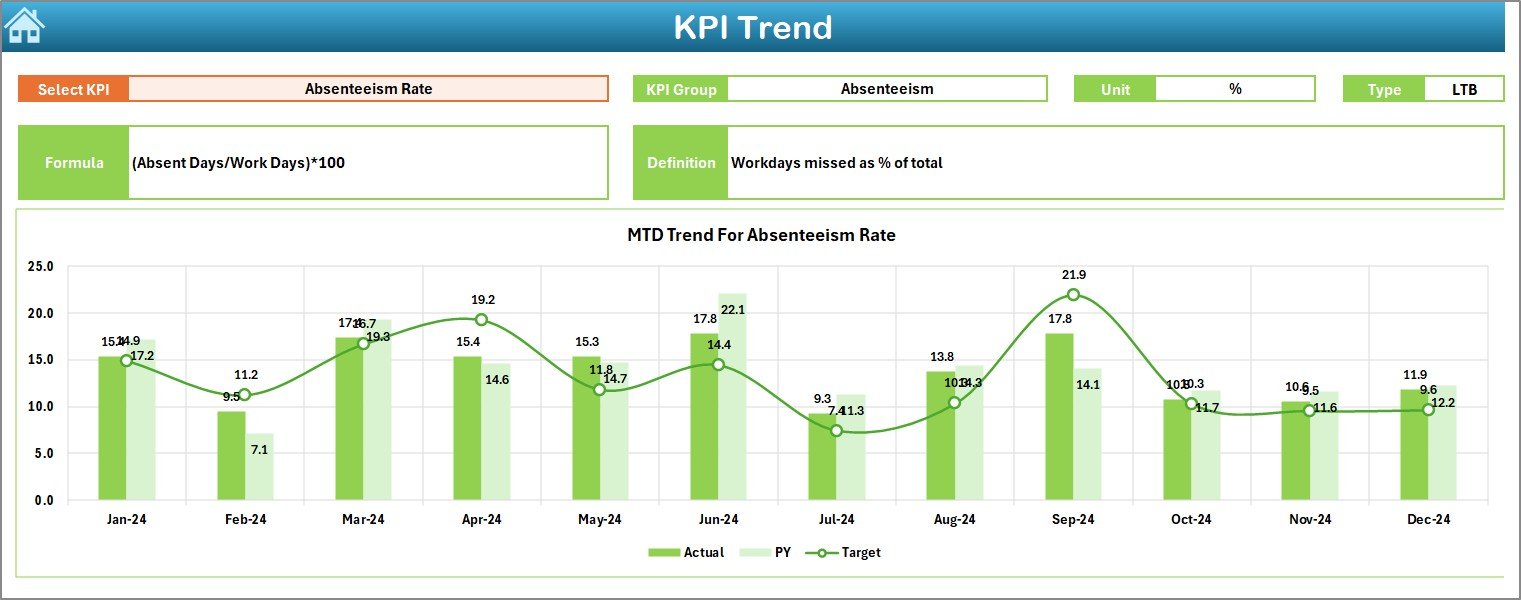
- Select any KPI from dropdown in cell C3
Shows:
- KPI Group
- Unit
- KPI Type (Lower the Better or Upper the Better)
- KPI Formula
- KPI Definition
View MTD and YTD trend charts for:
- Actual
- Target
- Previous Year values
Actual Numbers Input Sheet
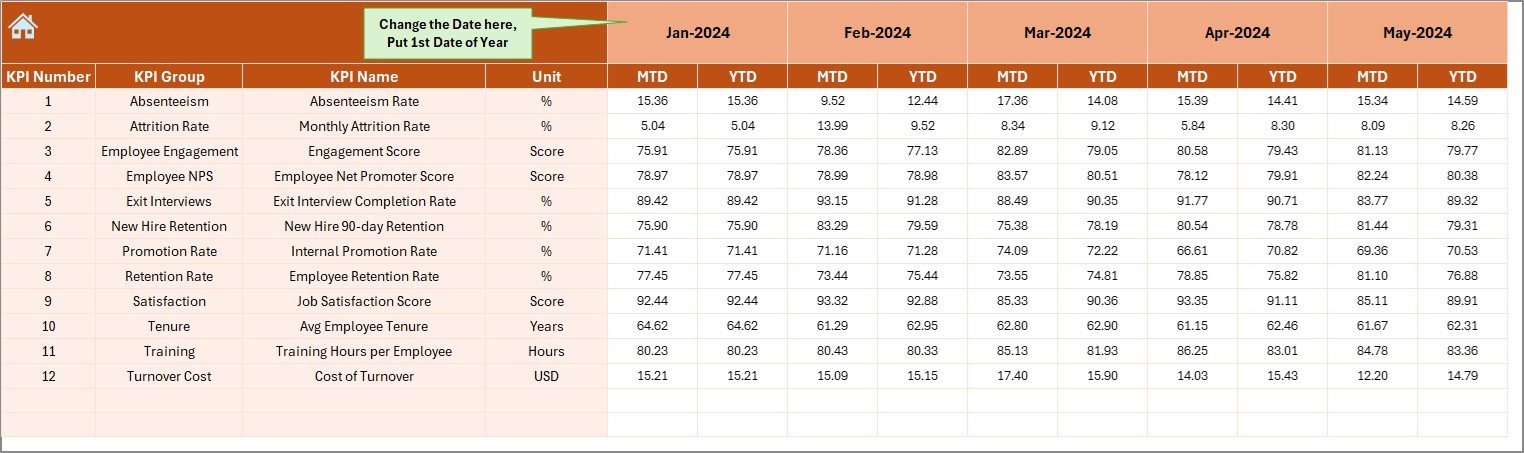
- Enter actual data for MTD and YTD values
- Simply change the first month of the year in cell E1
- Easy to use with clear labeling and layout
Target Sheet
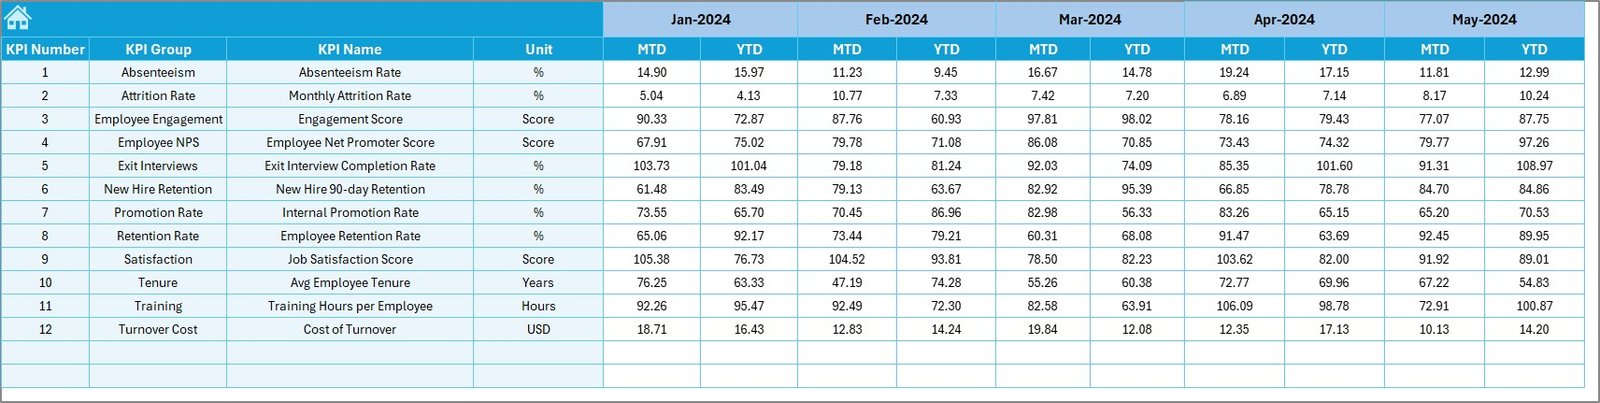
- Input target numbers for each KPI
- Maintain both MTD and YTD targets monthly
Previous Year Number Sheet
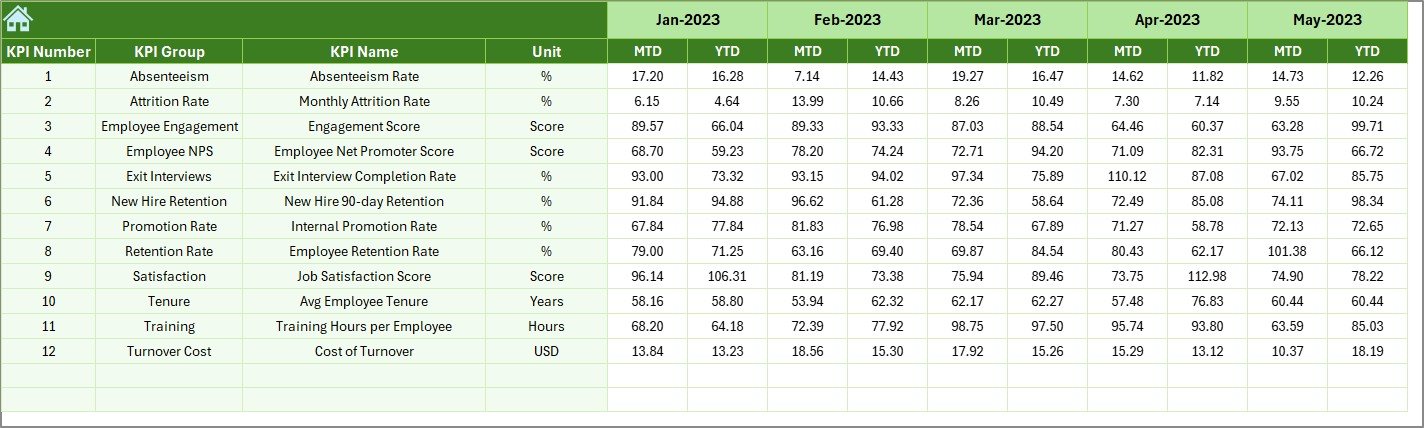
- Record last year’s data to compare trends
- Structure mirrors the actual input sheet for consistency
KPI Definition Sheet
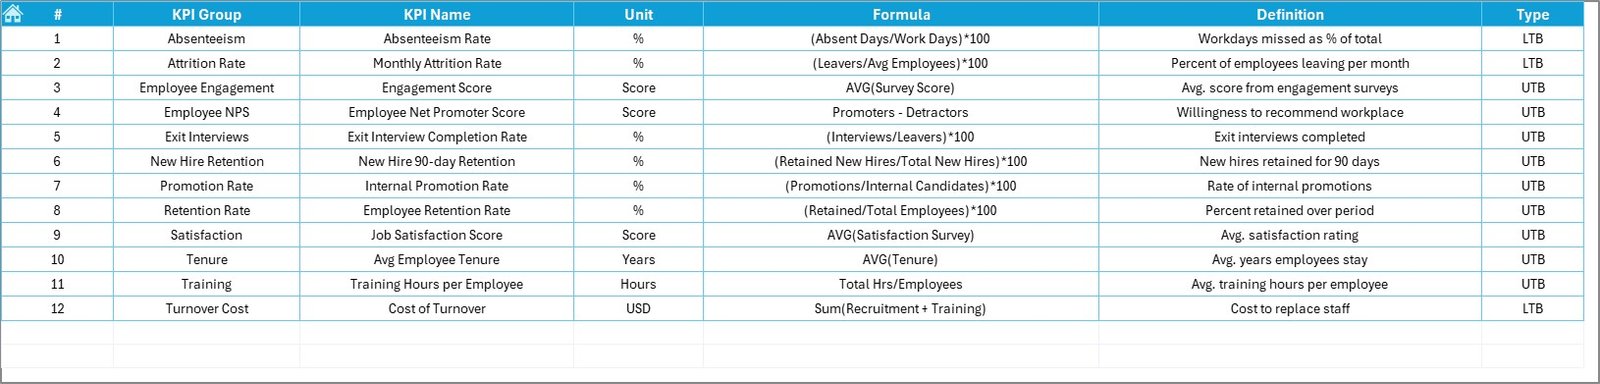
- Maintain a library of KPI definitions
Includes:
- KPI Name
- KPI Group
- Unit
- Formula
- Simple KPI definition
Click to Purchases Project Management Employee Retention KPI Dashboard in Excel
Advantages of Using the Employee Retention KPI Dashboard in Excel
✨ Boosted Retention Rates
Track key indicators like voluntary turnover, retention rate, and employee satisfaction to improve your HR strategy.
✨ Improved Decision Making
Use real-time MTD and YTD data to identify trends and take proactive steps.
✨ Customizable Visuals
Charts, arrows, and conditional formatting make it easy to interpret data at a glance.
✨ Time-Saving Automation
Drop-downs, formulas, and dynamic charts reduce manual work.
✨ Team Alignment
Create shared goals and benchmarks for HR and project teams using KPI definitions and target comparisons.
Best Practices for Employee Retention KPI Tracking
To make the most of your KPI dashboard, follow these tested best practices:
1. Define Clear KPIs
Choose KPIs that align with your business goals, such as:
- Employee Turnover Rate
- Retention Rate
- Training Completion Rate
- Internal Mobility Rate
2. Set Monthly and Annual Targets
Use past performance and industry benchmarks to define MTD and YTD goals.
3. Review Data Monthly
Set a schedule to update and analyze the dashboard every month.
4. Use the Dashboard in Team Meetings
Discuss KPI trends with your HR and project management team to align on retention strategies.
5. Keep Your Definitions Consistent
Always refer to the KPI Definition Sheet to avoid confusion.
How Does This Dashboard Help Project Managers?
Project Managers often juggle multiple roles. By using this dashboard, they can:
- Monitor how retention impacts project continuity
- Spot team satisfaction trends early
- Justify HR resource allocation based on metrics
- Align project timelines with employee availability
This tool provides the strategic visibility managers need to support sustainable project success.
Real-World Example: KPI Breakdown
Let’s say your KPI is Voluntary Turnover Rate.
- Unit: Percentage (%)
- Formula: (Voluntary Leavers / Total Employees) * 100
- Type: LTB (Lower the Better)
In the dashboard:
- You can compare this month’s actuals to the target
- Analyze trends for the past 12 months
- Spot seasonal patterns or internal policy impacts
Enhancing the Dashboard Further
Want to take it up a notch? Here are ways to make your dashboard even more powerful:
- ✅ Add filters to compare departments or job roles
- ✅ Include pivot tables for deep dive analysis
- ✅ Integrate with Power BI for advanced visualizations
- ✅ Use Excel VBA to automate repetitive tasks like data refresh
Conclusion
The Project Management Employee Retention KPI Dashboard in Excel helps you take charge of your people strategy. With just a few clicks, you get full visibility into how well you’re retaining your team, how performance stacks up against goals, and where you need to act.
Frequently Asked Questions (FAQs)
1. What KPIs are included in the dashboard?
Common KPIs include Retention Rate, Voluntary Turnover Rate, Internal Mobility, Training Completion Rate, and Time to Fill.
2. Can I customize the dashboard for my industry?
Yes, the Excel file is fully editable. You can change KPIs, targets, layouts, and charts.
3. Is this dashboard suitable for non-HR users?
Absolutely. It’s designed for project managers, team leads, and HR personnel alike.
4. How do I update the monthly data?
Go to the “Actual Numbers Input” sheet and update MTD and YTD values for the current month. Use E1 to set the year’s start.
5. Is Excel the only software needed?
Yes, there’s no need for external tools or licenses. The dashboard runs entirely on Microsoft Excel.
6. Can I track past year comparisons?
Yes, the dashboard includes a “Previous Year Numbers” sheet to analyze historical trends.
Click to Purchases Project Management Employee Retention KPI Dashboard in Excel
Visit our YouTube channel to learn step-by-step video tutorials