Public broadcasting organizations play a critical role in delivering educational, cultural, informational, and entertainment content to the public. These organizations often operate under government regulations and public funding models. Therefore, they must carefully manage budgets, monitor production costs, analyze revenue streams, and evaluate program performance.
However, many broadcasting organizations still rely on manual reports, scattered spreadsheets, and disconnected systems to track program performance and advertising revenue. As a result, decision-makers often struggle to analyze financial performance, monitor advertising sales, and evaluate programming efficiency.
Therefore, modern broadcasting organizations increasingly adopt data visualization tools like Power BI to gain clear and actionable insights.
One powerful analytics solution is the Public Broadcasting Dashboard in Power BI. This interactive dashboard helps broadcasting organizations track program performance, monitor production costs, analyze advertising revenue, and evaluate operational efficiency in a structured and visual way.
Instead of analyzing multiple reports, broadcasting managers can monitor all critical performance indicators from a single centralized dashboard.
In this comprehensive guide, you will learn:
-
What a Public Broadcasting Dashboard in Power BI is
-
Why broadcasting organizations need this dashboard
-
Key features of the dashboard
-
Important broadcasting KPIs
-
Advantages of using the dashboard
-
Best practices for implementation
-
Frequently asked questions
Let’s explore everything step by step.
Click to Purchases Public Broadcasting Dashboard in Power BI
What is a Public Broadcasting Dashboard in Power BI?
A Public Broadcasting Dashboard in Power BI is a data visualization tool designed to monitor and analyze broadcasting operations. It combines multiple performance indicators, operational metrics, and financial data into a single interactive interface.
The dashboard collects data from broadcasting systems, advertising platforms, and financial records. Then, it converts that data into visual charts, cards, and reports that are easy to understand.
As a result, broadcasting managers can quickly identify performance trends, monitor advertising sales, track production costs, and evaluate programming effectiveness.
For example, broadcasting organizations can analyze:
-
Total number of programs produced
-
Advertising revenue generated
-
Production costs for different program types
-
Ad slot sales performance
-
Revenue distribution across channels
-
Regional broadcasting performance
Therefore, the dashboard enables broadcasting organizations to make faster and more accurate decisions.
Why Do Broadcasting Organizations Need a Dashboard?
Broadcasting organizations manage large volumes of operational and financial data every day. Without proper analytics tools, analyzing this information becomes difficult.
A dashboard solves this problem by presenting data in a clear and structured format.
Here are several reasons why broadcasting organizations need a dashboard:
1. Monitor Financial Performance
Broadcasting organizations must track production costs, advertising revenue, and overall financial performance. A dashboard allows managers to quickly identify revenue trends and cost patterns.
2. Track Advertising Slot Sales
Advertising plays a major role in broadcasting revenue. Therefore, monitoring sold and unsold ad slots helps organizations optimize revenue opportunities.
3. Analyze Program Performance
Different types of programs perform differently. A dashboard helps analyze which program types generate higher revenue or attract more viewers.
4. Evaluate Language and Regional Reach
Broadcasting organizations often produce programs in multiple languages and target different regions. The dashboard helps evaluate audience coverage across languages and regions.
5. Improve Strategic Decision Making
Because the dashboard provides real-time insights, managers can quickly adjust programming strategies, advertising policies, and funding allocations.
Click to Purchases Public Broadcasting Dashboard in Power BI
Key Features of the Public Broadcasting Dashboard in Power BI
The Public Broadcasting Dashboard in Power BI includes five interactive analytical pages. Each page focuses on a different aspect of broadcasting performance.
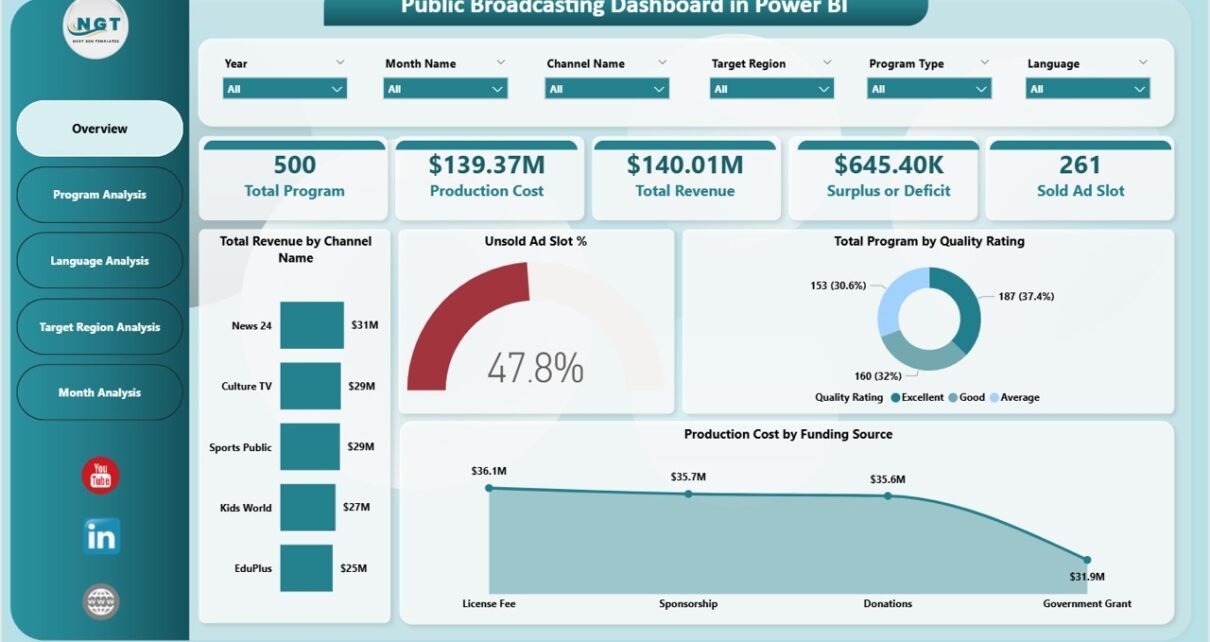
1. Overview Page
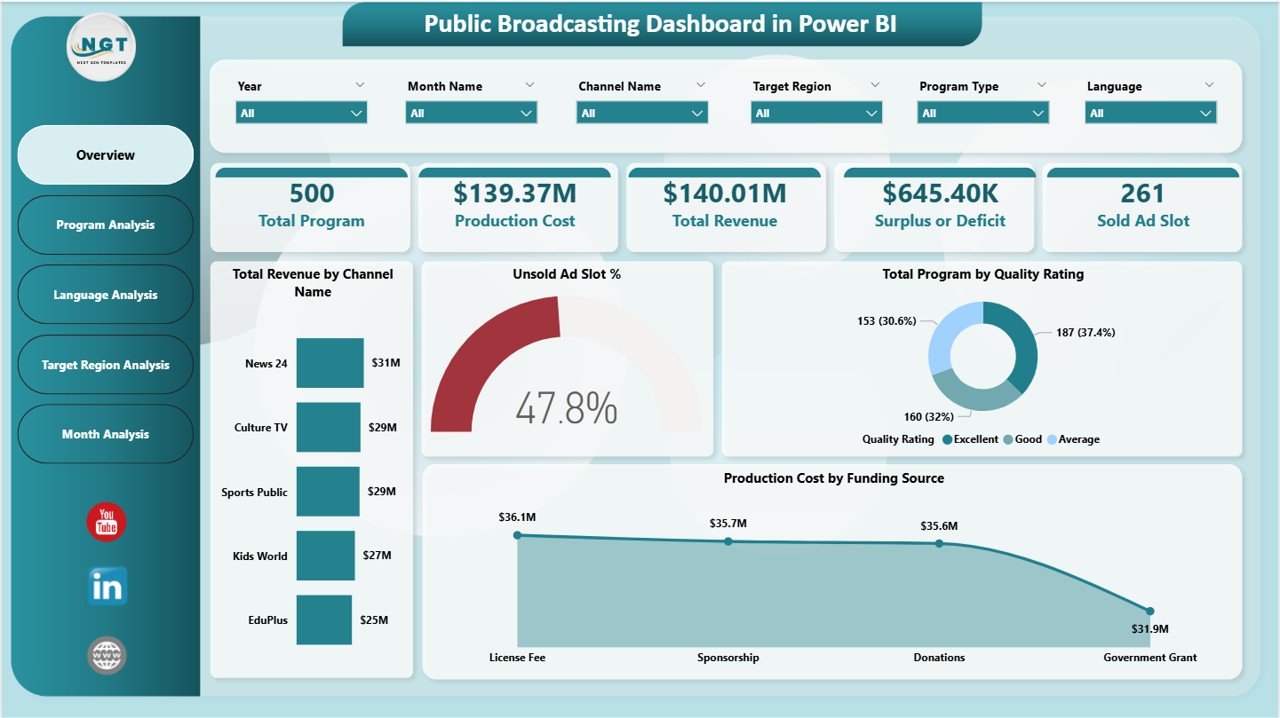
The Overview Page provides a quick summary of the entire broadcasting operation. This page displays key performance indicators and high-level insights.
KPI Cards
The dashboard includes five key performance indicators:
-
Total Program – Shows the total number of programs produced.
-
Production Cost – Displays the overall production cost.
-
Total Revenue – Shows revenue generated from advertisements and broadcasting.
-
Surplus or Deficit – Displays financial balance after subtracting costs from revenue.
-
Sold Ad Slot – Shows the total number of advertisement slots sold.
Charts in Overview Page
The page also includes the following analytical charts:
-
Total Revenue by Channel Name
Shows which broadcasting channels generate the highest revenue. -
Unsold Ad Slot %
Identifies the percentage of advertising slots that remain unsold. -
Total Program by Quality Rating
Evaluates program performance based on quality ratings. -
Production Cost by Funding Source
Analyzes funding sources used for program production.
Therefore, the overview page helps managers quickly evaluate operational and financial performance.
Click to Purchases Public Broadcasting Dashboard in Power BI
2. Program Analysis Page
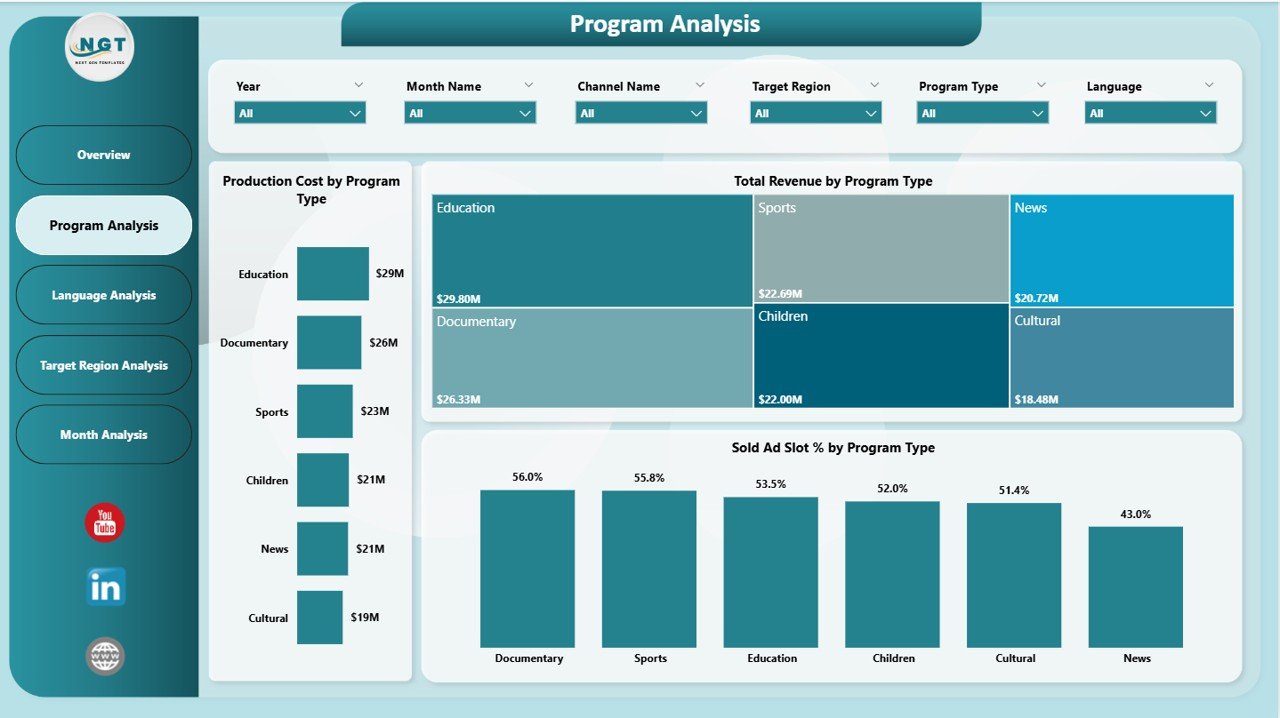
The Program Analysis Page focuses on analyzing different types of programs produced by the broadcasting organization.
This page helps managers understand which program types generate higher revenue and require more production investment.
Charts Included
-
Production Cost by Program Type
Shows production costs associated with each program category. -
Total Revenue by Program Type
Helps identify which program categories generate higher advertising revenue. -
Sold Ad Slot % by Program Type
Analyzes advertising slot sales performance across program types.
Therefore, broadcasting teams can adjust programming strategies based on program performance.
Click to Purchases Public Broadcasting Dashboard in Power BI
3. Language Analysis Page
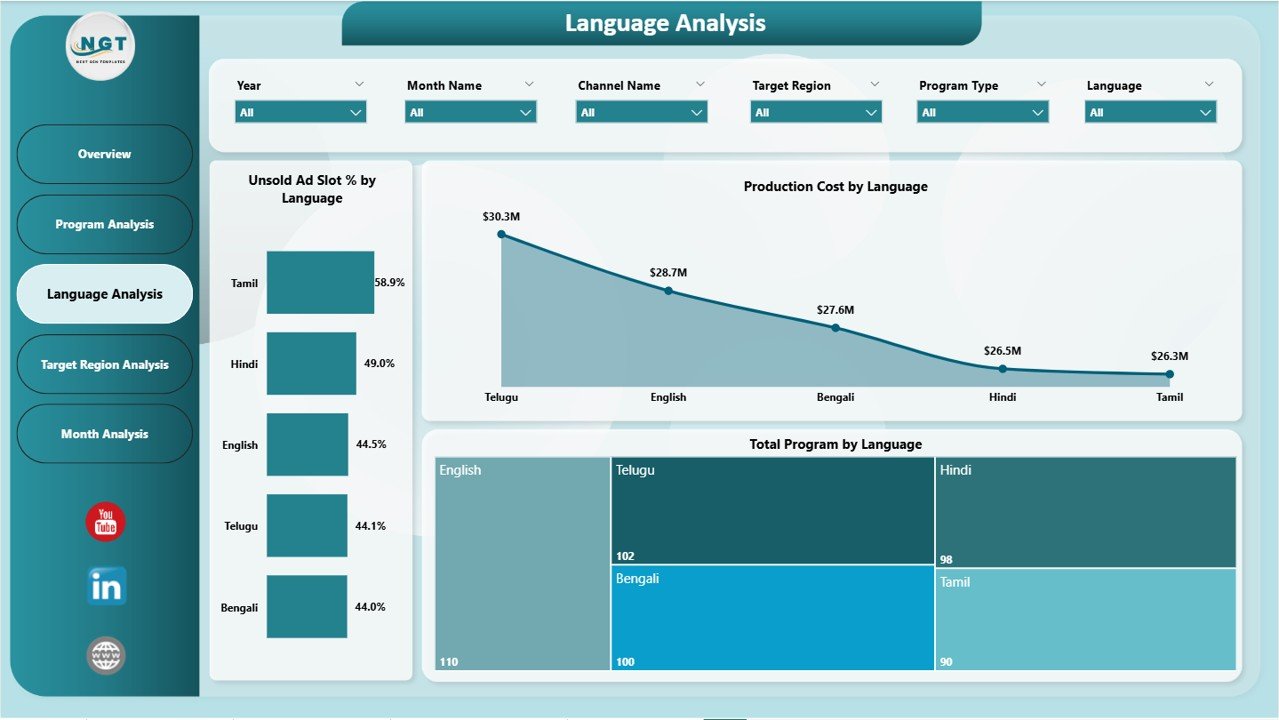
Broadcasting organizations often produce programs in multiple languages to reach wider audiences.
The Language Analysis Page helps analyze broadcasting performance based on language.
Charts Included
-
Unsold Ad Slot % by Language
Shows which languages have lower advertising demand. -
Production Cost by Language
Analyzes production investment across different language programs. -
Total Program by Language
Displays the number of programs produced in each language.
As a result, broadcasting managers can evaluate which languages require more focus or improvement.
Click to Purchases Public Broadcasting Dashboard in Power BI
4. Target Region Analysis Page
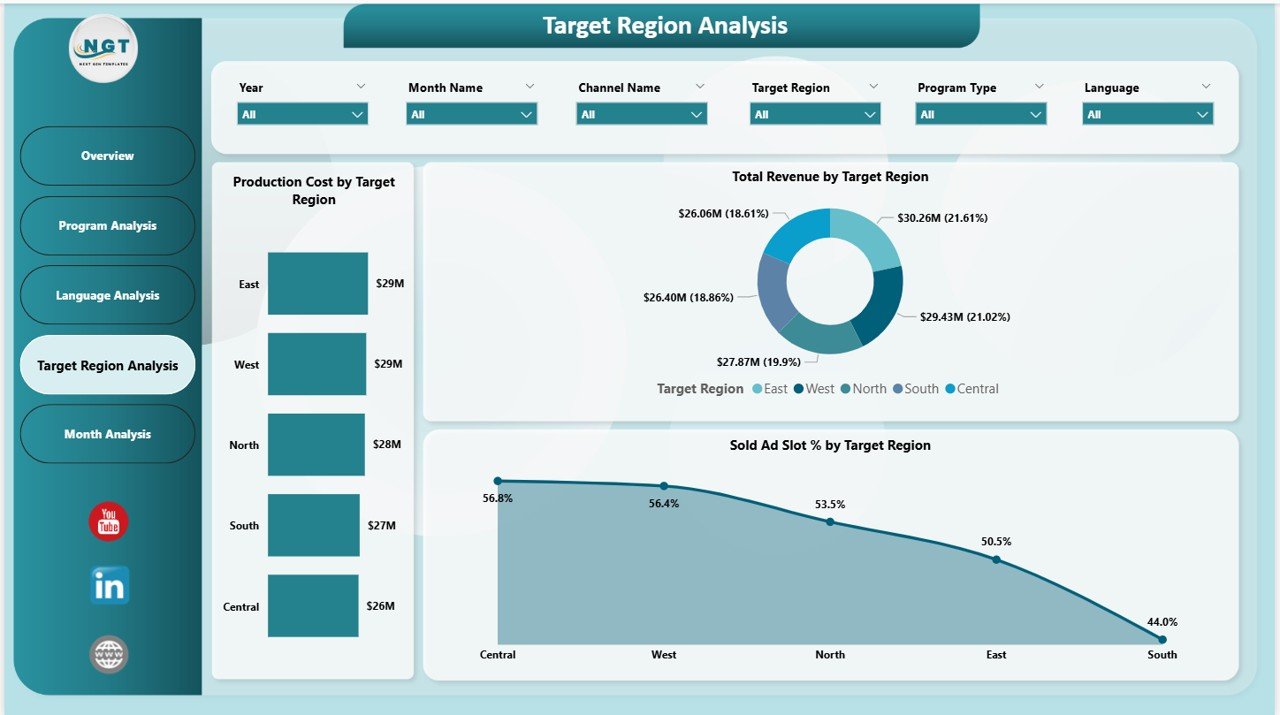
Broadcasting organizations often target multiple regions or geographic markets.
The Target Region Analysis Page helps evaluate broadcasting performance across regions.
Charts Included
-
Production Cost by Target Region
Shows production investment across different regions. -
Total Revenue by Target Region
Identifies regions generating higher revenue. -
Sold Ad Slot % by Target Region
Displays advertising slot sales performance by region.
Therefore, broadcasting organizations can identify profitable regions and improve content strategy accordingly.
5. Monthly Trends Page
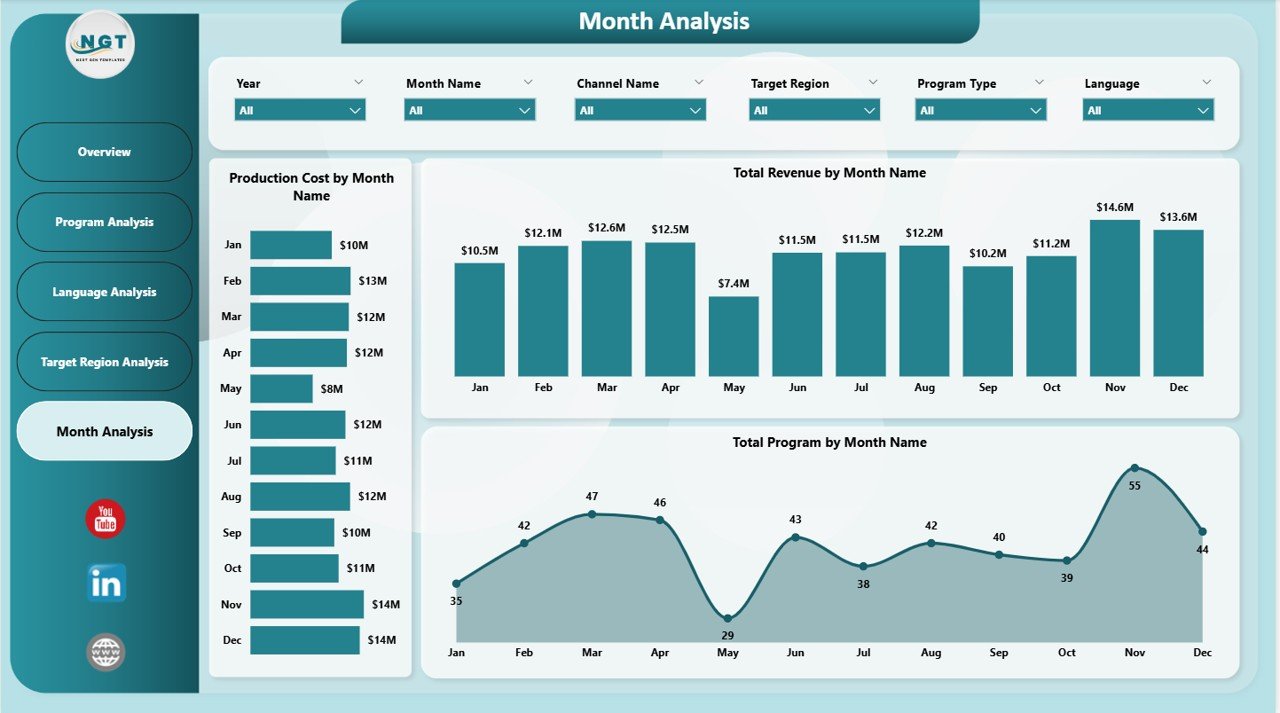
The Monthly Trends Page provides time-based analysis of broadcasting operations.
This page helps managers identify seasonal trends and operational patterns.
Charts Included
-
Production Cost by Month Name
Shows monthly production expenses. -
Total Revenue by Month Name
Displays revenue trends throughout the year. -
Total Program by Month Name
Tracks program production volume each month.
As a result, broadcasting organizations can plan future programming schedules more effectively.
Click to Purchases Public Broadcasting Dashboard in Power BI
Important KPIs Used in a Broadcasting Dashboard
A broadcasting dashboard tracks several important performance indicators.
Some commonly used KPIs include:
-
Total number of programs produced
-
Total production cost
-
Advertising revenue
-
Surplus or deficit
-
Sold advertisement slots
-
Unsold advertisement slots percentage
-
Revenue by channel
-
Program quality rating
-
Regional revenue distribution
-
Monthly production trends
These KPIs help broadcasting organizations monitor operational and financial performance effectively.
Click to Purchases Public Broadcasting Dashboard in Power BI
Advantages of Public Broadcasting Dashboard in Power BI
Implementing a broadcasting dashboard provides several operational and strategic advantages.
1. Centralized Data Visualization
The dashboard consolidates data from multiple sources into a single visual interface. Therefore, managers can analyze operations quickly.
2. Improved Financial Monitoring
Managers can easily monitor production costs, revenue streams, and financial performance.
3. Better Advertising Revenue Management
The dashboard helps identify unsold ad slots and optimize advertising strategies.
4. Enhanced Programming Decisions
Managers can identify high-performing programs and allocate resources effectively.
5. Faster Decision Making
Interactive visualizations allow decision-makers to identify trends and patterns quickly.
6. Improved Operational Efficiency
Because all data appears in one place, teams spend less time preparing reports.
Click to Purchases Public Broadcasting Dashboard in Power BI
Best Practices for the Public Broadcasting Dashboard
To maximize the benefits of the dashboard, broadcasting organizations should follow several best practices.
1. Maintain Accurate Data Sources
Always ensure that the data feeding the dashboard remains accurate and updated.
2. Monitor Key KPIs Regularly
Managers should review dashboard metrics regularly to identify operational issues early.
3. Optimize Advertising Sales Strategy
Track unsold ad slots and adjust advertising packages accordingly.
4. Evaluate Program Performance
Use analytics to identify programs that generate high engagement and revenue.
5. Improve Regional Programming
Analyze regional performance and adjust broadcasting strategies accordingly.
6. Track Monthly Performance Trends
Review monthly trends to identify seasonal changes in broadcasting performance.
Conclusion
Public broadcasting organizations operate in a complex environment where financial sustainability, audience engagement, and operational efficiency remain essential.
Therefore, organizations must rely on modern data analytics tools to manage their operations effectively.
The Public Broadcasting Dashboard in Power BI provides a powerful solution for monitoring broadcasting performance, analyzing revenue streams, evaluating program effectiveness, and optimizing advertising sales.
By integrating financial data, program metrics, and operational insights into one centralized platform, this dashboard helps broadcasting organizations make faster and smarter decisions.
As broadcasting environments continue to evolve, organizations that adopt data-driven strategies will gain a competitive advantage.
Click to Purchases Public Broadcasting Dashboard in Power BI
Frequently Asked Questions (FAQs)
What is a Public Broadcasting Dashboard in Power BI?
A Public Broadcasting Dashboard in Power BI is an analytics tool that visualizes broadcasting performance metrics such as program production, advertising revenue, and operational costs.
What data does a broadcasting dashboard analyze?
The dashboard typically analyzes data such as program production metrics, advertising slot sales, revenue performance, production costs, and regional broadcasting metrics.
Who can use this dashboard?
This dashboard is useful for:
-
Broadcasting managers
-
Media companies
-
Television networks
-
Public broadcasting organizations
-
Advertising and media analysts
Why should broadcasting organizations use Power BI dashboards?
Power BI dashboards help broadcasting organizations visualize complex data, identify performance trends, monitor financial metrics, and make data-driven decisions.
Can this dashboard track advertising performance?
Yes. The dashboard tracks sold and unsold advertising slots and analyzes advertising performance across channels, regions, and program types.
Is this dashboard customizable?
Yes. Organizations can customize the dashboard according to their operational requirements, KPIs, and broadcasting data sources.
Click to Purchases Public Broadcasting Dashboard in Power BI
Visit our YouTube channel to learn step-by-step video tutorials