In today’s fast-moving media landscape, public relations teams must measure performance with precision. However, many organizations still rely on scattered reports and manual tracking. As a result, PR managers often struggle to evaluate campaign impact, media reach, and brand visibility in real time.
Therefore, modern PR teams need a centralized and intelligent performance tracking system. That is exactly where the Public Relations KPI Scorecard in Excel becomes a game-changing solution.
This ready-to-use Excel template helps PR professionals monitor key metrics, compare actual vs target performance, and analyze trends — all in one powerful dashboard. Moreover, it transforms raw PR data into clear, actionable insights that support smarter communication strategies.
In this comprehensive guide, you will learn everything about the Public Relations KPI Scorecard in Excel, including its structure, features, advantages, best practices, and frequently asked questions.
Click to Purchases Public Relations KPI Scorecard in Excel
What Is a Public Relations KPI Scorecard in Excel?
A Public Relations KPI Scorecard in Excel is a structured performance management tool designed to track and analyze PR metrics using an interactive Excel dashboard.
Instead of reviewing multiple disconnected reports, teams can monitor all key public relations KPIs in one place. Consequently, decision-makers gain faster visibility into media performance and campaign effectiveness.
Furthermore, the scorecard allows you to:
-
Track PR performance monthly
-
Compare Actual vs Target values
-
Monitor MTD and YTD progress
-
Analyze KPI trends
-
Maintain a centralized KPI database
Because of these capabilities, the scorecard becomes an essential tool for data-driven PR management.
Why Do PR Teams Need a KPI Scorecard?
Public relations success depends heavily on measurable outcomes. However, without structured tracking, teams often rely on assumptions instead of data.
Here is why PR teams should adopt this Excel scorecard:
-
First, it improves visibility into campaign performance
-
Next, it strengthens accountability
-
Additionally, it supports data-driven decision-making
-
Moreover, it highlights underperforming areas quickly
-
Finally, it saves reporting time
Therefore, organizations that want measurable PR impact should implement a KPI scorecard.
Click to Purchases Public Relations KPI Scorecard in Excel
Key Features of the Public Relations KPI Scorecard Template
This ready-to-use template includes four well-designed worksheets that work together seamlessly. Let’s explore each component in detail.
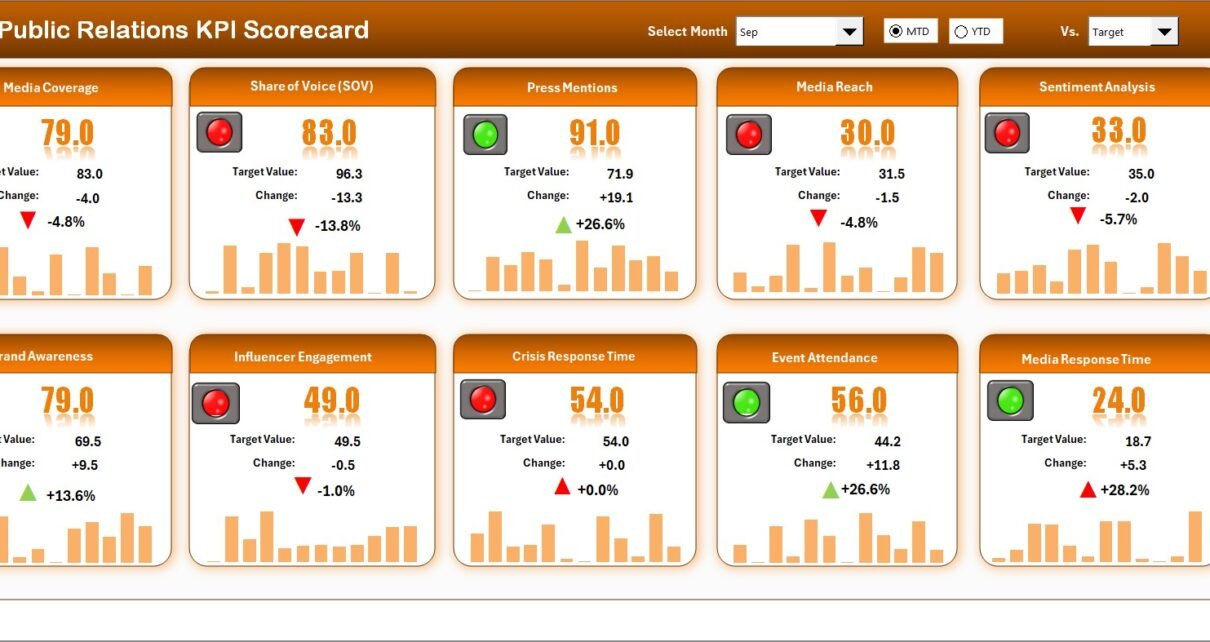
📊 1. Scorecard Sheet (Main Dashboard)
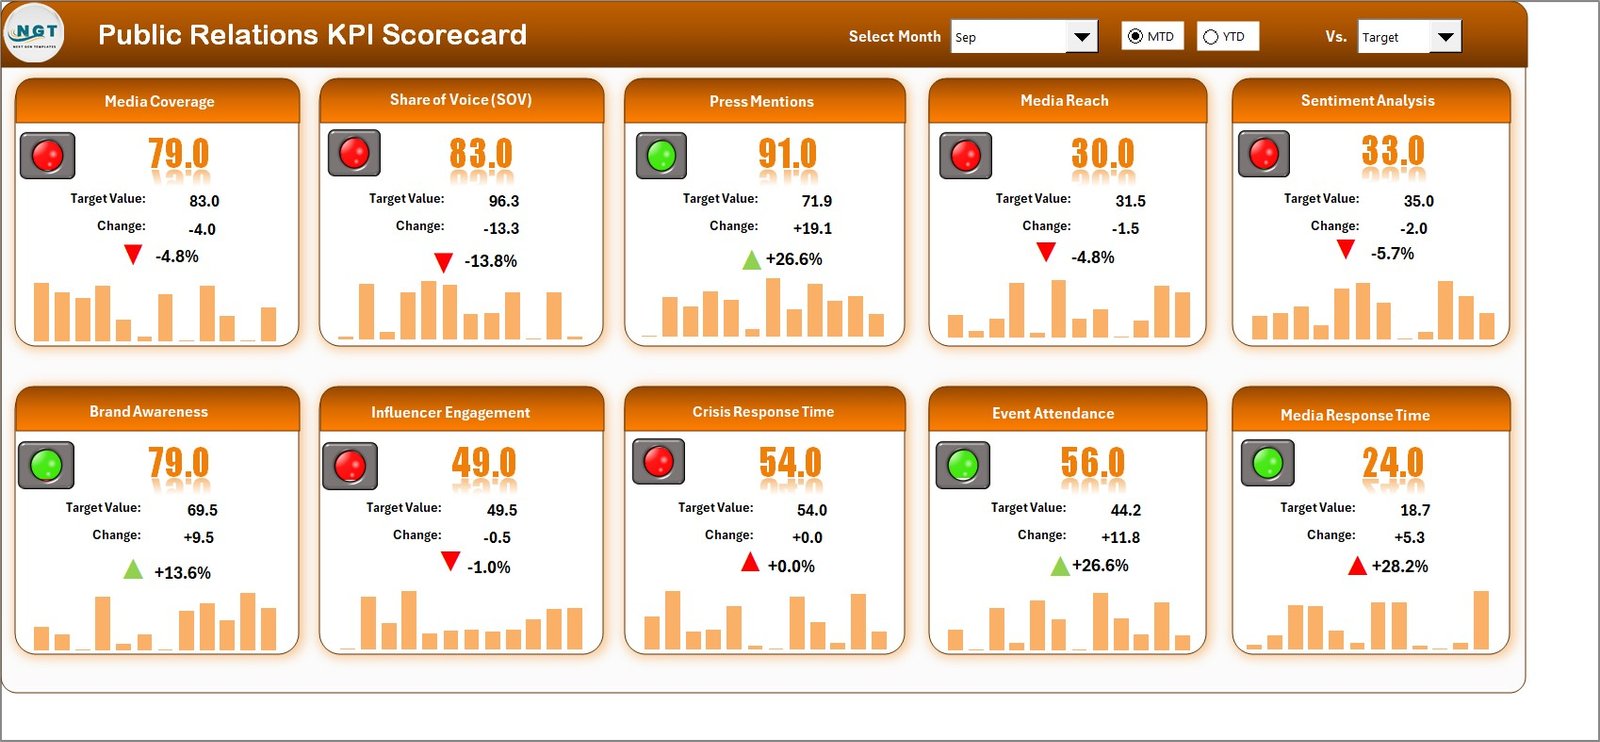
The Scorecard sheet serves as the primary interface where users monitor overall KPI performance.
🔹 Smart Dropdown Menus
Users can select:
-
Month
-
MTD (Month-to-Date)
-
YTD (Year-to-Date)
Because of these filters, the dashboard updates instantly and provides dynamic insights.
🔹 Actual vs Target Comparison
The scorecard clearly compares actual performance against defined targets for each KPI.
Benefits include:
-
Quick performance evaluation
-
Goal tracking
-
Gap identification
As a result, PR managers can immediately spot areas that require attention.
🔹 Visual Performance Indicators
The template uses color-coded conditional formatting to highlight KPI status.
For example:
-
Green indicates strong performance
-
Yellow signals caution
-
Red shows underperformance
Therefore, users can interpret results at a glance without deep analysis.
🔹 Comprehensive KPI Overview
The dashboard displays all essential KPI information in one structured view, including:
-
KPI performance
-
MTD comparison
-
YTD comparison
-
Target alignment
Because of this unified layout, reporting becomes faster and more reliable.
📈 2. KPI Trend Sheet Tab
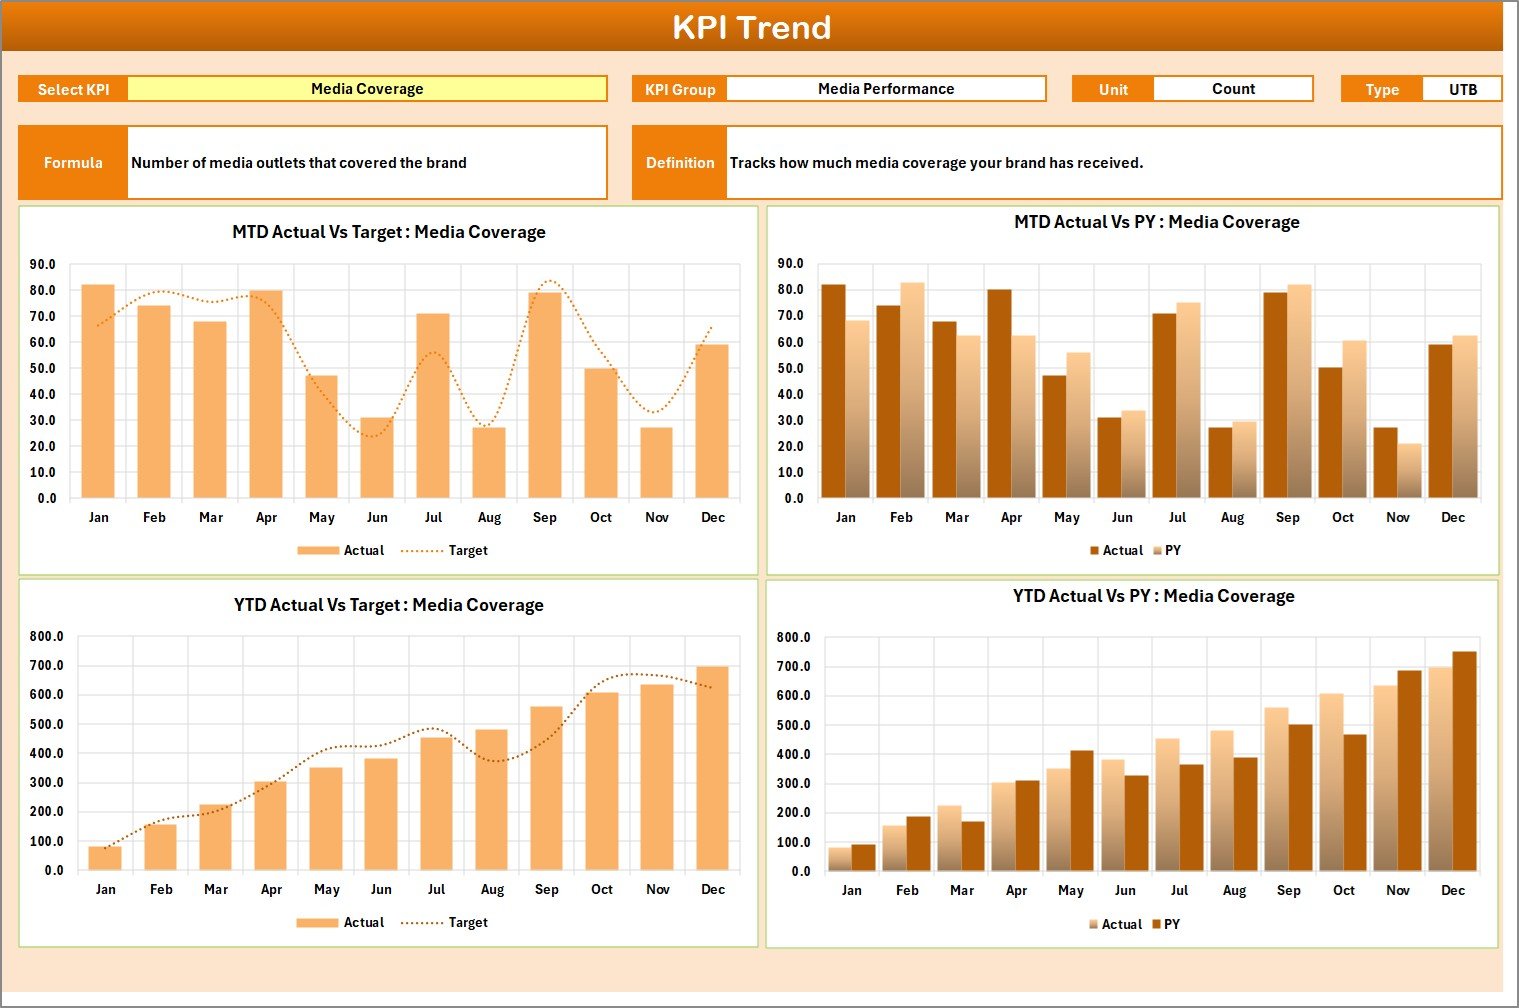
The KPI Trend sheet provides deep analytical insights for individual KPIs.
🔹 KPI Selection Dropdown (Cell C3)
Users can select any KPI from the dropdown. Immediately, the sheet updates to display detailed information.
🔹 Detailed KPI Metadata
Once selected, the sheet shows:
-
KPI Group
-
Unit of KPI
-
KPI Type (Lower the Better / Upper the Better)
-
KPI Formula
-
KPI Definition
This structure ensures complete clarity about each metric.
🔹 MTD and YTD Trend Charts
The template includes dynamic trend charts for:
-
Actual values
-
Target values
-
Previous Year (PY) values
Because of these visuals, teams can easily analyze performance patterns over time.
Click to Purchases Public Relations KPI Scorecard in Excel
🧾 3. Input Data Sheet
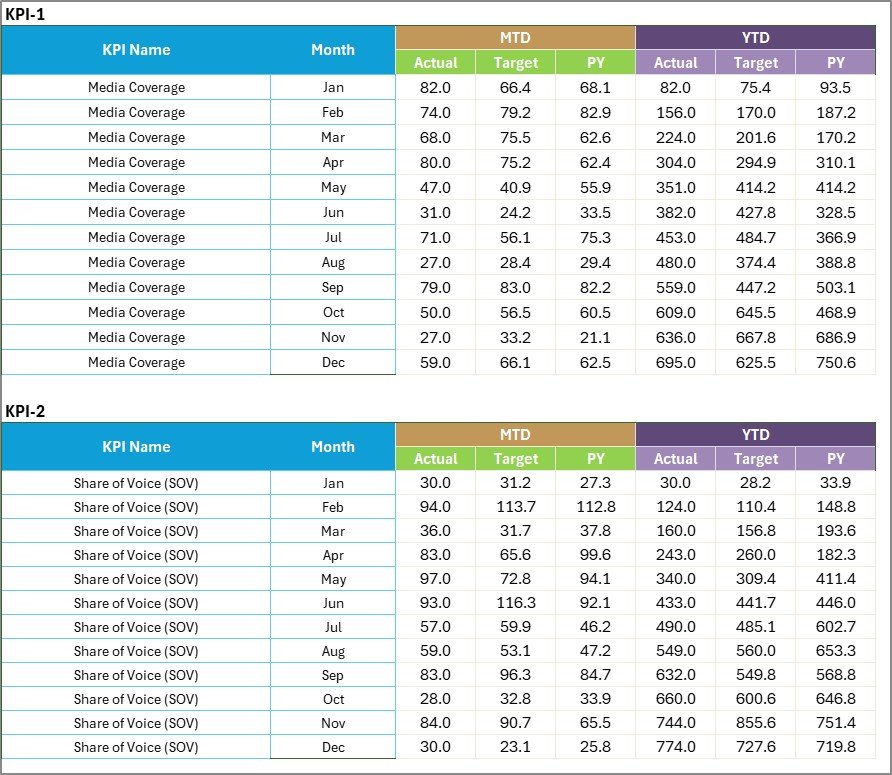
The Input Data sheet acts as the data entry engine of the scorecard.
🔹 Easy Data Entry
Users simply record:
-
Actual values
-
Target values
-
Monthly KPI data
As soon as data updates, the dashboard reflects changes automatically.
🔹 Flexible and Scalable
The sheet allows continuous updates as new PR results become available. Therefore, the scorecard always stays current and relevant.
Click to Purchases Public Relations KPI Scorecard in Excel
📚 4. KPI Definition Sheet Tab
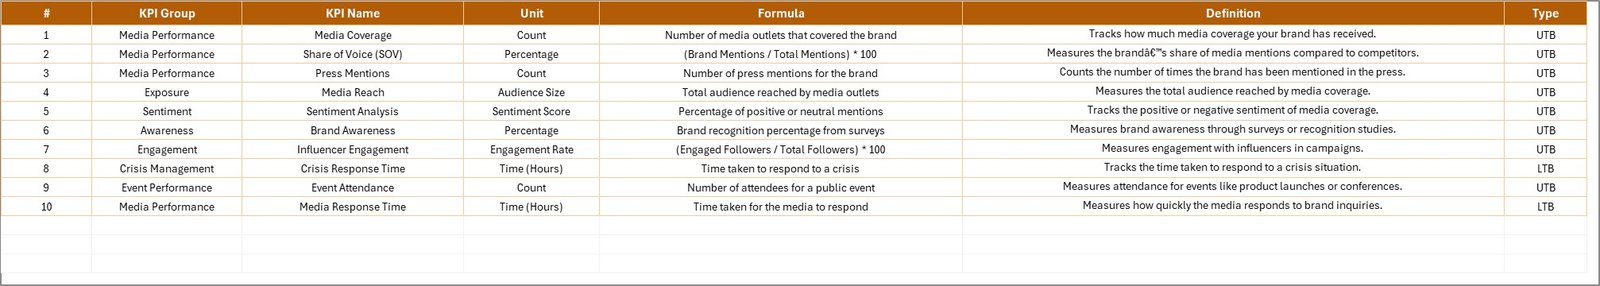
The KPI Definition sheet serves as the master reference table for all KPIs.
🔹 Information Captured
Users maintain the following fields:
-
KPI Name
-
KPI Group
-
Unit
-
Formula
-
KPI Definition
Because of this structured repository, organizations maintain KPI consistency and standardization.
How Does the Public Relations KPI Scorecard Work?
Many users worry about complexity. Fortunately, the workflow remains simple and user-friendly.
Step-by-Step Process
Step 1: Enter KPI definitions
Step 2: Input monthly actual and target data
Step 3: Select Month and view Scorecard
Step 4: Analyze trends in the KPI Trend sheet
Step 5: Monitor performance indicators
Since the template automates calculations, users only focus on data entry and analysis.
Click to Purchases Public Relations KPI Scorecard in Excel
Advantages of Public Relations KPI Scorecard in Excel
Organizations gain multiple strategic benefits when they implement this scorecard.
🚀 Better Performance Visibility
The scorecard provides a single source of truth for PR metrics. Therefore, teams understand performance instantly.
🎯 Data-Driven Decision Making
Because the dashboard shows Actual vs Target comparisons, leaders make informed strategic decisions.
⏱️ Faster Reporting
The automated dashboard eliminates manual report preparation. As a result, PR teams save valuable time every month.
📊 Clear Trend Analysis
MTD and YTD charts reveal performance direction quickly. Consequently, teams can adjust campaigns proactively.
🔄 Standardized KPI Framework
The KPI Definition sheet ensures consistent metric definitions across the organization.
🧩 Easy Customization
Excel allows users to add new KPIs, modify formulas, or adjust visuals. Therefore, the template adapts to any PR environment.
Who Should Use This PR KPI Scorecard?
This template serves many professionals and organizations.
Ideal users include:
-
Public Relations Managers
-
Corporate Communications Teams
-
Marketing Analysts
-
Brand Managers
-
Media Relations Teams
-
Agencies handling PR campaigns
-
Startup founders managing brand visibility
If your role involves PR performance tracking, this scorecard will add immediate value.
Click to Purchases Public Relations KPI Scorecard in Excel
Best Practices for the Public Relations KPI Scorecard
To maximize results, teams should follow these proven practices.
✅ Update Data Regularly
Enter KPI data monthly without delay. This habit keeps the dashboard accurate and reliable.
✅ Define KPIs Clearly
Write precise KPI definitions in the KPI Definition sheet. Clear definitions prevent reporting confusion.
✅ Review Trends Monthly
Do not rely only on snapshot performance. Instead, analyze trend charts regularly to detect patterns.
✅ Set Realistic Targets
Choose achievable targets based on historical performance. Unrealistic goals distort analysis.
✅ Use Consistent Units
Maintain the same unit format across all KPIs. Consistency improves comparability.
✅ Protect Formula Cells
Lock calculated areas to prevent accidental edits.
✅ Share Insights with Stakeholders
Export or present scorecard insights during PR review meetings. This step improves alignment across teams.
Common Mistakes to Avoid
Even powerful scorecards require proper usage. Avoid these errors:
-
Skipping monthly data updates
-
Using inconsistent KPI definitions
-
Setting unclear targets
-
Ignoring trend analysis
-
Overloading the dashboard with too many KPIs
By avoiding these mistakes, teams maintain high reporting quality.
How This Scorecard Improves PR Strategy
A strong PR strategy depends on measurable insights. This Excel scorecard strengthens strategy execution in several ways.
It helps teams:
-
Identify high-performing campaigns
-
Detect weak media coverage early
-
Optimize communication budgets
-
Improve brand visibility tracking
-
Strengthen executive reporting
Therefore, organizations move from guesswork to data-backed PR management.
Click to Purchases Public Relations KPI Scorecard in Excel
Can You Customize the PR KPI Scorecard?
Yes, and that is one of its biggest strengths.
You can easily:
-
Add new KPIs
-
Modify KPI groups
-
Change conditional formatting
-
Expand trend charts
-
Add new time periods
-
Integrate additional metrics
Because Excel offers full flexibility, the template grows with your PR maturity.
When Should You Use This Scorecard?
Teams can use this tool in multiple scenarios.
Best use cases include:
-
Monthly PR reporting
-
Campaign performance review
-
Media coverage analysis
-
Executive dashboards
-
Agency performance tracking
-
Brand visibility monitoring
In short, whenever PR performance matters, this scorecard delivers value.
Conclusion
Public relations teams can no longer rely on fragmented reports and manual tracking. Today’s competitive environment demands real-time visibility, structured KPI monitoring, and data-driven decisions.
The Public Relations KPI Scorecard in Excel provides a powerful yet simple solution. With its dynamic scorecard, detailed KPI trend analysis, and centralized data management, it empowers PR teams to track performance with confidence.
Moreover, the template improves accountability, accelerates reporting, and enhances strategic decision-making. As a result, organizations can manage their public relations efforts more effectively and achieve stronger brand impact.
If you want to transform your PR reporting process, this Excel KPI scorecard is the smart place to start.
Click to Purchases Public Relations KPI Scorecard in Excel
Frequently Asked Questions (FAQs)
❓ What is the Public Relations KPI Scorecard in Excel?
It is an interactive Excel dashboard that helps PR teams track, measure, and analyze key public relations metrics in one place.
❓ Do I need advanced Excel skills to use it?
No. The template uses simple dropdowns and automated calculations, so beginners can use it easily.
❓ Can I add new KPIs?
Yes. You can expand the KPI Definition sheet and Input Data sheet anytime.
❓ How often should I update the data?
You should update KPI data monthly to maintain accurate reporting.
❓ Can agencies use this scorecard?
Yes. PR agencies can use it to track client campaign performance and share reports.
❓ Does the scorecard support MTD and YTD analysis?
Yes. The template automatically shows both MTD and YTD comparisons.
❓ Is the template customizable?
Absolutely. You can modify KPIs, charts, and formatting based on your needs.
Click to Purchases Public Relations KPI Scorecard in Excel
Visit our YouTube channel to learn step-by-step video tutorials