Publishing teams handle dozens of titles, multiple platforms, and regional review pipelines simultaneously. Without a structured reporting tool, tracking which titles are published, which are stuck in review, and how revenue breaks down by platform and department requires hours of manual data consolidation every month. The Publishing Report in Excel solves this with 5 pre-built charts, dual-slicer filtering, and a comprehensive Information Table — all in a single Excel file that takes under 10 minutes to set up.
In this article, we walk through every page and feature of the Publishing Report in Excel so you can decide whether it’s the right fit for your publishing operations workflow. The template tracks 5 core KPIs across 3 structured report pages: Published %, Revenue by Platform, In Review % by Region, Revenue by Department, and Revenue by Month — all auto-updating when you replace the sample data. According to a 2024 Microsoft Excel productivity benchmark, teams using pre-built pivot-driven reports reduce monthly reporting time by 60–75% compared to manual spreadsheet builds.
Key Features of Publishing Report in Excel
The Publishing Report in Excel is a 4-sheet Excel workbook built entirely with native Excel features — no macros, no add-ins, no cloud dependencies. Here are the core features that make it useful for editorial teams and publishing operations managers:
5 KPI cards on the Summary Page: The Summary Page displays 5 KPI cards at the top of the sheet — covering total published titles, cumulative revenue, platform distribution, in-review count, and department-level performance. Every card recalculates instantly when a slicer filter is applied, giving teams a real-time operational snapshot with zero manual formula work.
5 interactive charts: All 5 charts — Published %, Revenue by Platform, In Review % by Region, Revenue by Department, and Revenue by Month — are pre-built and populated from the Data Sheet. They update automatically as records are added, modified, or filtered. This eliminates the need to rebuild charts each reporting cycle.
Dual-slicer filtering system: A right-side slicer on the Summary Page filters all 5 charts simultaneously. A separate left-side slicer on the Report Page slices the Information Table by any dimension — platform, region, department, or publication status. This is a critical feature for publishing managers who need to isolate specific segments during editorial board meetings.
Information Table on the Report Page: The Report Page provides row-level visibility into each publishing record — title, platform, region, department, revenue, review status, and publication date. Designed for stakeholder presentations and editorial team stand-ups, the table is clean, consistently formatted, and printer-ready.
Data Sheet + Support Sheet architecture: The Data Sheet serves as the single source of truth. Replace sample data with your own records and every chart, card, and table refreshes automatically — no formula editing required. The Support Sheet maintains reference lists for all dropdowns (platforms, regions, departments, statuses), ensuring consistent data entry across the team and reducing input errors.
Dashboard Pages Explanation
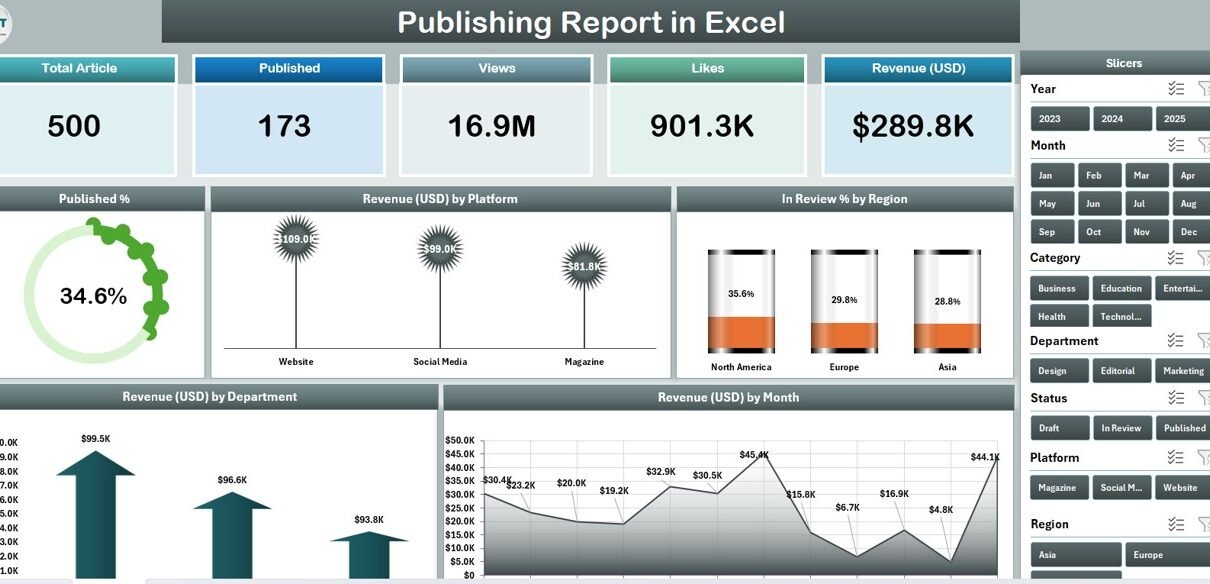
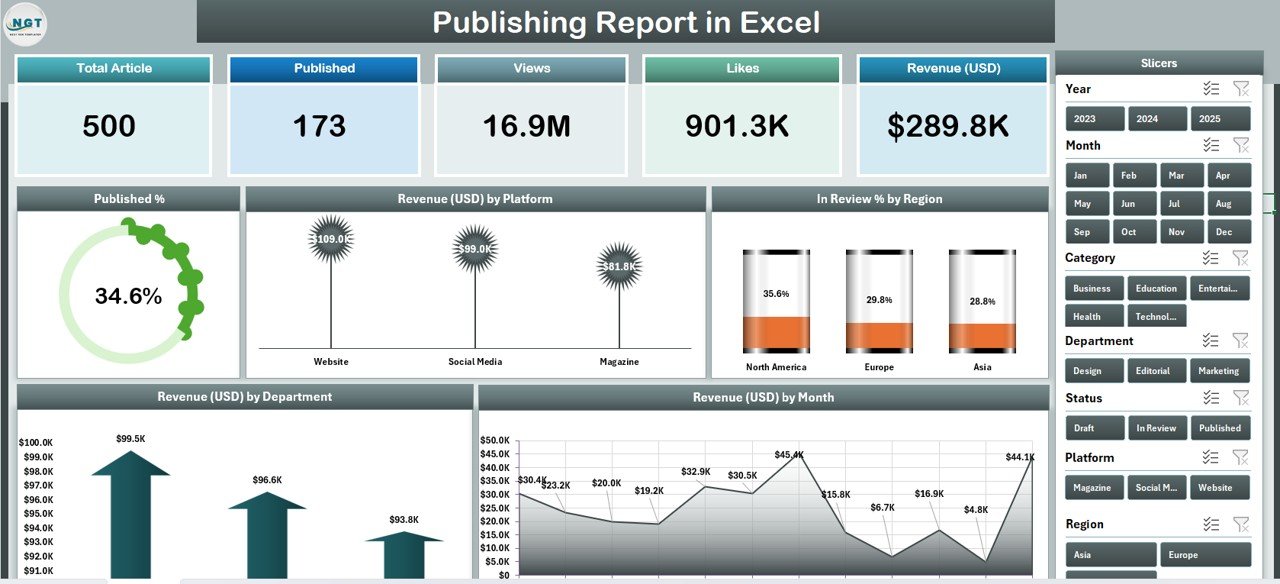
Publishing Report in Excel – Summary Page with 5 KPI Cards, Right-Side Slicer, and 5 Charts
Page 1 – Summary Page: This is the main analytics hub of the Publishing Report in Excel. It features 5 KPI cards at the top of the sheet, a right-side interactive slicer panel, and 5 pre-built charts:
- Published % — a breakdown of titles by publication status (Published, In Review, Draft, Rejected). Gives editorial directors an immediate view of pipeline completion rate.
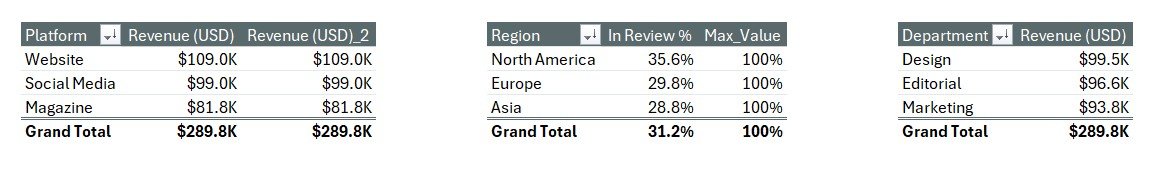
- Revenue by Platform — a platform-level revenue comparison across print, digital, audiobook, and other distribution channels. Essential for identifying which channels are generating the most revenue.
- In Review % by Region — shows the proportion of manuscripts currently in the review stage per geographic region, helping operations managers spot regional bottlenecks in the editorial pipeline.
- Revenue by Department — breaks down editorial department contributions to total revenue (Fiction, Non-Fiction, Academic, Periodicals, etc.), enabling department-level performance accountability.
- Revenue by Month — a monthly revenue trend line for tracking seasonal patterns, growth trajectories, and year-over-year comparisons.
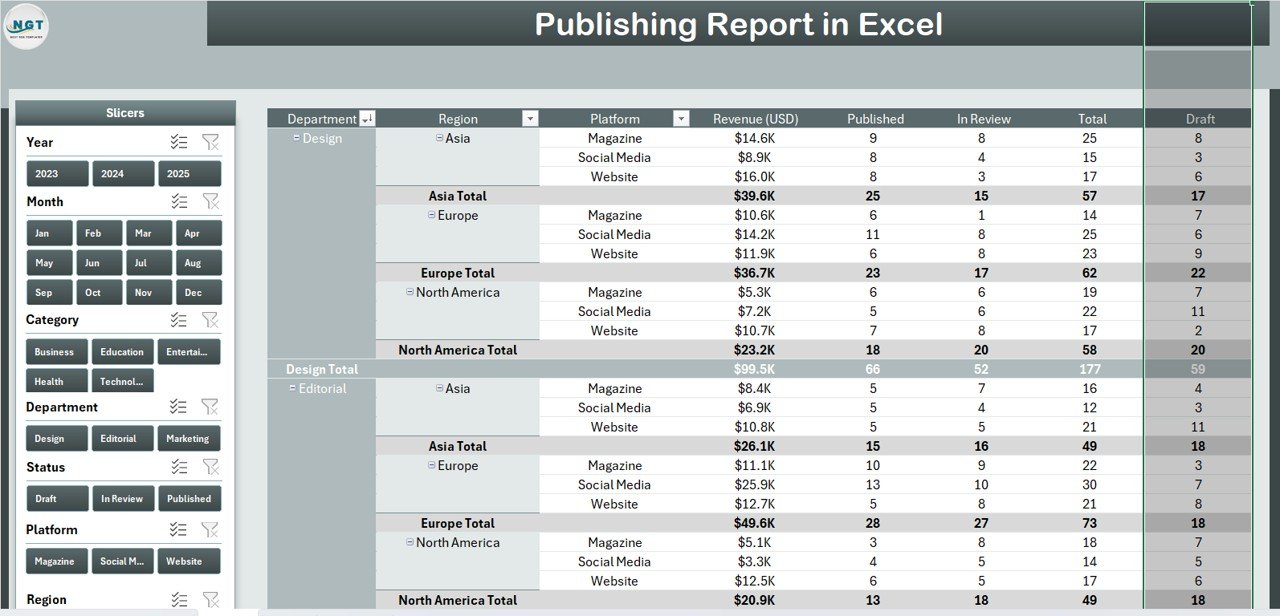
Publishing Report in Excel – Report Page with Left-Side Slicer and Detailed Information Table
Page 2 – Report Page: The Report Page provides granular, record-level visibility into the publishing dataset. A left-side slicer panel lets you filter the Information Table by any dimension. The table displays individual publishing records — including title, platform, region, department, revenue, review status, and publication date. This page is designed for editorial meetings, publisher reviews, and board-level reporting where stakeholders need to query specific records or categories on the fly.
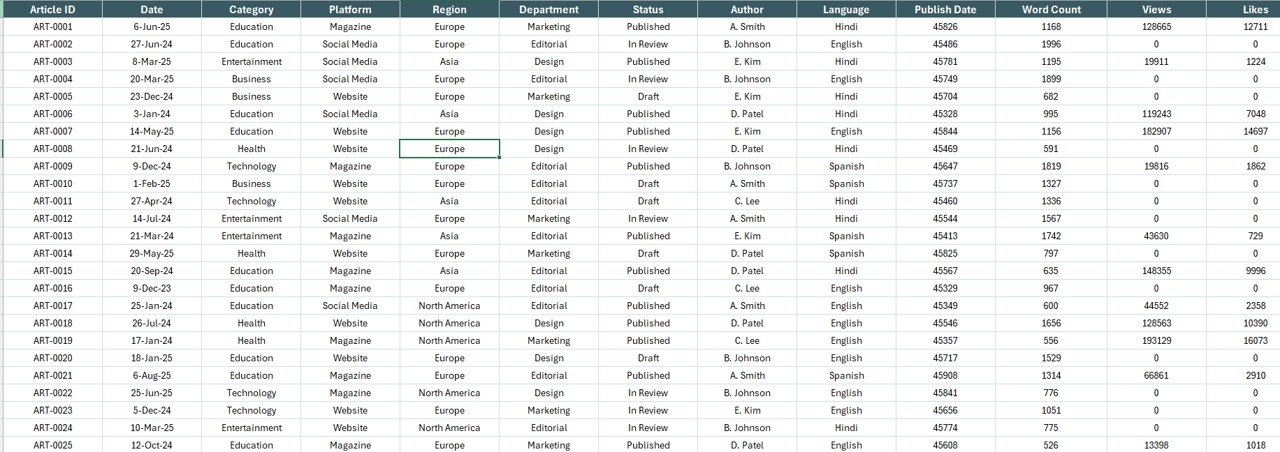
Publishing Report in Excel – Data Entry Sheet
Data Sheet: The structured input sheet where you replace sample publishing records with your own data. Fields include title, platform, region, department, revenue, review status, and publication date. All charts, KPI cards, and the Information Table update automatically when new rows are added or existing records are modified — no manual recalculation or formula updates required.
Publishing Report in Excel – Support Sheet with Reference Lists
Support Sheet: A pre-configured reference sheet containing dropdown lists for platforms, regions, departments, and publication statuses. By centralising all reference values in the Support Sheet, the template ensures consistent data entry across the team, reduces input errors, and makes it easy to add new categories (new platforms, new regions) without breaking any formulas or chart references.
Publishing Report in Excel vs. Google Sheets Version vs. Paid Publishing SaaS — Feature Comparison
| Feature | Publishing Report in Excel | Google Sheets Version | Paid SaaS (Salesforce / Publishdrive Analytics) |
|---|---|---|---|
| Cost | $7.99 one-time | Varies | $50–$200/user/month |
| Platform | ✅ Microsoft Excel Desktop | Google Sheets (browser) | Cloud only |
| Setup time | ✅ Under 10 minutes | Similar | 2–6 weeks + onboarding |
| Works offline | ✅ Yes – no internet needed | ❌ Requires internet | ❌ Cloud-dependent |
| Interactive slicers | ✅ Dual slicers (Summary + Report) | Limited | ✅ Advanced filters |
| Customisable fields | ✅ Fully editable | ✅ Editable | Requires admin config |
| 5 pre-built charts | ✅ Ready to use | Varies | ✅ Custom dashboards |
| Year-1 cost (5 users) | $7.99 total | ~$20–40 | $3,000–$12,000 |
| No subscription | ✅ One-time payment | ✅ | ❌ Monthly recurring |
For publishers and editorial teams who want structured Excel reporting without five-figure SaaS bills, the Publishing Report in Excel sits in the sweet spot.
Who Should Use This Template
Perfect for:
- Publishing managers at book publishers, magazine groups, and digital content studios who need monthly pipeline and revenue reporting
- Editorial directors tracking title performance across platforms (print, digital, audiobook) without a dedicated BI tool
- Operations analysts at academic publishers monitoring In Review %, published counts, and regional bottlenecks
- Self-publishers and small presses managing multi-platform revenue in a single Excel file they already know how to use
- Finance and reporting teams that consolidate publishing data from multiple departments into one monthly report
Not a fit if:
- You need real-time connections to publisher APIs like Ingram, Kindle Direct Publishing, or IngramSpark live feeds
- Your organisation requires SOC 2 compliance, SSO, or royalty management system integrations
- You primarily work in Google Sheets — see our Google Sheets Dashboard Templates for browser-based alternatives
- You manage 10,000+ titles per month and need a dedicated publishing ERP system
Real-World Use Cases
Aisha manages editorial operations at a mid-sized book publisher. Each quarter, she compiles revenue by platform across 40+ active titles in four regions. Using the Publishing Report in Excel, she populates the Data Sheet in under 20 minutes, then uses the Revenue by Platform chart on the Summary Page to show her leadership team which distribution channels are generating the most revenue — without paying $150/month for a dedicated analytics subscription.
Tom is a content director at a trade magazine group. He tracks the In Review % by Region every month to identify where editorial bottlenecks are building up. The right-side slicer on the Summary Page lets him filter by department in seconds and share that filtered view directly during his Monday editorial stand-up, without any additional data prep work.
Priya runs a self-publishing operation across three platforms. She uses the Publishing Report in Excel to compare Revenue by Month across Kindle, print-on-demand, and audiobook channels, spotting seasonal revenue spikes and underperforming months at a glance — all from a single Excel file she already understands.
Advantages of Publishing Report in Excel
The most significant advantage is the time savings from automation. Because all 5 charts, 5 KPI cards, and the Information Table are pivot-driven, updating the report for a new reporting period requires only replacing records in the Data Sheet — not rebuilding any charts or formulas. Publishing teams typically save 3–5 hours per month compared to manually maintained reporting spreadsheets.
The dual-slicer architecture also delivers meaningful analytical depth. Most single-page Excel reports offer a single filter panel, which means switching between a platform view and a regional view requires manually changing filter settings across multiple cells. The Publishing Report in Excel separates these into dedicated slicer panels per page — reducing the number of clicks needed to switch analytical perspectives and making the report more useful during live stakeholder sessions.
Finally, the one-time cost of $7.99 versus $50–$200/user/month for dedicated publishing analytics platforms makes this template accessible to small presses, academic publishers, and independent publishing consultants who need professional-grade reporting without enterprise-grade pricing.
Opportunities for Improvement
The Publishing Report in Excel does not include automated data import from publisher APIs or distributor platforms. Teams that receive data from Ingram, Baker & Taylor, or KDP will need to manually copy or paste records into the Data Sheet each reporting cycle. For teams with very high title volumes (1,000+ records per month), this can add 30–60 minutes of data preparation time.
The template also does not include royalty calculation logic or author-level reporting. If your team needs to track author advance recoupment, royalty rates by contract, or per-author revenue splits, a more specialised royalty management system would be a better fit than this reporting template.
Finally, since it runs in Excel Desktop, real-time multi-user collaboration is limited compared to cloud-based tools. Multiple team members can view shared copies but should coordinate data entry to avoid overwriting each other’s changes.
Best Practices
To get the most out of the Publishing Report in Excel, follow these practices:
- Update the Support Sheet before the Data Sheet: Add all new platforms, regions, departments, or publication statuses to the Support Sheet first so dropdown values are consistent from the first data entry session.
- Use consistent status naming: Inconsistent status labels (e.g., “In Review” vs “Under Review”) will split chart segments incorrectly. Standardise all status values via the Support Sheet dropdowns.
- Save a clean template copy: Keep one copy of the original template with sample data. Each month, duplicate that clean copy and replace the data rather than adding to existing rows indefinitely.
- Use the slicers in presentation mode: When presenting to stakeholders, use the right-side slicer on the Summary Page as a live filtering tool rather than pre-filtering before the meeting — the dynamic filtering makes a stronger visual impression.
Explore Relevant Templates
If you’re looking for related Excel and Power BI reporting tools, these templates from the NextGenTemplates catalogue work well alongside the Publishing Report in Excel:
- 🎬 Film & Television Report in Excel — Same report structure for film and TV production analytics
- 📊 Excel Dashboard Templates — Full-featured multi-page KPI dashboards for every industry vertical
- 📈 Power BI Dashboard Templates — Advanced interactive analytics for larger publishing datasets and multi-department reporting
- 📋 Excel Report Templates — Browse the full catalogue of Excel report templates by industry
Frequently Asked Questions
What KPIs does the Publishing Report in Excel track?
The Publishing Report in Excel tracks 5 core metrics — Published %, Revenue by Platform, In Review % by Region, Revenue by Department, and Revenue by Month — displayed across 5 KPI cards and 5 charts on the Summary Page. All metrics update automatically when you replace sample data with your own records in the Data Sheet.
How many pages does this Excel publishing report have?
The template includes 4 sheets: a Summary Page with 5 KPI cards, 5 charts, and a right-side slicer; a Report Page with a left-side slicer and a comprehensive Information Table; a Data Sheet for entering your own records; and a Support Sheet for reference lists and dropdown validation values.
Do I need any Excel add-ins or macros to use this template?
No add-ins or macros are required. The Publishing Report in Excel uses only native Excel features — pivot-based charts, slicers, and data validation — so it opens and runs correctly on any standard Microsoft Excel Desktop installation on Windows or Mac, without any additional setup.
How does this compare to dedicated publishing analytics platforms?
Dedicated publishing platforms like Salesforce or Publishdrive Analytics start at $50–$200 per user per month and require 2–6 weeks of setup and onboarding. The Publishing Report in Excel costs $7.99 as a one-time purchase, works offline, and is ready in under 10 minutes — making it the practical choice for small-to-mid-size publishing teams and independent publishers.
Can I add more titles or records to the Data Sheet?
Yes. The Data Sheet is fully editable — add as many rows as needed. The Summary Page charts, KPI cards, and the Report Page Information Table expand and update automatically as you add new records. No formula changes or chart reconfiguration is required.
Is the Publishing Report in Excel also available for Power BI?
The current template is Excel-only. For advanced interactive visuals and larger dataset support, explore our Power BI Dashboard Templates collection, which includes media and entertainment analytics templates.
What Excel version is required for this template?
The template is built for Microsoft Excel 2016 and later, including Microsoft 365, Excel 2019, and Excel 2021. It works on both Windows and Mac. Excel for Web (browser) and mobile versions may have limited slicer support — Excel Desktop is recommended for the full filtering experience.
About the Author
Built by PK — Microsoft Certified Professional with 15+ years of Excel, Google Sheets, and Power BI experience. Founder of NextGenTemplates, reaching 300K+ subscribers across YouTube channels (@PK-AnExcelExpert, @NextGenTemplates). Every template is hand-built and tested before release.
Conclusion
The Publishing Report in Excel gives editorial directors, publishing managers, and operations analysts a structured, slicer-driven reporting tool that tracks 5 core KPIs across 3 pages — without requiring any BI software, macros, or recurring subscription costs. For small-to-mid-size publishers who already work in Excel, this template eliminates the monthly manual data consolidation cycle and replaces it with a 10-minute data entry routine.
🛒 Click here to Purchase the Publishing Report in Excel
✅ Instant download · One-time payment · No subscription · Lifetime access
Visit Youtube.com/@PK-AnExcelExpert for step-by-step video tutorials on Excel reporting templates.
📅 Last updated: May 2026