Radiology and imaging departments handle large volumes of clinical, operational, and financial data every single day. However, many hospitals, diagnostic centers, and imaging labs still rely on scattered spreadsheets and manual reports. As a result, leaders struggle to track performance, control costs, and improve patient outcomes.
That is exactly why a Radiology & Imaging KPI Dashboard in Excel becomes a powerful and practical solution.
In this detailed article, you will learn what a Radiology & Imaging KPI Dashboard in Excel is, why it is essential, how it works, its page-wise structure, key KPIs, advantages, best practices, and frequently asked questions. Moreover, the language stays simple, clear, and action-oriented so that both technical and non-technical users can benefit.
Click to buy Radiology & Imaging KPI Dashboard in Excel
What Is a Radiology & Imaging KPI Dashboard in Excel?
A Radiology & Imaging KPI Dashboard in Excel is a centralized, ready-to-use Excel-based analytical template designed to monitor, analyze, and visualize key performance indicators related to radiology and imaging operations.
Instead of managing raw data across multiple files, this dashboard converts complex metrics into clear visuals and performance summaries. Consequently, radiology managers, hospital administrators, and analysts can make faster and better decisions.
Because it runs entirely in Excel, this dashboard offers flexibility, affordability, and ease of use without requiring advanced BI tools.
Why Do Radiology & Imaging Departments Need a KPI Dashboard?
Radiology departments operate under constant pressure. They must deliver accurate imaging, reduce patient wait times, control costs, and comply with regulations. However, without structured KPIs, performance gaps remain hidden.
A Radiology & Imaging KPI Dashboard in Excel helps because:
- It centralizes all KPI data in one place
- It improves visibility across operations and performance
- It reduces manual reporting effort
- It enables timely corrective actions
- It supports data-driven decision-making
As a result, departments gain clarity, control, and confidence.
How Does a Radiology & Imaging KPI Dashboard in Excel Work?
This dashboard follows a simple yet powerful workflow:
- Input Data
You enter actual values, targets, and previous-year numbers in dedicated input sheets. - Define KPIs
You clearly define each KPI with its group, unit, formula, and definition. - Automatic Calculations
Excel formulas calculate MTD, YTD, variances, and comparisons. - Dynamic Dashboards
The dashboard updates instantly based on selected month or KPI. - Trend Analysis
Trend charts highlight performance over time.
Therefore, users always work with updated and meaningful insights.
Page-Wise Structure of the Radiology & Imaging KPI Dashboard in Excel
This dashboard contains 7 well-structured worksheets, each serving a specific purpose.
Summary Page – Quick Navigation Hub
The Summary Page acts as the index sheet of the dashboard.
Key Highlights:
- Contains 6 navigation buttons
- Each button links directly to a specific worksheet
- Improves usability and navigation
- Eliminates confusion for first-time users
As a result, users move seamlessly across the dashboard.

Click to buy Radiology & Imaging KPI Dashboard in Excel
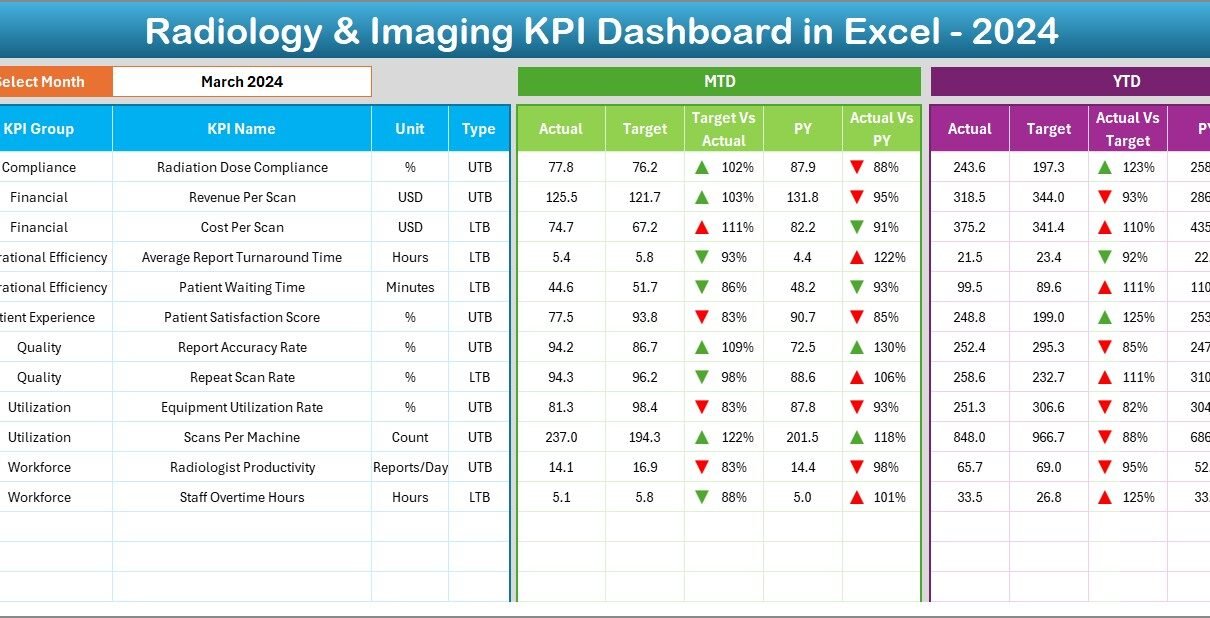
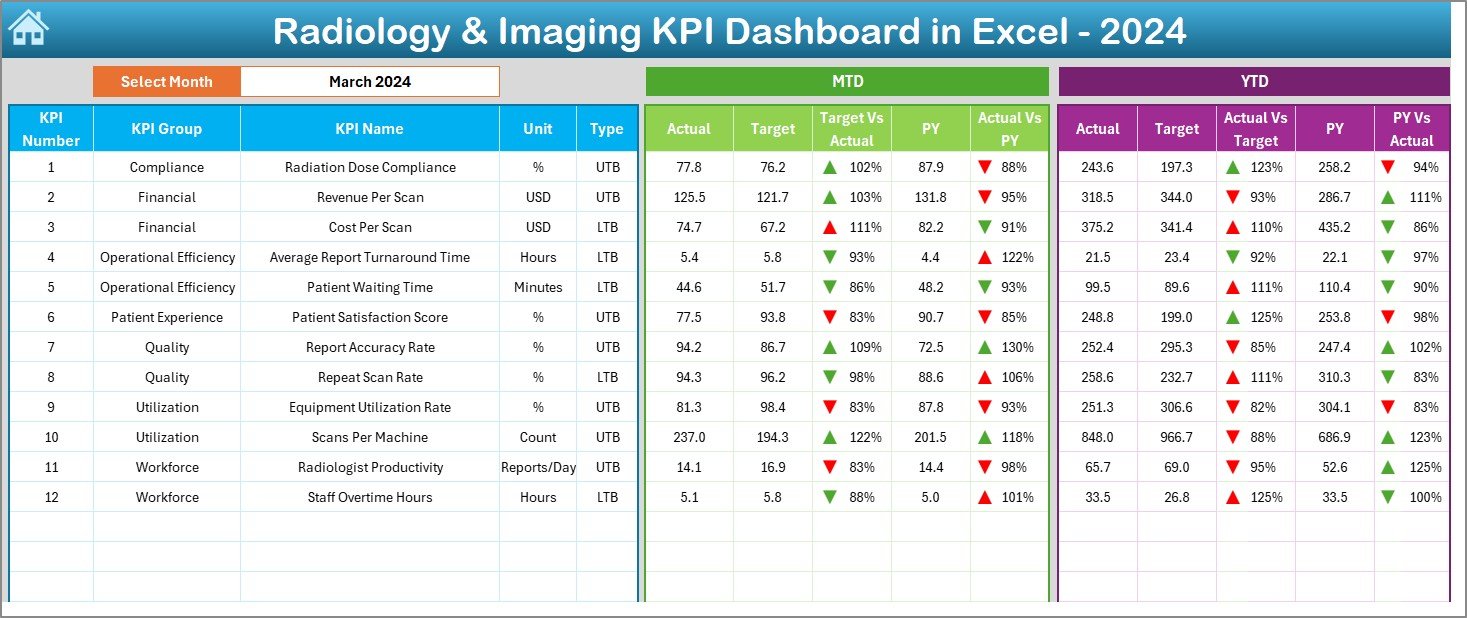
Dashboard Sheet – Central Performance View
The Dashboard Sheet is the heart of the Radiology & Imaging KPI Dashboard in Excel.
Key Features:
- Month selection dropdown in cell D3
- Automatically updates all KPIs for the selected month
- Displays both MTD and YTD metrics
KPI Comparisons Shown:
- Actual vs Target
- Actual vs Previous Year
Visual Enhancements:
- Conditional formatting with up/down arrows
- Instant identification of performance gaps
- Clear color-coded indicators
Because of this structure, decision-makers quickly understand performance status.
Click to buy Radiology & Imaging KPI Dashboard in Excel
Trend Sheet – KPI-Level Deep Analysis
The Trend Sheet enables detailed analysis of individual KPIs.
Interactive Elements:
- KPI selection dropdown in cell C3
- Automatic display of KPI details
KPI Information Displayed:
- KPI Group
- Unit of Measurement
- KPI Type (LTB or UTB)
- Formula
- Definition
Charts Included:
- MTD trend for Actual, Target, and Previous Year
- YTD trend for Actual, Target, and Previous Year
Consequently, users can easily identify performance patterns and trends.

Click to buy Radiology & Imaging KPI Dashboard in Excel
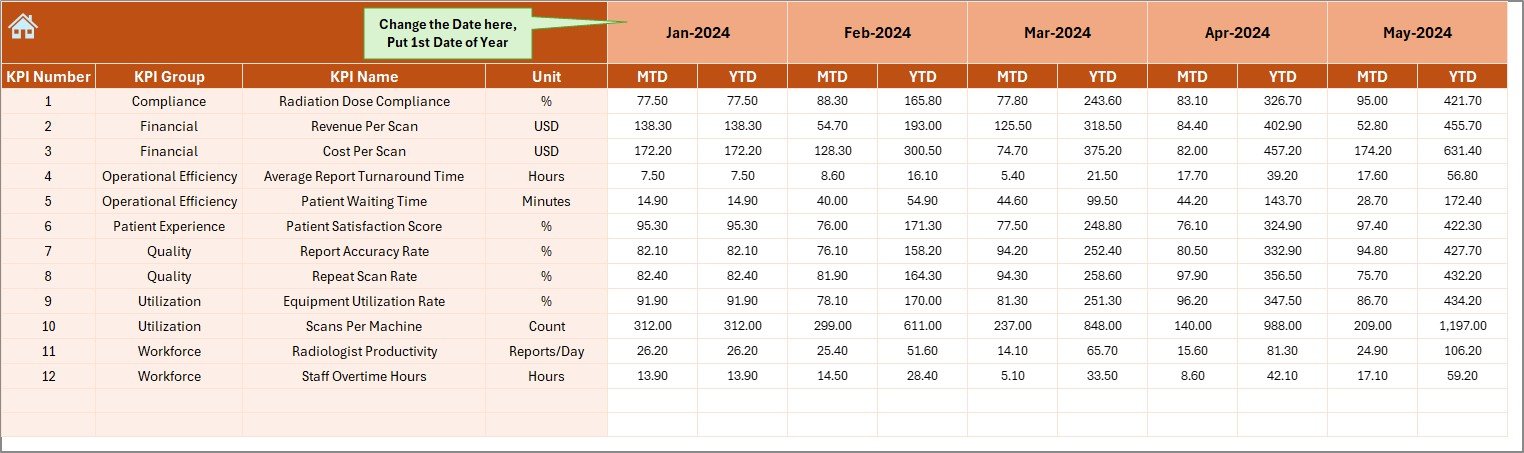
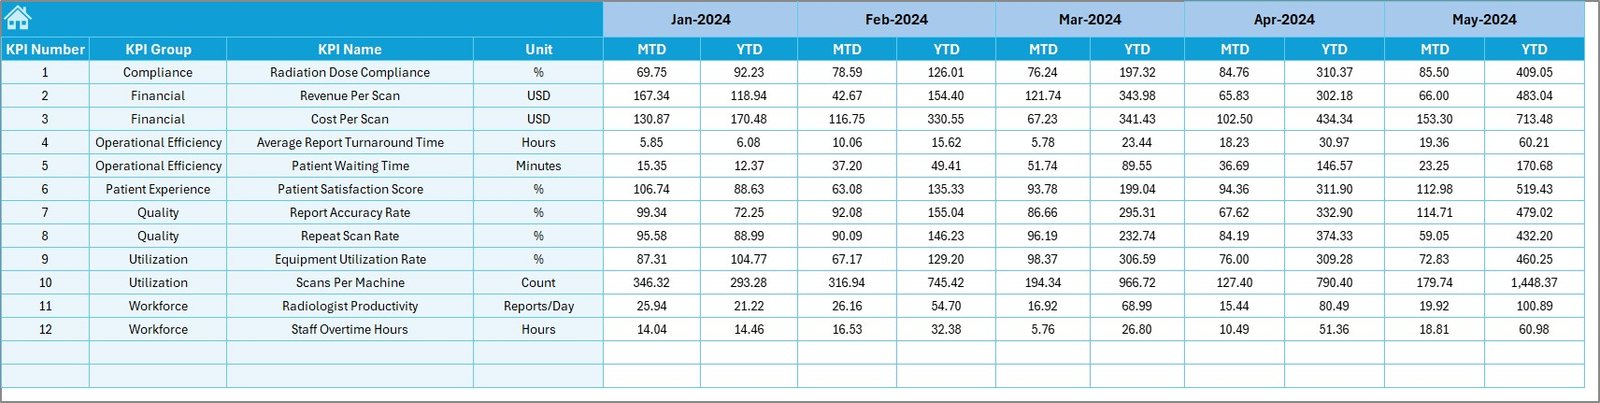
Actual Numbers Input Sheet – Real Performance Data
This sheet captures real operational data.
Key Capabilities:
- Enter MTD and YTD actual values
- Change month dynamically using cell E1
- Set the first month of the year once
- Supports structured and clean data entry
Therefore, data accuracy and consistency improve significantly.
Click to buy Radiology & Imaging KPI Dashboard in Excel
Target Sheet – Performance Benchmarks
The Target Sheet defines expected performance levels.
What You Enter:
- Monthly MTD target values
- Cumulative YTD target values
- Targets for each KPI
As a result, teams can measure performance against defined goals.
Click to buy Radiology & Imaging KPI Dashboard in Excel
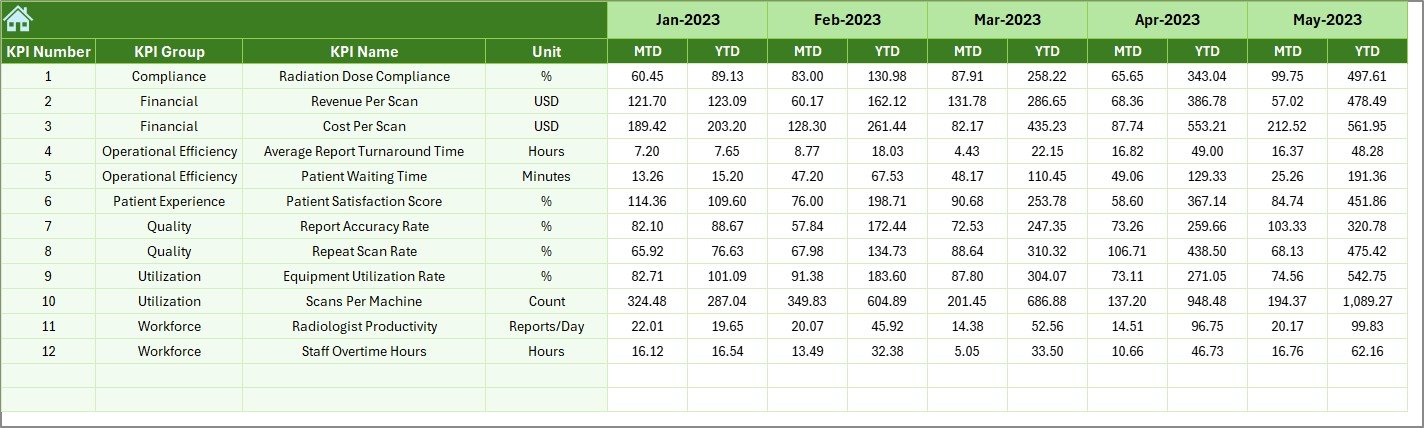
Previous Year Numbers Sheet – Historical Comparison
This sheet captures historical data.
Key Benefits:
- Enter previous-year MTD and YTD values
- Enables YoY performance comparison
- Highlights growth or decline trends
Thus, leadership gains valuable historical context.
Click to buy Radiology & Imaging KPI Dashboard in Excel
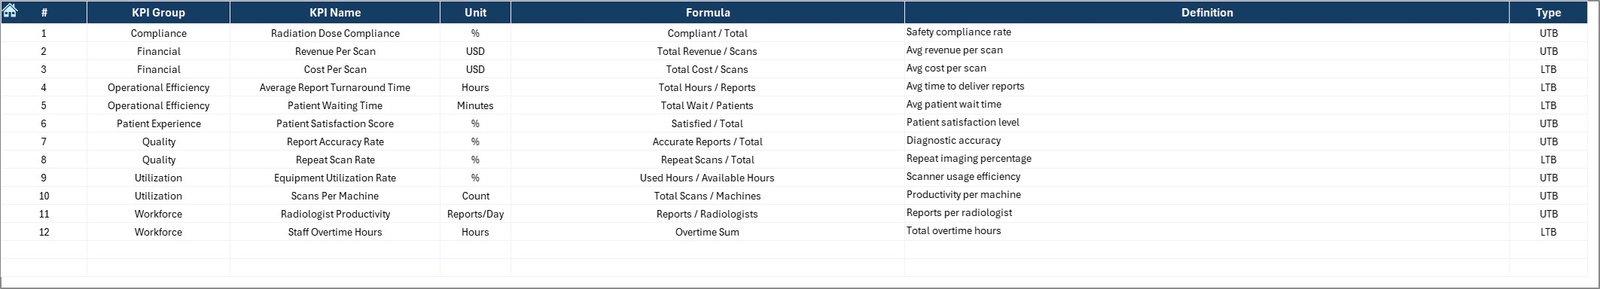
KPI Definition Sheet – KPI Governance & Clarity
The KPI Definition Sheet ensures standardization and transparency.
Fields Included:
- KPI Name
- KPI Group
- Unit
- Formula
- KPI Definition
Because of this sheet, everyone interprets KPIs the same way.
Click to buy Radiology & Imaging KPI Dashboard in Excel
What Are Common Radiology & Imaging KPIs Tracked?
A Radiology & Imaging KPI Dashboard in Excel can track many KPIs, such as:
- Patient wait time
- Report turnaround time
- Equipment utilization rate
- Scan volume per modality
- Revenue per scan
- Cost per procedure
- Repeat scan rate
- Compliance rate
- Downtime hours
- Staff productivity
These KPIs support both clinical and financial decisions.
How Does MTD and YTD Analysis Improve Decision-Making?
MTD and YTD views provide different perspectives.
MTD Benefits:
- Tracks short-term performance
- Helps spot immediate issues
- Supports quick corrective actions
YTD Benefits:
- Shows long-term trends
- Helps evaluate annual performance
- Supports strategic planning
Therefore, combining both views delivers balanced insights.
Advantages of Radiology & Imaging KPI Dashboard in Excel
Using this dashboard delivers multiple advantages.
Key Advantages:
- Centralized KPI tracking
- Reduced manual reporting effort
- Improved performance visibility
- Faster decision-making
- Easy customization
- Cost-effective solution
- No advanced BI tools required
- User-friendly interface
As a result, departments operate more efficiently.
Why Excel Still Works Best for Radiology KPI Dashboards?
Despite advanced BI tools, Excel remains highly relevant.
Reasons Excel Excels:
- Widely available and familiar
- Flexible and customizable
- Easy to maintain and update
- Integrates with hospital systems
- No licensing complexity
Therefore, Excel-based dashboards continue to deliver strong value.
Best Practices for the Radiology & Imaging KPI Dashboard in Excel
To maximize dashboard effectiveness, follow these best practices.
- Define KPIs Clearly
Always document KPI definitions, formulas, and units.
- Maintain Data Consistency
Use standardized formats for dates, units, and values.
- Update Data Regularly
Enter actuals, targets, and previous-year data on time.
- Use Conditional Formatting Wisely
Keep visuals clean and meaningful.
- Review Trends Monthly
Analyze both MTD and YTD trends regularly.
- Limit KPIs to What Matters
Avoid overcrowding the dashboard with unnecessary metrics.
By following these practices, dashboard reliability improves.
Who Can Use a Radiology & Imaging KPI Dashboard in Excel?
This dashboard benefits many roles.
Ideal Users:
- Radiology department heads
- Hospital administrators
- Diagnostic center managers
- Healthcare analysts
- Finance and operations teams
Thus, it supports both clinical and managerial functions.
How Does This Dashboard Support Compliance and Quality Improvement?
Healthcare compliance demands accuracy and transparency.
This dashboard helps by:
- Standardizing performance metrics
- Maintaining historical data
- Supporting audit readiness
- Improving accountability
As a result, quality initiatives become measurable.
Can This Dashboard Be Customized?
Yes, customization is one of its strongest features.
You can:
- Add or remove KPIs
- Modify formulas
- Change targets
- Adjust visuals
- Add new analysis sheets
Therefore, the dashboard adapts to different organizations.
Conclusion: Why Radiology & Imaging KPI Dashboard in Excel Is a Must-Have
A Radiology & Imaging KPI Dashboard in Excel transforms how imaging departments track, analyze, and improve performance. Instead of relying on static reports, teams gain dynamic, actionable insights.
Because it offers flexibility, clarity, and affordability, this dashboard becomes an essential tool for modern healthcare operations. When implemented correctly, it improves efficiency, transparency, and decision-making across radiology and imaging services.
Frequently Asked Questions (FAQs)
What is the main purpose of a Radiology & Imaging KPI Dashboard in Excel?
The main purpose is to monitor, analyze, and visualize key radiology performance metrics in one centralized Excel file.
Do I need advanced Excel skills to use this dashboard?
No. Basic Excel knowledge is sufficient for data entry and analysis.
Can I add new KPIs to the dashboard?
Yes. You can easily add new KPIs through the KPI Definition sheet.
Does the dashboard support month-wise analysis?
Yes. You can select the month using a dropdown, and the dashboard updates automatically.
Can this dashboard replace manual reports?
Yes. It significantly reduces manual reporting effort and errors.
Is this dashboard suitable for small diagnostic centers?
Absolutely. It works for both small clinics and large hospitals.
Visit our YouTube channel to learn step-by-step video tutorials
Watch the step-by-step video tutorial:
Click to buy Radiology & Imaging KPI Dashboard in Excel