Railway cargo operations form the backbone of large-scale logistics and national supply chains. Every day, railway authorities, freight operators, and logistics planners move massive volumes of goods across regions and borders. However, increasing competition, rising operating costs, strict delivery timelines, and service-level expectations demand real-time visibility and data-driven control.
That is exactly where a Railway Cargo KPI Dashboard in Power BI becomes essential.
This detailed, SEO-optimized guide explains everything you need to know about a Railway Cargo KPI Dashboard in Microsoft Power BI. You will learn what it is, why it matters, how it works, its page-wise structure, key KPIs, advantages, best practices, and frequently asked questions. Moreover, the article uses clear language, strong transitions, and practical explanations to ensure easy understanding for both technical and non-technical users.
Click to Purchases Railway Cargo KPI Dashboard in Power BI
What Is a Railway Cargo KPI Dashboard in Power BI?
A Railway Cargo KPI Dashboard in Power BI is a ready-to-use, interactive business intelligence solution that tracks, measures, and analyzes railway freight performance using predefined key performance indicators (KPIs).
Instead of relying on static reports, manual Excel tracking, or disconnected systems, this dashboard consolidates actuals, targets, and historical performance into a single Power BI file. As a result, decision-makers gain instant visibility into cargo efficiency, target achievement, and performance trends.
Moreover, because the dashboard uses Excel as the data source, teams can update data easily without complex integrations. Once updated, Power BI refreshes visuals instantly and delivers insights in seconds.
Why Do Railway Cargo Operations Need a KPI Dashboard?
Railway cargo management involves multiple moving parts. Therefore, even small inefficiencies can lead to delays, revenue loss, and customer dissatisfaction. A KPI dashboard solves these challenges effectively.
Key Reasons to Use a Railway Cargo KPI Dashboard
-
It centralizes KPI monitoring in one interactive view
-
It highlights target achievements and misses instantly
-
It compares current performance with previous years
-
It supports faster and smarter operational decisions
-
It improves accountability across departments
Furthermore, railway organizations that adopt KPI dashboards shift from reactive reporting to proactive performance management.
How Does the Railway Cargo KPI Dashboard in Power BI Work?
The Railway Cargo KPI Dashboard works on a simple yet powerful data flow.
-
Users enter data in structured Excel worksheets
-
Power BI connects to the Excel file as a data source
-
Prebuilt measures calculate MTD, YTD, and comparisons
-
Visuals update automatically based on slicer selections
-
Decision-makers analyze insights in real time
Because of this approach, teams avoid complex database dependencies while maintaining strong analytical capability.
What Are the Main Pages of the Railway Cargo KPI Dashboard?
This ready-to-use Power BI dashboard includes three well-designed pages, each serving a specific analytical purpose.
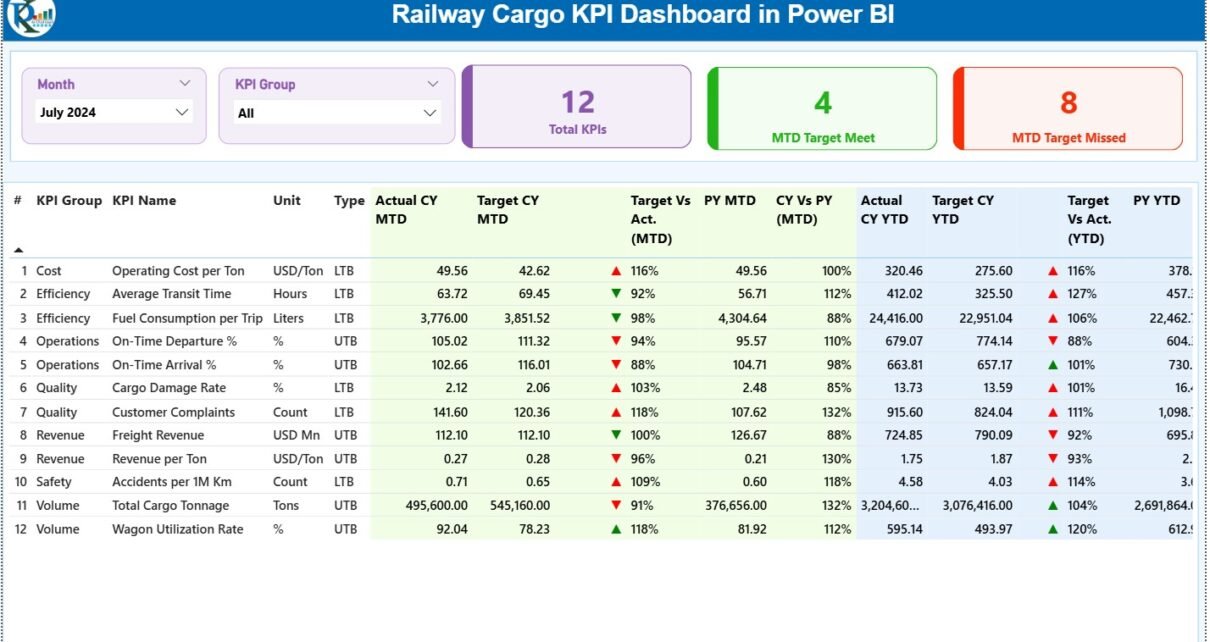
What Does the Summary Page Show?
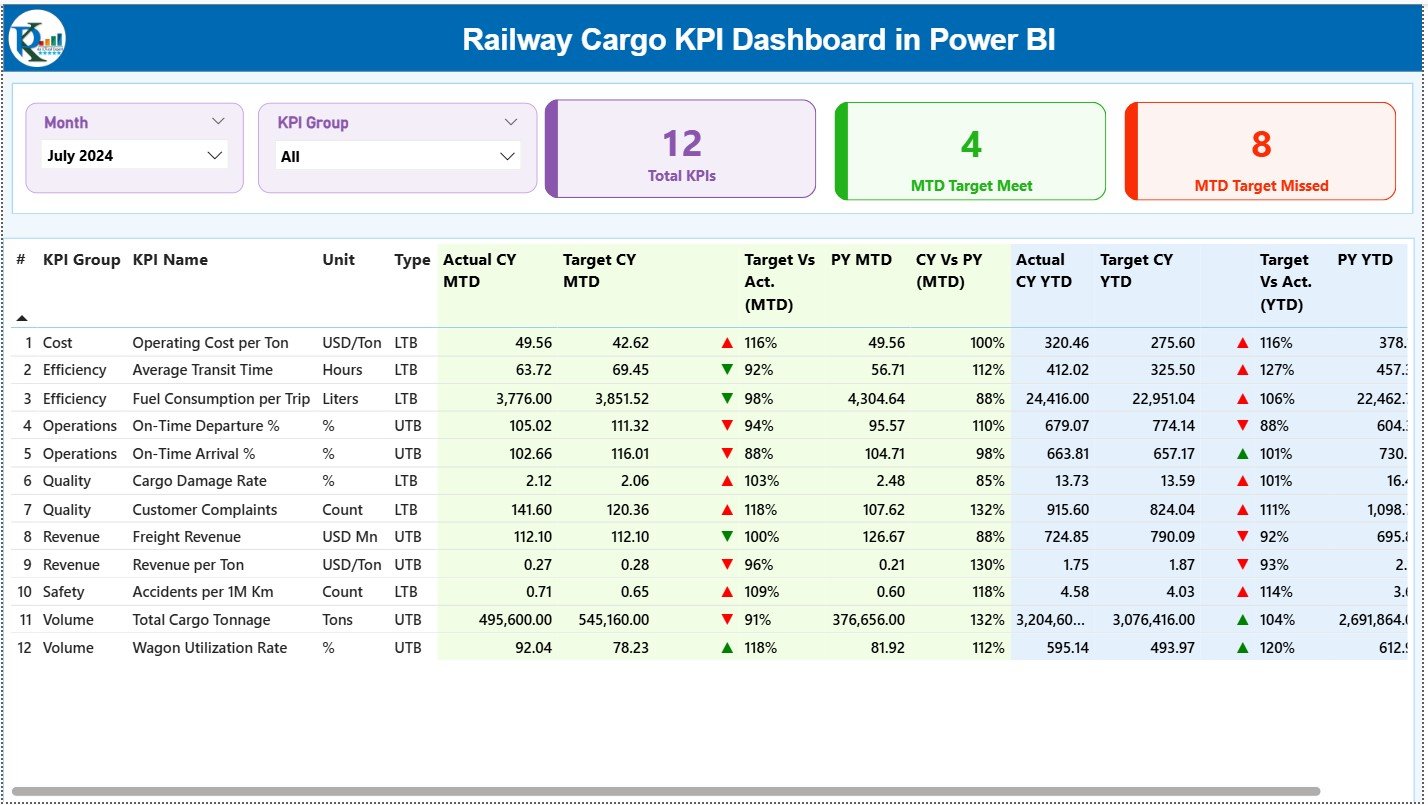
The Summary Page acts as the control center of the Railway Cargo KPI Dashboard.
Top-Level Slicers
At the top of the page, users can filter data using:
-
Month slicer
-
KPI Group slicer
These slicers instantly update all visuals on the page. As a result, users analyze performance for specific periods or KPI categories without extra effort.
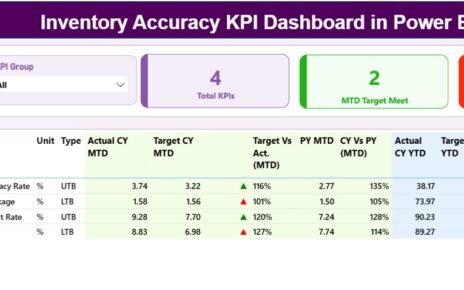
KPI Cards on the Summary Page
The dashboard displays three key cards:
-
Total KPIs Count
-
MTD Target Met Count
-
MTD Target Missed Count
These cards provide an immediate snapshot of overall performance health.
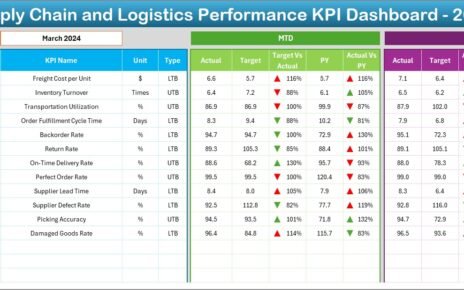
Detailed KPI Performance Table
Below the cards, the dashboard shows a comprehensive KPI table with the following fields:
-
KPI Number – Sequential identifier of each KPI
-
KPI Group – Category or functional group of the KPI
-
KPI Name – Name of the performance metric
-
Unit – Measurement unit (tons, %, hours, etc.)
-
Type – KPI type: LTB (Lower the Better) or UTB (Upper the Better)
Monthly Performance Metrics
-
Actual CY MTD – Current year month-to-date actual value
-
Target CY MTD – Current year month-to-date target
-
MTD Icon – Red ▼ or Green ▲ to show target status
-
Target vs Actual (MTD) – Actual ÷ Target (percentage)
-
PY MTD – Previous year month-to-date value
-
CY vs PY (MTD) – CY MTD ÷ PY MTD comparison
Year-to-Date Performance Metrics
-
Actual CY YTD – Current year YTD actual value
-
Target CY YTD – Current year YTD target
-
YTD Icon – Visual status indicator for YTD
-
Target vs Actual (YTD) – Actual ÷ Target (percentage)
-
PY YTD – Previous year YTD value
-
CY vs PY (YTD) – CY YTD ÷ PY YTD comparison
Because of conditional formatting and icons, users can instantly identify problem areas and strong performers.
Click to Purchases Railway Cargo KPI Dashboard in Power BI
What Insights Does the KPI Trend Page Provide?
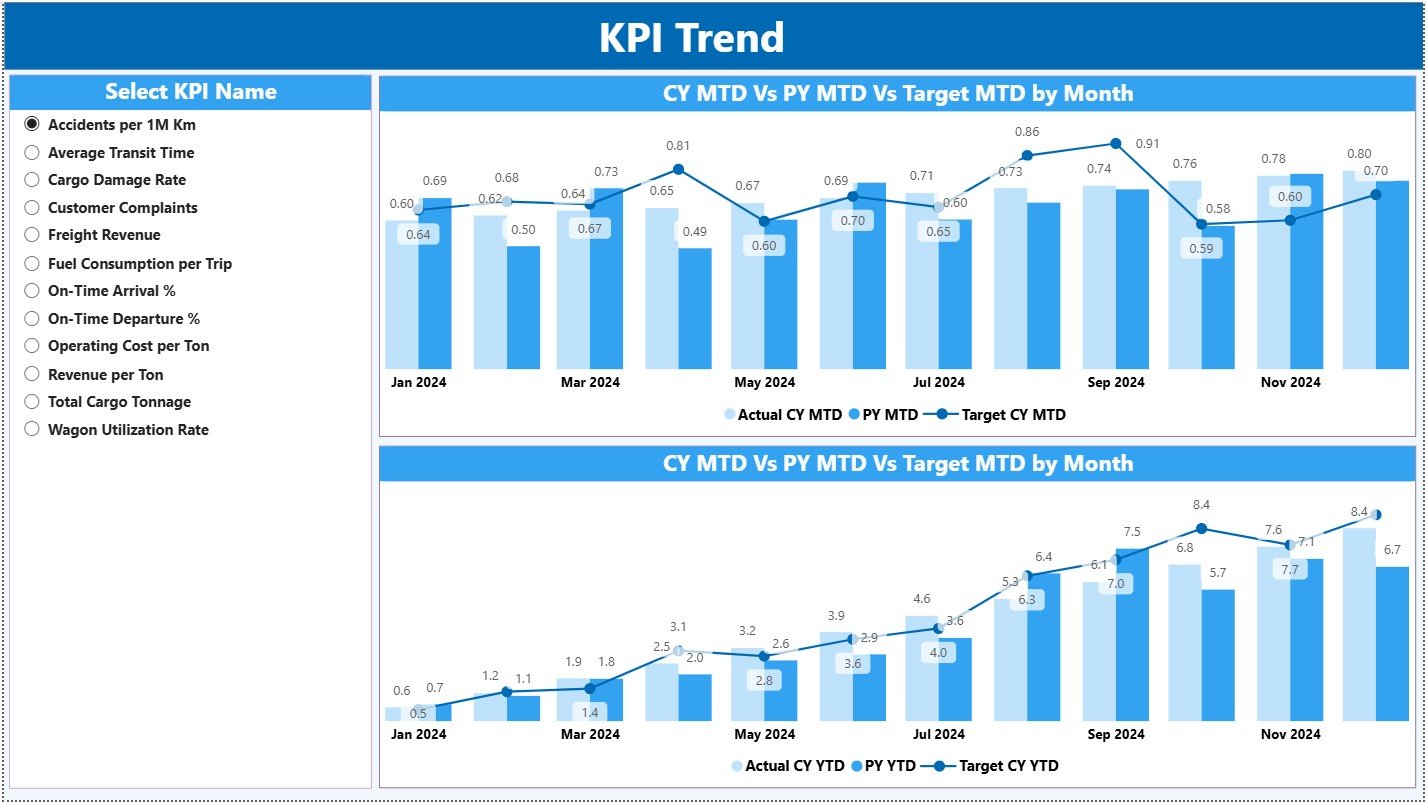
The KPI Trend Page focuses on time-based analysis.
Key Features of the KPI Trend Page
-
A KPI Name slicer on the left side
-
Two combo charts for MTD and YTD analysis
Combo Charts Explained
Each combo chart displays:
-
Actual values for the Current Year
-
Actual values for the Previous Year
-
Target values
This setup allows users to:
-
Track performance trends over time
-
Compare actuals with targets visually
-
Identify seasonality and performance gaps
Because visuals update dynamically, users explore trends without manual recalculations.
What Is the KPI Definition Page and Why Is It Important?
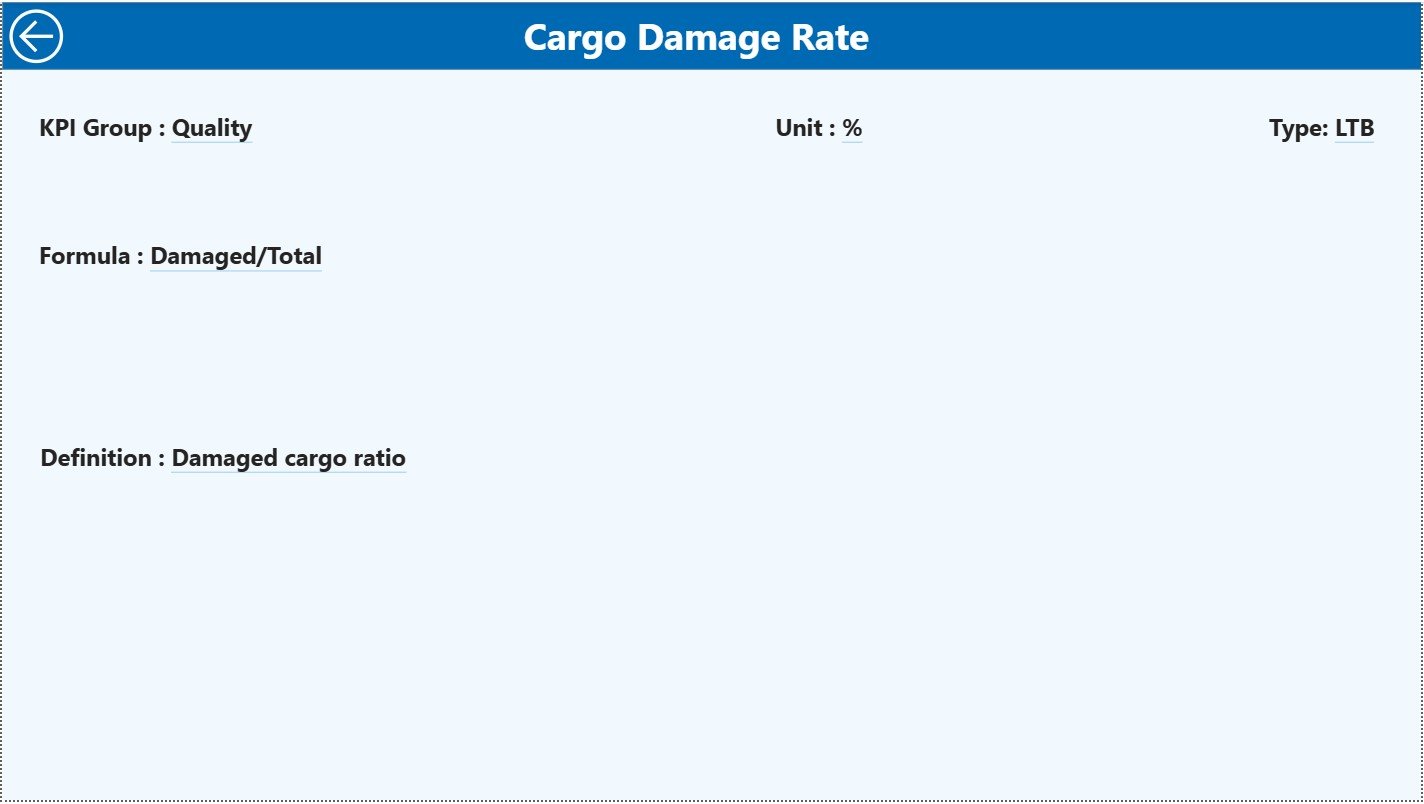
The KPI Definition Page works as a drill-through reference page.
Key Characteristics
-
The page remains hidden from direct navigation
-
Users access it via drill-through from the Summary Page
-
A back button allows instant return to the main dashboard
Information Available on This Page
-
KPI Formula
-
KPI Definition
-
KPI Type (LTB or UTB)
This page ensures clarity and consistency. As a result, all stakeholders interpret KPIs the same way, which reduces confusion and reporting disputes.
How Does the Excel Data Source Work?
The Railway Cargo KPI Dashboard uses an Excel file as its data source. This approach keeps data management simple and flexible.
Input_Actual Sheet
In this sheet, users enter:
-
KPI Name
-
Month (first date of the month)
-
MTD actual value
-
YTD actual value
Input_Target Sheet
In this sheet, users enter:
-
KPI Name
-
Month (first date of the month)
-
MTD target value
-
YTD target value
KPI Definition Sheet
This sheet stores master KPI information:
-
KPI Number
-
KPI Group
-
KPI Name
-
Unit
-
Formula
-
Definition
-
Type (LTB or UTB)
Because data remains structured, Power BI models work smoothly and consistently.
What Are the Advantages of a Railway Cargo KPI Dashboard in Power BI?
1. Centralized Performance Monitoring
The dashboard brings all KPIs into one unified view. Therefore, teams stop switching between multiple reports and spreadsheets.
2. Faster Decision-Making
Because insights update instantly, managers react quickly to performance gaps and operational issues.
3. Clear Target Tracking
Visual icons and percentages show whether KPIs meet targets. As a result, performance reviews become objective and transparent.
4. Strong Historical Comparison
CY vs PY comparisons help identify growth patterns, declines, and seasonal trends.
5. Easy Scalability
Organizations can add new KPIs, groups, or time periods without redesigning the dashboard.
6. Reduced Manual Errors
Automated calculations eliminate formula mistakes common in manual Excel reports.
Who Can Use the Railway Cargo KPI Dashboard?
This dashboard benefits a wide range of users, including:
-
Railway operations managers
-
Freight and cargo planners
-
Logistics analysts
-
Finance and performance teams
-
Senior railway executives
Because the dashboard remains intuitive, both analysts and non-technical users can use it confidently.
Click to Purchases Railway Cargo KPI Dashboard in Power BI
Best Practices for the Railway Cargo KPI Dashboard in Power BI
1. Standardize KPI Definitions
Always maintain consistent KPI definitions in the KPI Definition sheet. This practice ensures alignment across departments.
2. Update Data Regularly
Update actual and target data monthly. As a result, insights remain accurate and relevant.
3. Validate Data Before Refresh
Check data completeness and correctness before refreshing Power BI. This step avoids misleading visuals.
4. Use KPI Groups Strategically
Group KPIs logically, such as operations, revenue, efficiency, and service quality. This approach improves analysis clarity.
5. Review Trends, Not Just Status
Do not focus only on green or red icons. Instead, analyze trends on the KPI Trend page for deeper insights.
6. Train Users on Interpretation
Ensure users understand LTB and UTB logic. This understanding improves correct decision-making.
What Common Challenges Does the Dashboard Solve?
-
Lack of KPI visibility
-
Delayed reporting cycles
-
Inconsistent performance tracking
-
Manual calculation errors
-
Difficulty comparing targets vs actuals
Because of its structured design, the dashboard solves these challenges effectively.
How Does This Dashboard Improve Strategic Planning?
By combining MTD, YTD, and historical data, the Railway Cargo KPI Dashboard supports:
-
Capacity planning
-
Performance forecasting
-
Budget alignment
-
Operational optimization
As a result, leadership teams make confident, data-backed strategic decisions.
Conclusion
A Railway Cargo KPI Dashboard in Power BI transforms how railway organizations track, analyze, and improve cargo performance. Instead of relying on fragmented reports, teams gain a centralized, visual, and interactive performance management system.
With structured Excel inputs, intuitive Power BI visuals, detailed KPI comparisons, and trend analysis, this dashboard delivers clarity, speed, and control. Therefore, any railway or freight organization aiming for operational excellence should adopt this dashboard without hesitation.
Click to Purchases Railway Cargo KPI Dashboard in Power BI
Frequently Asked Questions (FAQs)
What is the main purpose of a Railway Cargo KPI Dashboard in Power BI?
The main purpose is to monitor cargo performance, track targets, compare trends, and support data-driven decisions.
Can I customize KPIs in this dashboard?
Yes, you can add, modify, or remove KPIs easily through the Excel data source and KPI Definition sheet.
Does the dashboard support monthly and yearly analysis?
Yes, it supports both MTD and YTD analysis with current year and previous year comparisons.
Is Excel mandatory as a data source?
In this setup, Excel acts as the primary data source. However, you can later connect databases if needed.
Can non-technical users operate this dashboard?
Yes, the dashboard design remains user-friendly. Non-technical users can filter and analyze data easily.
How often should data be refreshed?
You should refresh data monthly or as per operational reporting requirements to maintain accuracy.
Click to Purchases Railway Cargo KPI Dashboard in Power BI
Visit our YouTube channel to learn step-by-step video tutorials