Real Estate Agent Dashboard in Excel is a powerful, pivot-powered analytics template designed to help real estate professionals, brokerages, and sales managers track agent performance, monitor commissions, analyze market trends, and evaluate property insights from a single interactive Excel dashboard. This template includes 5 interactive dashboard pages, a structured data sheet, and a support sheet with pivot tables that drive the entire dashboard dynamically.Real Estate Agent Dashboard in Excel.
Whether you are an individual real estate agent looking to track your personal sales metrics or a brokerage manager overseeing a team of agents, this Real Estate Agent Dashboard in Excel provides the clarity and control you need to close more deals and maximize commissions. The dashboard tracks 5 key performance indicators including Total Sales Value, Total Commission, Total Records, Avg. Days On Market, and Avg. Client Satisfaction across 5 dedicated analysis pages.
Click to buy Real Estate Agent Dashboard in Excel
Key Features of Real Estate Agent Dashboard in Excel
The Real Estate Agent Dashboard in Excel is packed with features that make it one of the most comprehensive real estate analytics solutions available in Excel format. Here is what makes this template stand out from the rest.
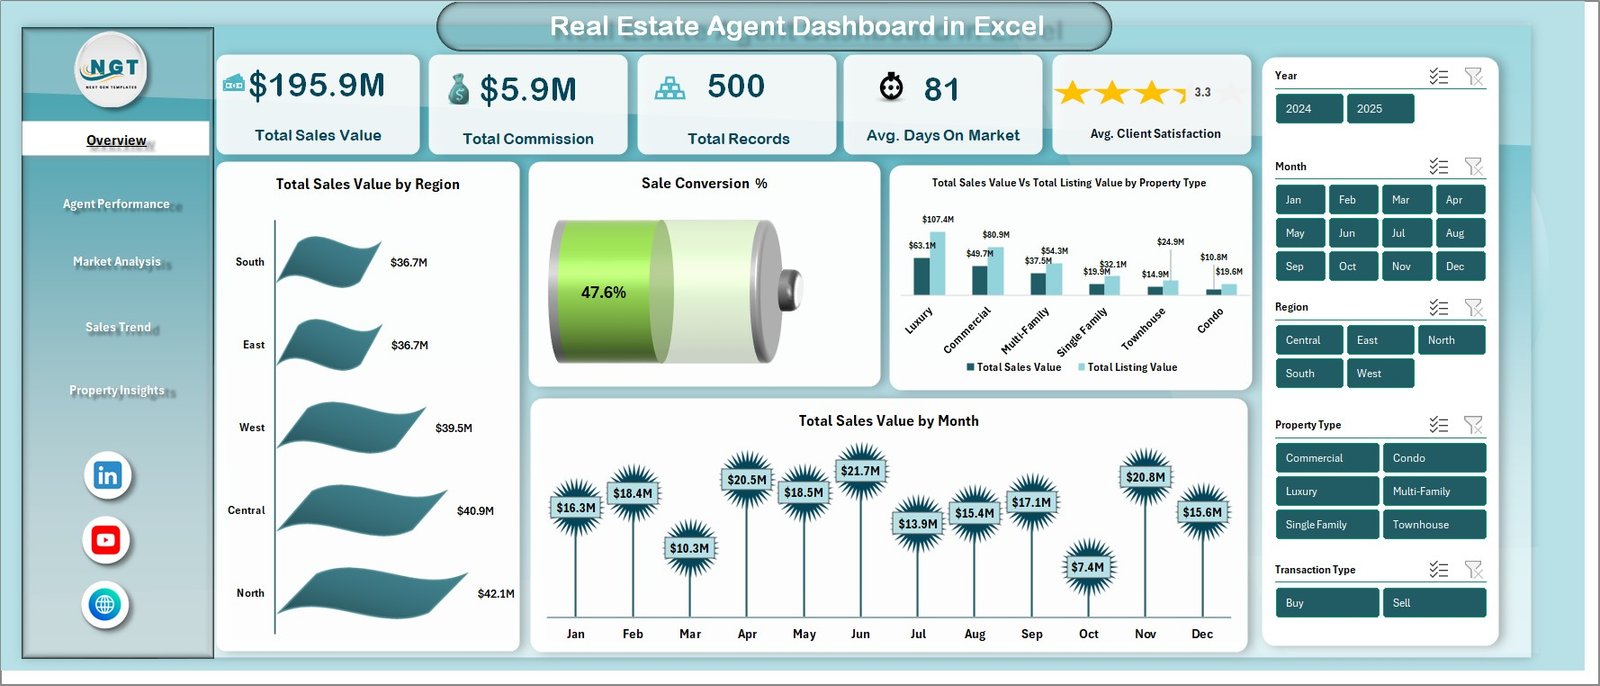
This dashboard includes 5 interactive pages covering Overview, Agent Performance, Market Analysis, Sales Trend, and Property Insights. Each page is purpose-built for a unique analytical perspective, giving you complete visibility into every dimension of your real estate business. The Overview page displays dynamic KPI cards for Total Sales Value, Total Commission, Total Records, Avg. Days On Market, and Avg. Client Satisfaction alongside interactive charts for regional sales distribution, sale conversion percentage, property type comparison, and monthly sales trends.
The Agent Performance page lets you compare individual agents across Total Commission, Total Sold count, and Average Days On Market — making it easy to identify your top performers and areas that need coaching. The Market Analysis page provides neighborhood-level insights with charts showing Total Sales Value and Total Listing Value by Neighborhood, Avg. Days On Market by Property Type, and Total Records by Lead Source.
Advanced slicers and filters let you instantly drill down into specific regions, property types, agent names, transaction types, and listing statuses. All charts and KPIs are powered by pivot tables in the Support sheet, so a simple Refresh All updates the entire dashboard with your latest data. Browse all Excel Dashboard Templates and Real Estate Templates for more options.Real Estate Agent Dashboard in Excel
Dashboard Pages Explained
1. Overview Page
The Overview page serves as your command center for real estate performance monitoring. At the top, dynamic KPI cards display Total Sales Value, Total Commission, Total Records, Avg. Days On Market, and Avg. Client Satisfaction. Below the cards, interactive charts present Total Sales Value by Region showing regional sales distribution, Sale Conversion % revealing the ratio of sold vs listed properties, Total Sales Value and Total Listing Value by Property Type for cross-comparison, and Total Sales Value by Month tracking monthly sales trends. Multiple slicers are available to filter the entire dashboard instantly.
Real Estate Agent Dashboard in Excel
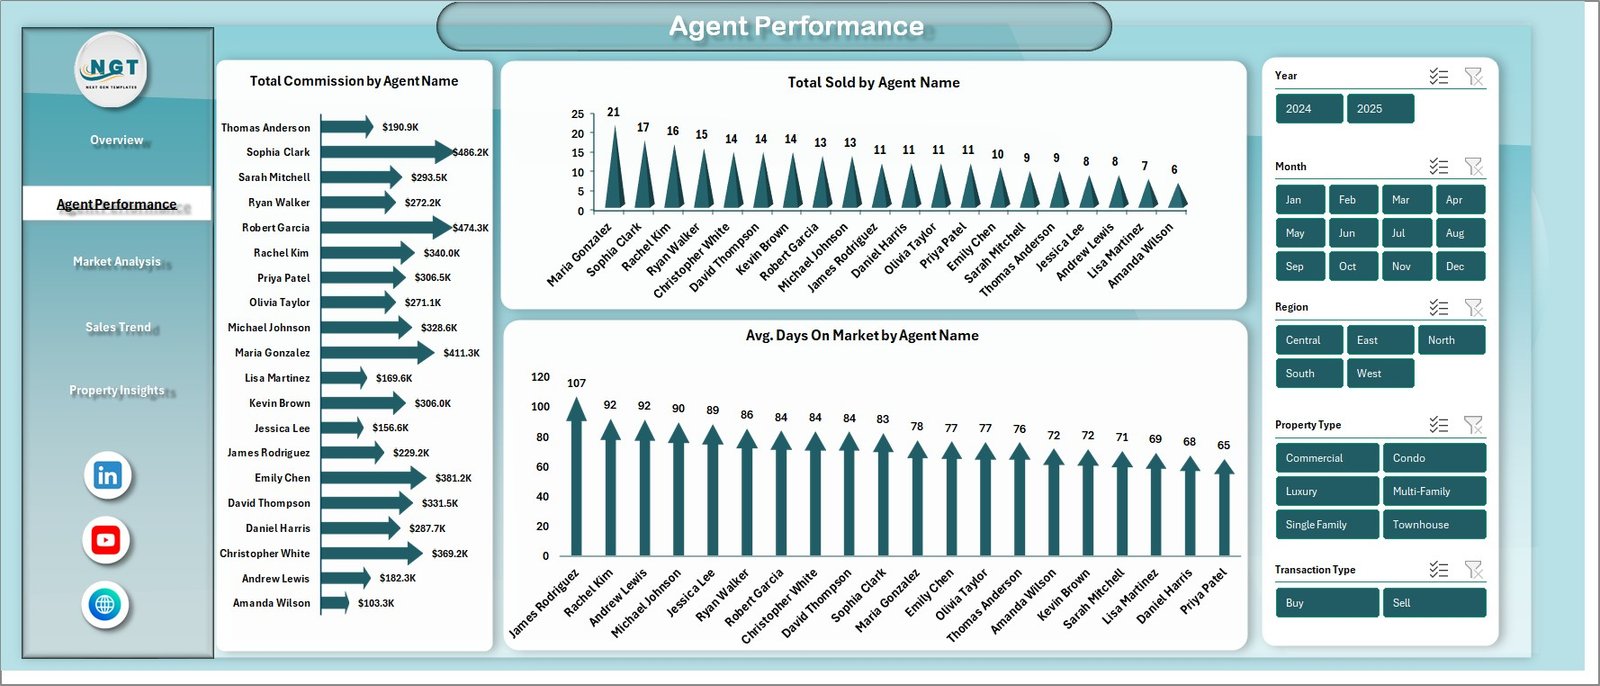
2. Agent Performance
The Agent Performance page focuses on individual agent analytics. It includes charts for Total Commission by Agent Name to see which agents generate the most revenue, Total Sold by Agent Name to compare transaction volumes, and Avg. Days On Market by Agent Name to evaluate how quickly each agent closes deals. This page is essential for brokerages that want to reward top performers and provide targeted coaching to underperformers.
Click to buy Real Estate Agent Dashboard in Excel
Agent Performance
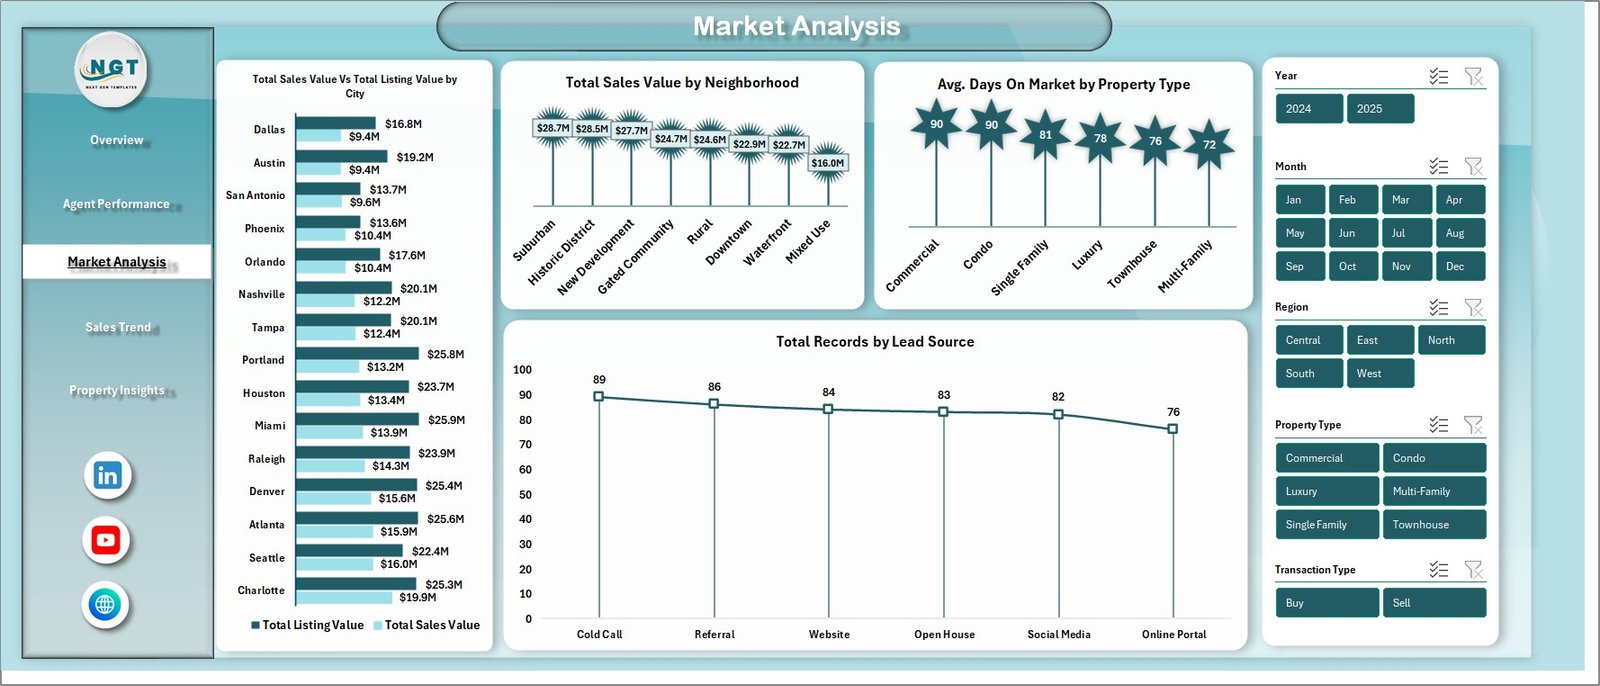
3. Market Analysis
The Market Analysis page dives into location-based and source-based insights. Charts include Total Sales Value and Total Listing Value by Neighborhood for geographic performance comparison, Avg. Days On Market by Property Type to understand which property categories sell fastest, and Total Records by Lead Source to evaluate which marketing channels generate the most transactions. This analysis helps agents and managers allocate marketing budgets more effectively.
Market Analysis
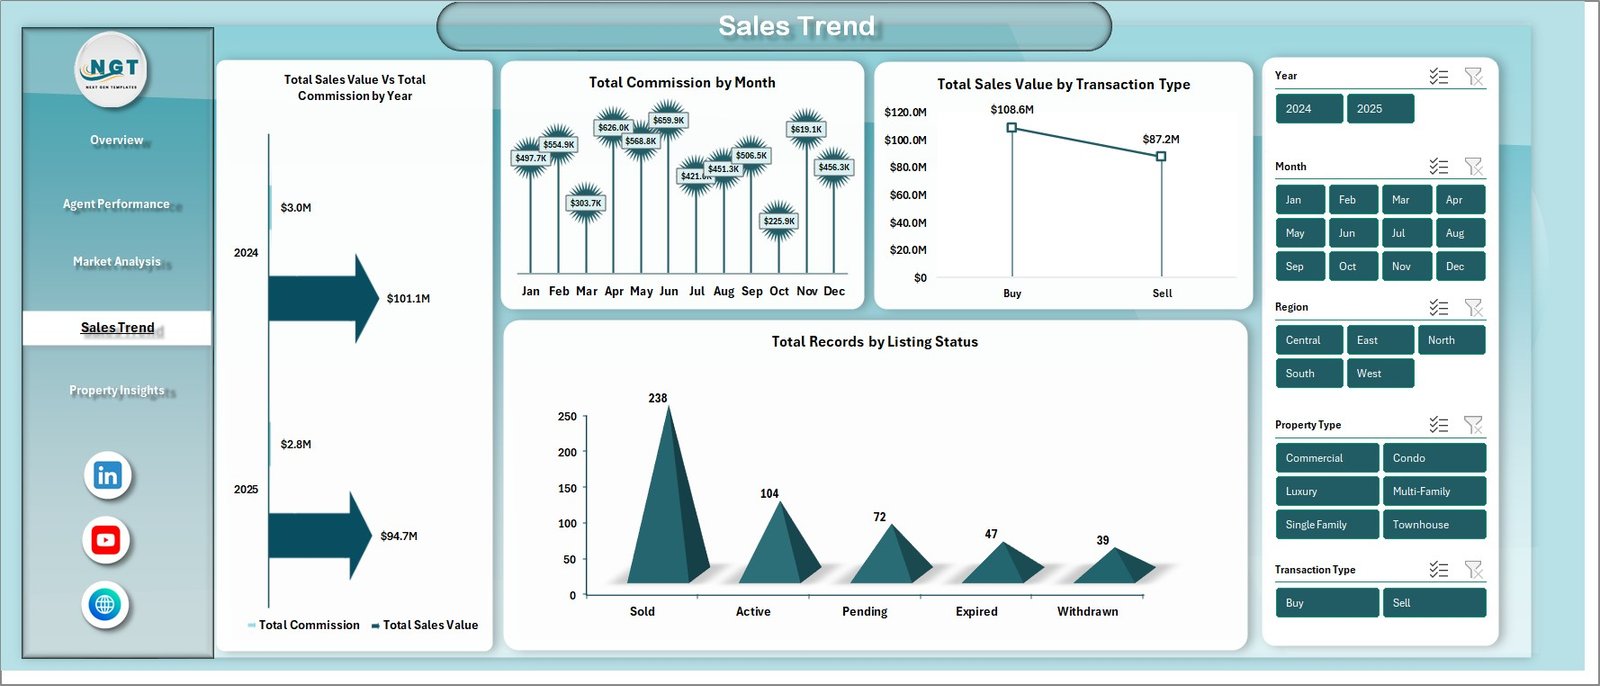
4. Sales Trend
The Sales Trend page tracks time-based patterns with charts for Total Sales Value and Total Commission by Year for year-over-year growth analysis, Total Commission by Month to spot seasonal patterns, Total Sales Value by Transaction Type to compare buying vs selling vs rental transactions, and Total Records by Listing Status to monitor the pipeline of active, sold, and pending listings.
Sales Trend
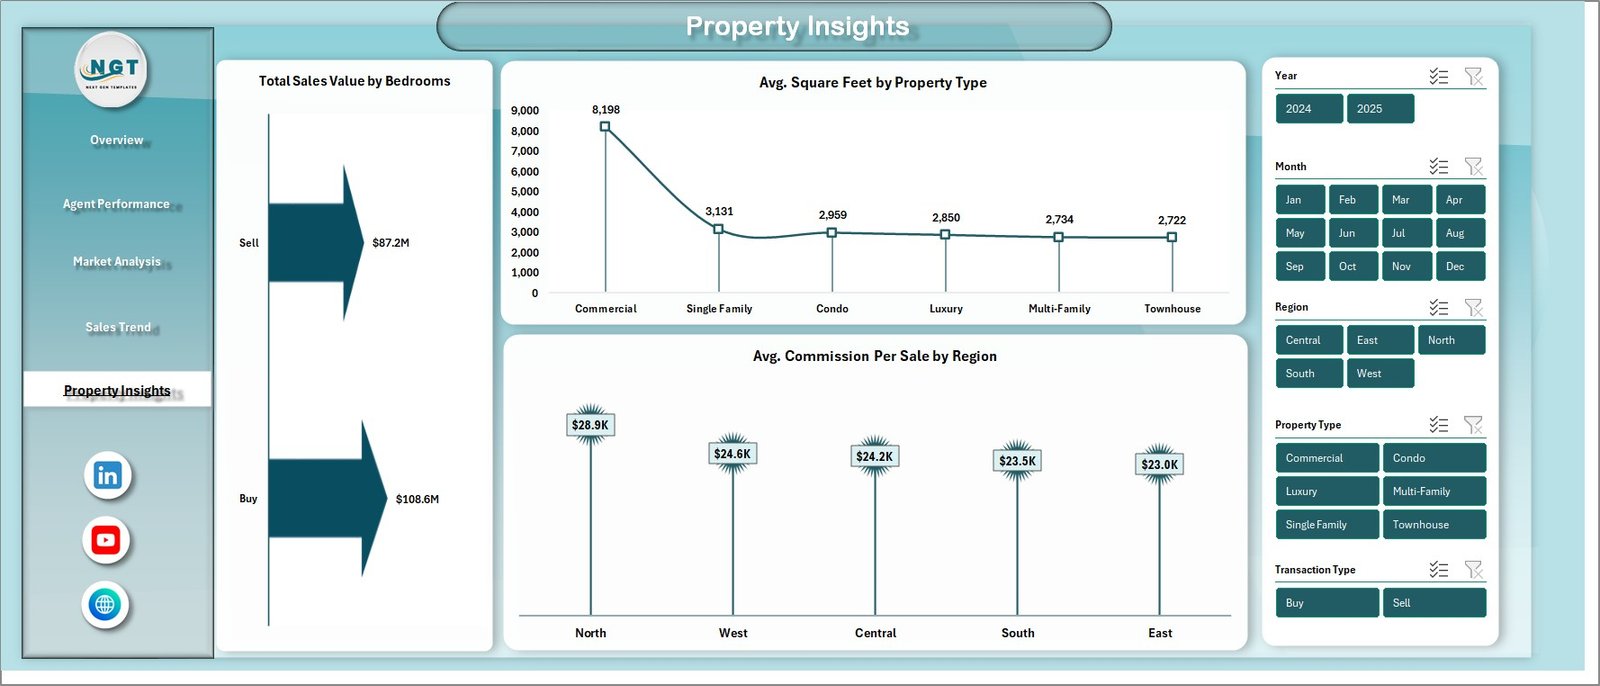
5. Property Insights
The Property Insights page evaluates property-level analytics with charts for Total Sales Value by Bedrooms to identify which bedroom configurations generate the most revenue, Avg. Square Foot by Property Type to compare property sizes across categories, and Avg. Commission Per Sale by Region to evaluate regional profitability for agents.
Property Insights
6. Data Sheet
This is the Data sheet where you enter your real estate transaction records. Add your data in the same format provided — including property type, region, agent name, sales value, commission, listing value, days on market, client satisfaction score, and more. The dashboard reads from this sheet and updates all analytics automatically after a refresh.
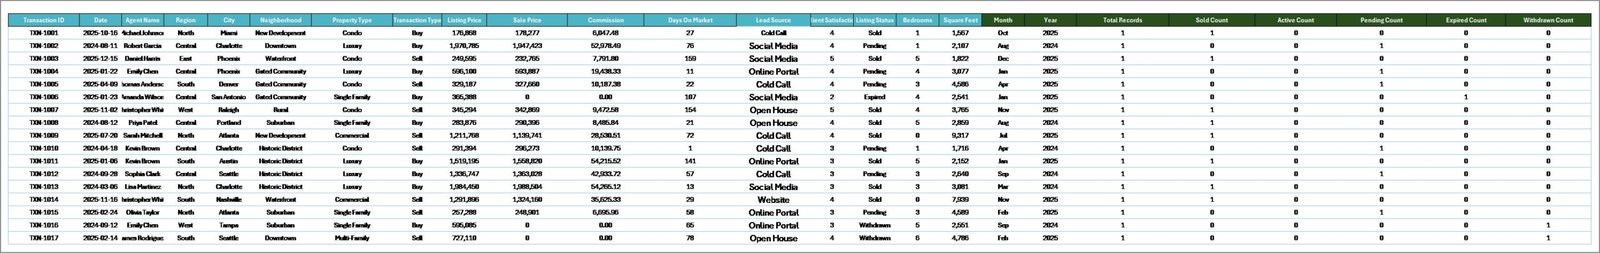
Data Sheet Tab
7. Support Sheet
The Support sheet contains multiple pivot tables that power the entire dashboard dynamically. You can go to the Data tab in the Excel Ribbon and click on Refresh All after updating the data in the Data sheet. All the pivots will be refreshed and all the charts will be refreshed. You can keep this sheet hidden.
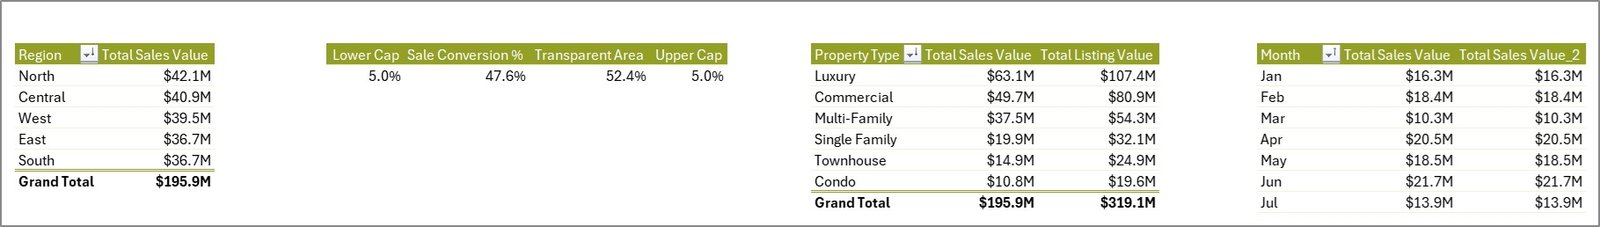
Support Sheet Tab
Advantages of Real Estate Agent Dashboard in Excel
The Real Estate Agent Dashboard in Excel offers several compelling advantages for real estate professionals. First, it consolidates all your transaction data into a single, unified interface — eliminating the need to switch between multiple spreadsheets or reporting tools. Second, the pivot-powered architecture means you never have to manually update charts or recalculate KPIs; a simple Refresh All does everything for you.
Third, the multi-page design provides both high-level overviews and granular drill-down capabilities, making it suitable for individual agents as well as large brokerages. Fourth, the interactive slicers give you the flexibility to analyze data from any angle — by region, property type, agent, time period, or lead source — without creating separate reports. Finally, because it runs in Microsoft Excel, there is no additional software cost or learning curve for teams already familiar with spreadsheets.
Opportunities for Improvement
While the Real Estate Agent Dashboard in Excel is highly functional, there are a few areas where users might want to extend it further. Adding a commission goal vs actual comparison chart would help agents track progress toward targets. Including a client retention or repeat customer metric could provide deeper relationship insights. Users managing very large datasets (10,000+ records) may experience slower refresh times due to Excel pivot table limitations — in such cases, consider the Power BI version for better performance at scale.
Best Practices
To get the most out of your Real Estate Agent Dashboard in Excel, follow these best practices. Keep your data clean and consistent — use standardized names for regions, property types, and agent names to ensure accurate filtering and grouping. Update your data regularly (weekly or monthly) and always click Refresh All after making changes. Use the slicers strategically to create focused views for team meetings or client presentations. Consider hiding the Support sheet to keep the workbook clean for stakeholders who only need to see the dashboard pages.
For the best experience, use Microsoft Excel desktop version (2016 or later) as some slicer and pivot features may not work fully in Excel Online or Google Sheets. If you need a browser-based alternative, check out the Real Estate Agent Dashboard in HTML.
Explore Relevant Templates
Real Estate Agent Dashboard in HTML – The browser-based version of this dashboard with interactive charts and no software required.
Rental Property Investment Dashboard in Excel – Track rental income, NOI, occupancy, and ROI across your property portfolio.
Rental Property Investment Dashboard in Power BI – Advanced Power BI analytics for rental property investment management.
Rental Property Investment Dashboard in Google Sheets – Cloud-based rental analytics with 6 interactive pages in Google Sheets.
Real Estate Dashboard in HTML – Complete real estate analytics for property listings, regional trends, and agent tracking.
Frequently Asked Questions
What KPIs does the Real Estate Agent Dashboard in Excel track?
The Real Estate Agent Dashboard in Excel tracks 5 key performance indicators: Total Sales Value, Total Commission, Total Records, Avg. Days On Market, and Avg. Client Satisfaction. It also includes Sale Conversion %, commission breakdowns by agent, neighborhood-level analysis, and property-level insights across 5 interactive dashboard pages.
Do I need advanced Excel skills to use this template?
No. Simply open the file in Microsoft Excel, replace the sample data in the Data Sheet with your own real estate transaction records, and click Refresh All in the Data tab. All charts, KPI cards, and pivot tables update automatically without any manual formula work.
What is the best Excel dashboard for tracking real estate agent commissions?
The Real Estate Agent Dashboard in Excel from NextGenTemplates is one of the best options for tracking real estate agent commissions. It provides dedicated agent performance analytics showing Total Commission by Agent, Total Sold by Agent, and Avg. Days On Market by Agent, alongside 4 additional pages covering overview, market analysis, sales trends, and property insights.
Can I filter the dashboard by specific agents, regions, or property types?
Yes. The dashboard includes multiple interactive slicers that let you filter by Region, Property Type, Agent Name, Transaction Type, Listing Status, Lead Source, and other dimensions. Filtering applies across all charts and KPIs on each page for focused analysis.
How do I update the dashboard with my own data?
Navigate to the Data Sheet tab, replace the sample records with your own real estate transaction data in the same column format, then go to the Data tab in the Excel ribbon and click Refresh All. Every pivot table, chart, and KPI card across all 5 dashboard pages will update automatically.
Is this dashboard available in other platforms?
Yes. We also offer the Real Estate Agent Dashboard in HTML for a browser-based experience. For rental property analytics, explore our dashboards in Excel, Power BI, Google Sheets, and HTML.
Conclusion
The Real Estate Agent Dashboard in Excel is a must-have tool for any real estate professional who wants to make data-driven decisions, track agent performance, and maximize sales commissions. With 5 interactive dashboard pages, dynamic KPI cards, advanced slicers, and pivot-powered auto-updates, this template transforms your raw transaction data into actionable visual insights in minutes.
Click here to Purchase Real Estate Agent Dashboard in Excel
For more Excel tips and resources, visit Microsoft Learn. Subscribe to our YouTube channel for step-by-step video tutorials on how to use this and other dashboard templates.
👉 Youtube.com/@PK-AnExcelExpert