Real estate development involves high capital investment, long project cycles, and multiple risk factors. Therefore, developers, investors, and project managers must track cost, revenue, progress, and profitability with absolute clarity. However, managing this information through static reports or scattered spreadsheets often leads to delays and poor decisions.
That is exactly where a Real Estate Development Dashboard in Power BI delivers massive value.
In this detailed and easy-to-understand article, you will learn what a Real Estate Development Dashboard in Power BI is, why it is essential, how it works, its complete page-wise structure, advantages, best practices, and frequently asked questions. Moreover, this guide uses simple language, strong transition flow, and real-world explanations so you can apply everything immediately.
Click to Purchases Real Estate Development Dashboard in Power BI
What Is a Real Estate Development Dashboard in Power BI?
A Real Estate Development Dashboard in Power BI is an interactive business intelligence solution designed to monitor real estate project performance in one centralized visual platform.
Instead of reviewing multiple Excel files for cost, revenue, risk, and progress, this dashboard brings everything together. As a result, decision-makers gain instant visibility into project health, financial performance, and risk exposure.
Most importantly, Power BI converts raw project data into interactive charts, KPI cards, slicers, and trends, which makes analysis faster and more reliable.
Why Do Real Estate Developers Need a Power BI Dashboard?
Real estate development projects involve land acquisition, construction phases, marketing expenses, and sales execution. At the same time, market conditions and risks change constantly.
Here is why a Real Estate Development Dashboard in Power BI becomes critical:
-
It tracks total project cost and revenue in real time
-
It monitors profit margin and cost components
-
It analyzes project progress and risk levels
-
It compares performance across phases, cities, and property types
-
It identifies monthly cost and revenue trends
Without a dashboard, leaders rely on delayed reports. However, with Power BI, they rely on live insights.
What KPIs Are Commonly Tracked in a Real Estate Development Dashboard?
An effective Real Estate Development Dashboard in Power BI tracks KPIs across financial, operational, and risk dimensions.
Financial KPIs
-
Total Project Cost
-
Marketing Cost
-
Land Cost
-
Total Revenue
-
Profit Margin %
Operational KPIs
-
In Progress %
-
Project Phase Status
-
Property Type Performance
Risk KPIs
-
High Risk Level %
-
Profit by Risk Level
Analytical Dimensions
-
Phase
-
City
-
Property Type
-
Month
This dashboard structure supports all these KPIs in a clean and visual manner.
Click to Purchases Real Estate Development Dashboard in Power BI
How Does the Real Estate Development Dashboard in Power BI Work?
The Real Estate Development Dashboard in Power BI connects to structured project data and transforms it into interactive visuals.
The workflow works as follows:
-
Project data is captured in structured tables
-
Power BI imports and models the data
-
Measures calculate cost, revenue, margin, and progress
-
Slicers filter data dynamically
-
Visuals update instantly
As a result, stakeholders explore data without waiting for manual reports.
What Is the Page-Wise Structure of the Real Estate Development Dashboard in Power BI?
This ready-to-use dashboard contains 5 well-designed analytical pages in the Power BI Desktop application. Each page focuses on a specific business question.
Let us explore each page in detail.
1. What Is the Overview Page in the Real Estate Development Dashboard?
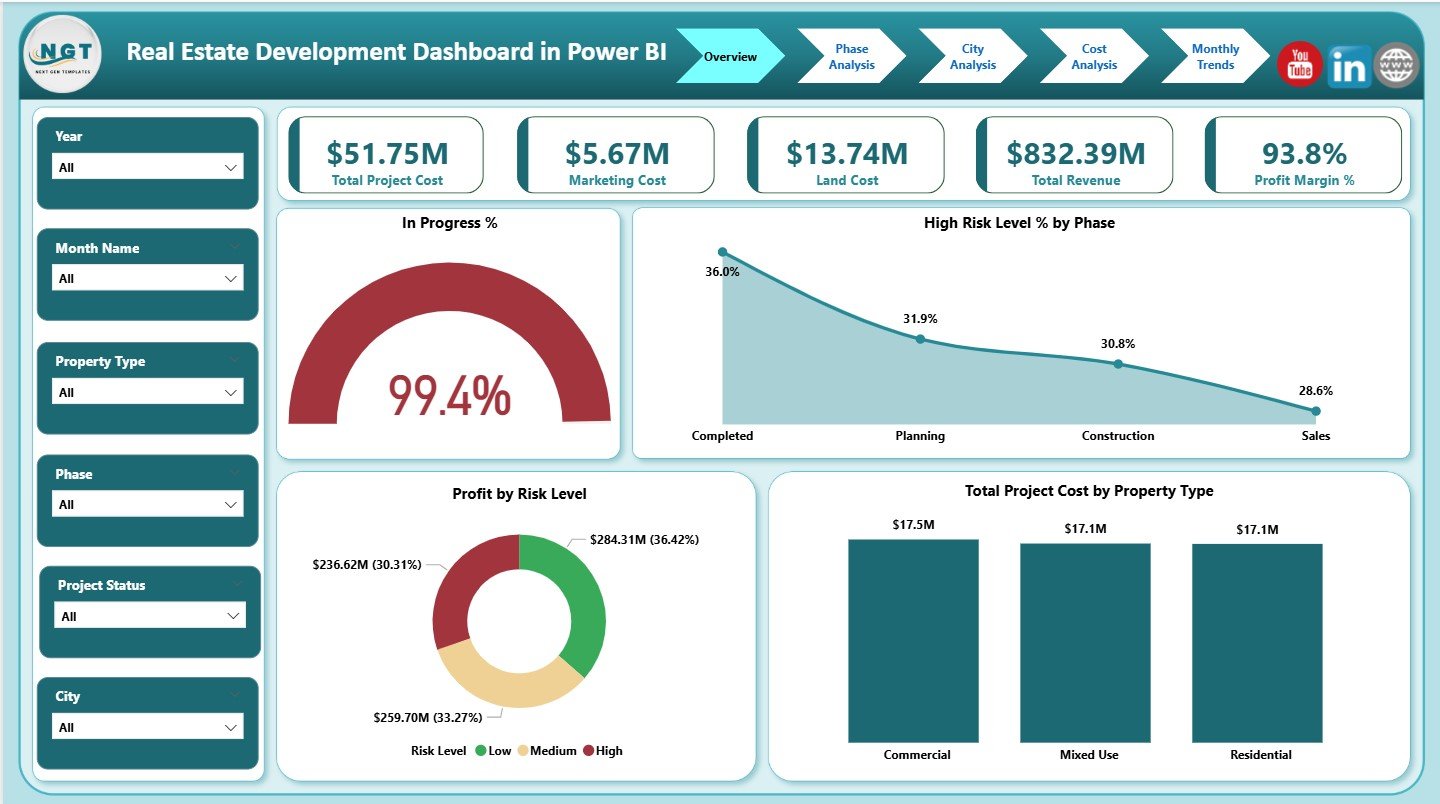
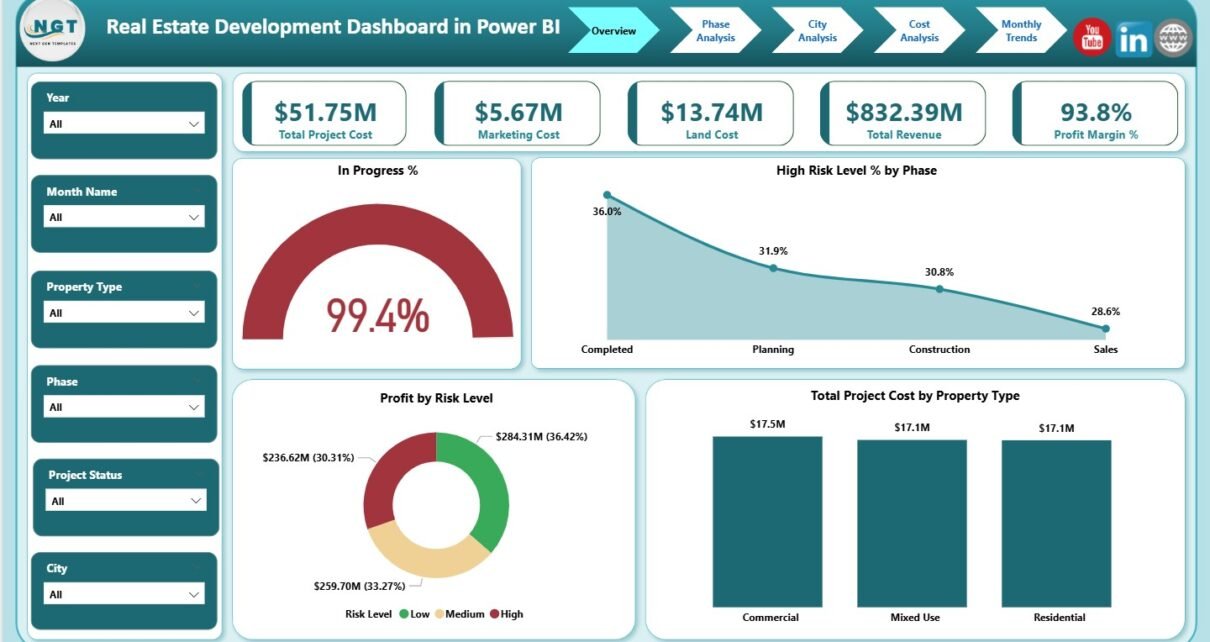
The Overview Page is the main landing page of the dashboard. It provides a high-level summary of overall project performance.
KPI Cards on the Overview Page
The dashboard displays five KPI cards:
-
Total Project Cost
-
Marketing Cost
-
Land Cost
-
Total Revenue
-
Profit Margin %
These cards instantly show financial health and profitability.
What Charts Are Available on the Overview Page?
The Overview Page also includes four key charts:
-
In Progress %
-
High Risk Level % by Phase
-
Profit by Risk Level
-
Total Project Cost by Property Type
Because of this layout, leadership teams immediately identify risk exposure and cost concentration.
Click to Purchases Real Estate Development Dashboard in Power BI
Why Is the Overview Page Important?
The Overview Page allows decision-makers to:
-
Assess overall project health quickly
-
Identify high-risk phases
-
Compare profitability across risk levels
-
Understand cost distribution by property type
Therefore, this page supports executive-level decision-making.
2. What Is the Phase Analysis Page?
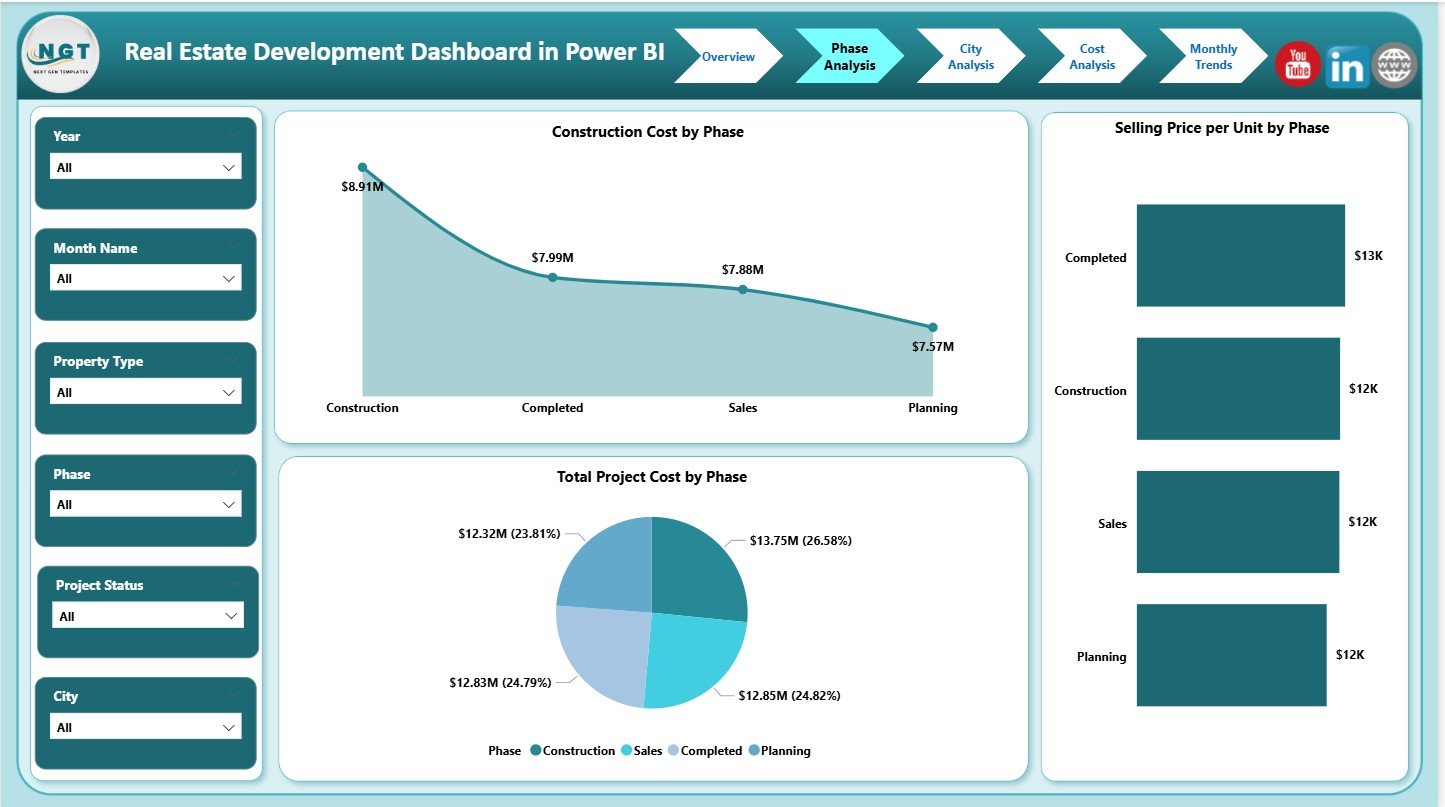
The Phase Analysis Page focuses on cost and pricing behavior across development phases.
Charts on the Phase Analysis Page
-
Construction Cost by Phase
-
Total Project Cost by Phase
-
Selling Price per Unit by Phase
This page helps stakeholders understand how costs and pricing evolve during different project stages.
How Does Phase Analysis Help Real Estate Developers?
Phase analysis allows developers to:
-
Control construction cost escalation
-
Evaluate phase-wise profitability
-
Optimize pricing strategies
-
Improve project planning accuracy
As a result, project execution becomes more predictable.
3. What Is the City Analysis Page?
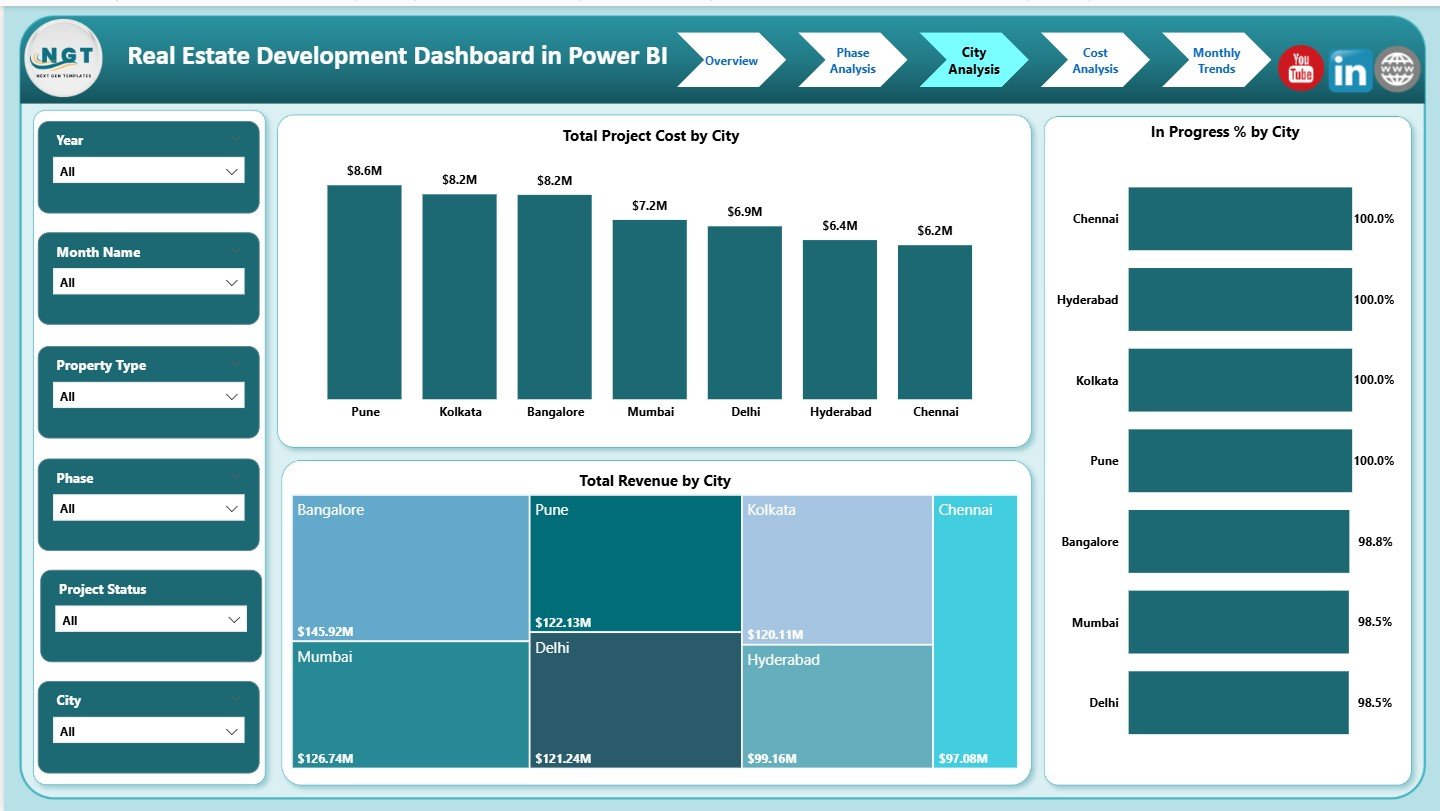
The City Analysis Page compares performance across different cities.
Charts on the City Analysis Page
-
Total Project Cost by City
-
Total Revenue by City
-
In Progress % by City
This analysis highlights geographical performance differences clearly.
Why Is City-Wise Analysis Critical in Real Estate?
City-wise analysis helps organizations:
-
Identify high-growth markets
-
Compare cost vs revenue across cities
-
Allocate capital strategically
-
Support expansion and investment decisions
Therefore, this page plays a vital strategic role.
Click to Purchases Real Estate Development Dashboard in Power BI
4. What Is the Cost Analysis Page?
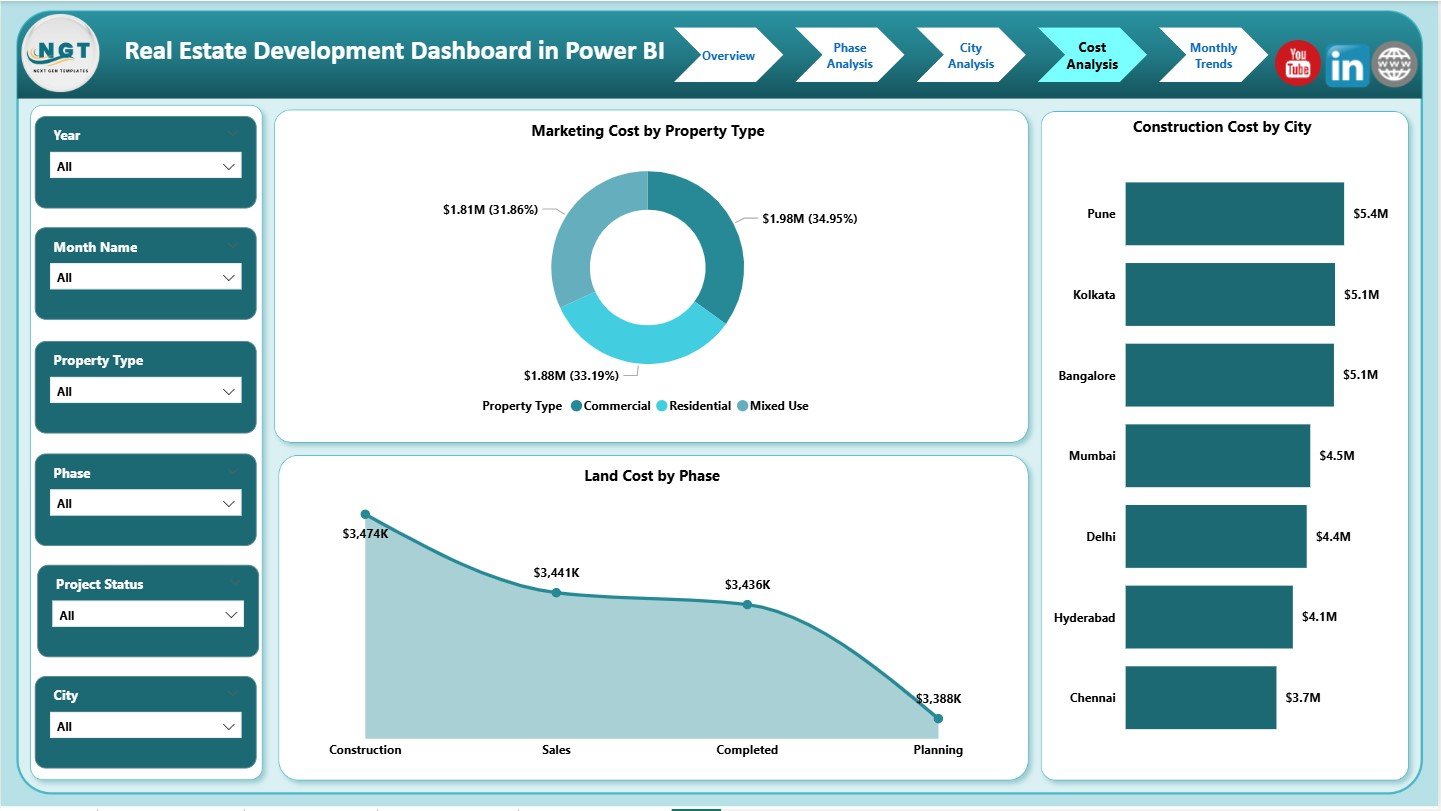
The Cost Analysis Page focuses on cost structure and cost drivers.
Charts on the Cost Analysis Page
-
Marketing Cost by Property Type
-
Land Cost by Phase
-
Construction Cost by City
This page reveals where money is being spent and why.
How Does Cost Analysis Improve Profitability?
Cost analysis enables teams to:
-
Identify cost overruns early
-
Optimize marketing and land acquisition costs
-
Control construction expenses
-
Improve profit margins
As a result, financial discipline improves significantly.
Click to Purchases Real Estate Development Dashboard in Power BI
5. What Is the Monthly Trends Page?
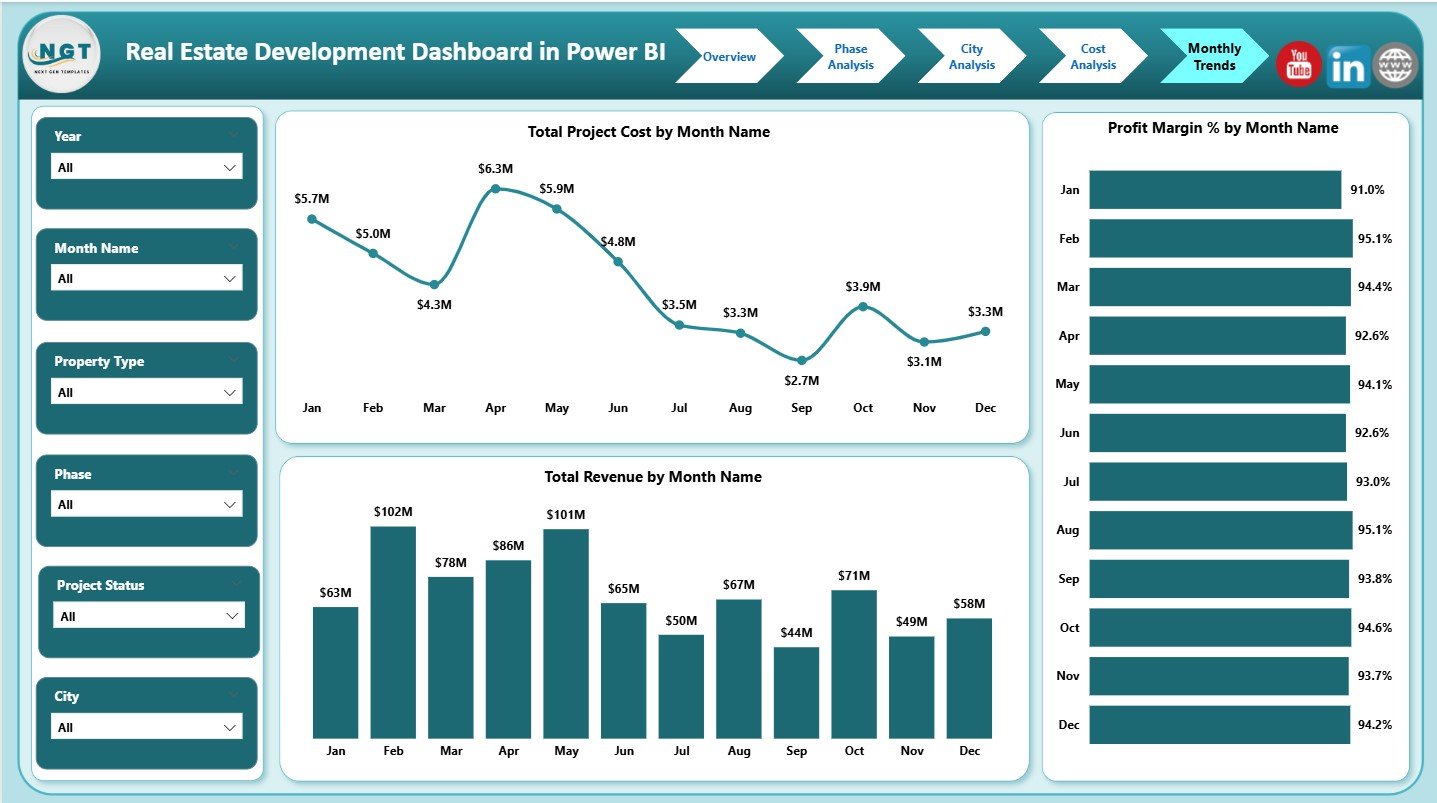
The Monthly Trends Page highlights time-based performance patterns.
Charts on the Monthly Trends Page
-
Total Project Cost by Month Name
-
Total Revenue by Month Name
-
Profit Margin % by Month Name
These charts help identify seasonal trends and long-term performance shifts.
Why Are Monthly Trends Important?
Monthly trends help teams:
-
Track project momentum
-
Identify cost spikes
-
Monitor revenue growth
-
Forecast future performance
Therefore, this page supports planning and forecasting activities.
Click to Purchases Real Estate Development Dashboard in Power BI
Advantages of Real Estate Development Dashboard in Power BI
Using a Real Estate Development Dashboard in Power BI offers significant benefits.
1. Centralized Project Visibility
All project metrics appear in one interactive dashboard.
2. Real-Time Insights
Data refreshes instantly, which improves responsiveness.
3. Interactive Analysis
Slicers allow users to explore data dynamically.
4. Better Risk Management
Risk-level analysis highlights potential issues early.
5. Improved Financial Control
Cost and margin tracking improves profitability.
6. Scalable Solution
The dashboard supports multiple projects, cities, and phases.
How Does This Dashboard Support Better Decision-Making?
This dashboard empowers stakeholders to:
-
Monitor project progress continuously
-
Control cost overruns
-
Improve pricing strategies
-
Manage risks proactively
-
Align execution with financial goals
As a result, organizations shift from reactive to proactive management.
Best Practices for the Real Estate Development Dashboard in Power BI
To maximize dashboard value, follow these best practices.
Track the Right KPIs
Focus on KPIs aligned with business and project objectives.
Maintain Clean Data
Ensure consistent city, phase, and property type naming.
Update Data Regularly
Frequent updates ensure accurate insights.
Analyze Trends, Not Just Totals
Trends reveal patterns that totals cannot show.
Review Dashboard Periodically
Regular reviews improve accountability and outcomes.
Train Users
Ensure stakeholders understand slicers and visuals.
Common Mistakes to Avoid While Using Real Estate Dashboards
Avoid these common pitfalls:
-
Tracking too many KPIs
-
Ignoring risk indicators
-
Mixing different time periods
-
Not validating source data
-
Treating the dashboard as static
Avoiding these mistakes ensures long-term success.
Click to Purchases Real Estate Development Dashboard in Power BI
Who Can Use a Real Estate Development Dashboard in Power BI?
This dashboard benefits multiple roles:
-
Real Estate Developers
-
Project Managers
-
Finance and Cost Controllers
-
Investment Teams
-
Strategy and Planning Teams
-
Senior Leadership
Each role gains actionable insights from the same dashboard.
Power BI Dashboard vs Manual Reports: Why Power BI Wins
Compared to manual reports, Power BI dashboards:
-
Save time
-
Reduce errors
-
Improve visualization
-
Enable self-service analysis
-
Support faster decisions
Therefore, Power BI becomes the preferred choice for real estate analytics.
Click to Purchases Real Estate Development Dashboard in Power BI
Conclusion: Why Use a Real Estate Development Dashboard in Power BI?
A Real Estate Development Dashboard in Power BI transforms complex project data into clear, actionable insights. It improves transparency, enhances cost control, and supports smarter investment decisions.
With interactive pages, KPI cards, risk analysis, and monthly trends, this dashboard becomes an essential tool for modern real estate development.
If you want clarity, control, and confidence in project performance, this Power BI dashboard delivers exactly that.
Frequently Asked Questions (FAQs)
What is a Real Estate Development Dashboard in Power BI?
It is an interactive dashboard that tracks real estate project cost, revenue, progress, and risk in one place.
Can this dashboard handle multiple cities and phases?
Yes, it supports city-wise and phase-wise analysis effectively.
How often should data be refreshed?
Monthly or weekly refreshes work best, depending on reporting needs.
Does this dashboard support risk analysis?
Yes, it includes risk-level and in-progress analysis.
Can the dashboard be customized?
Yes, Power BI allows full customization of KPIs and visuals.
Is Power BI suitable for real estate analytics?
Yes, Power BI scales well for both small and large real estate portfolios.
Click to Purchases Real Estate Development Dashboard in Power BI
Visit our YouTube channel to learn step-by-step video tutorials