Real estate decisions depend heavily on accurate valuation, clear insights, and timely analysis. However, many real estate professionals still rely on scattered spreadsheets, manual calculations, and static reports. As a result, decision-making becomes slow, error-prone, and reactive.
That is exactly where a Real Estate Valuation Dashboard in Excel changes the game.
This article explains what a Real Estate Valuation Dashboard in Excel is, why property professionals need it, how it works, what pages and insights it offers, and how you can use it to make data-driven decisions effortlessly. Moreover, you will learn about its advantages, best practices, and commonly asked questions.
If you work in real estate sales, leasing, investment, or valuation, this guide will help you unlock the true power of Excel analytics.
Click to Purchases Real Estate Valuation Dashboard in Excel
What Is a Real Estate Valuation Dashboard in Excel?
A Real Estate Valuation Dashboard in Excel is a ready-to-use, interactive analytics tool designed to analyze property prices, valuation trends, rental income, and listing performance using structured Excel data.
Instead of checking multiple Excel sheets or creating manual reports, this dashboard consolidates all property-related insights into one visually powerful interface. Consequently, real estate agents, analysts, brokers, investors, and managers can monitor performance quickly and confidently.
Because Excel remains widely used and highly flexible, this dashboard works without complex tools, coding, or external software.
Why Do Real Estate Professionals Need a Valuation Dashboard?
Real estate markets change quickly. Therefore, professionals need clear visibility across pricing, valuation, rental income, and regional patterns.
However, traditional Excel sheets create several challenges:
-
Data remains scattered across files
-
Manual calculations create errors
-
Trend analysis takes too much time
-
Decision-making stays delayed
A Real Estate Valuation Dashboard in Excel solves all these challenges by converting raw data into actionable insights in real time.
As a result, users gain speed, accuracy, and clarity.
How Does a Real Estate Valuation Dashboard in Excel Work?
The dashboard works on a structured data-driven approach.
First, users capture property-level data in a backend Excel Data Sheet. Then, Excel formulas, pivot tables, slicers, and charts transform that data into interactive visuals.
Moreover, the dashboard includes:
-
Centralized data control
-
Dynamic slicers for filtering
-
Automated calculations
-
Visual charts and KPI cards
Because of this design, even non-technical users can operate the dashboard easily.
What Are the Key Features of the Real Estate Valuation Dashboard in Excel?
This dashboard comes as a ready-to-use Excel file with structured analytics pages and intuitive navigation.
✅ Page Navigator for Easy Navigation
A Page Navigator on the left side allows users to move instantly between different analytical pages. Therefore, users never waste time searching for sheets.
What Insights Does the Overview Page Provide?
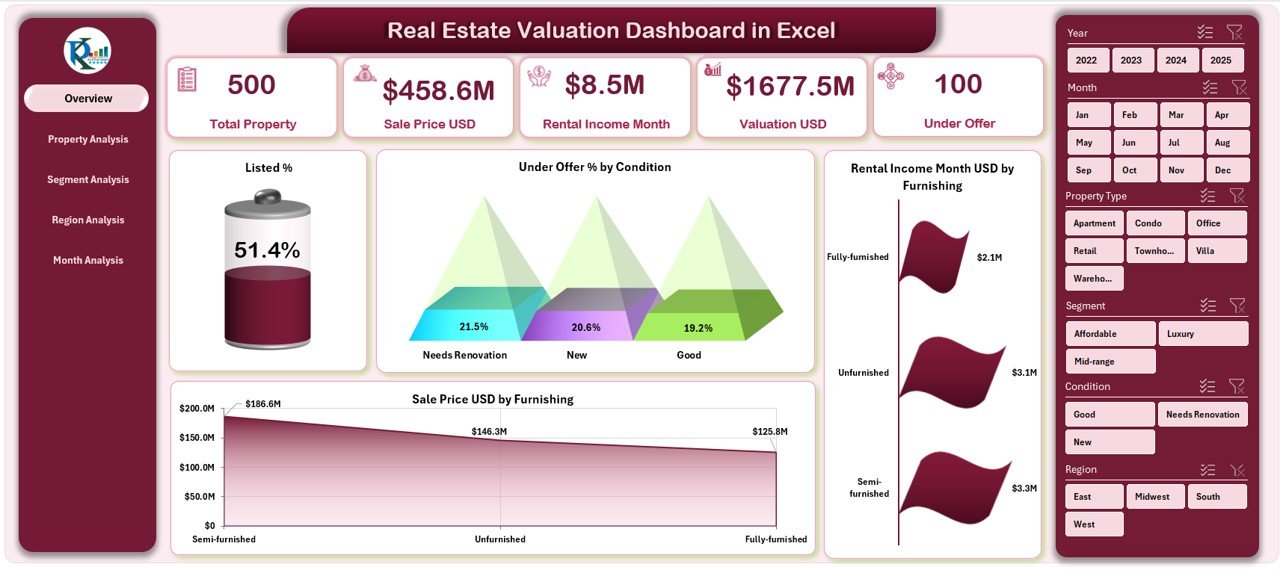
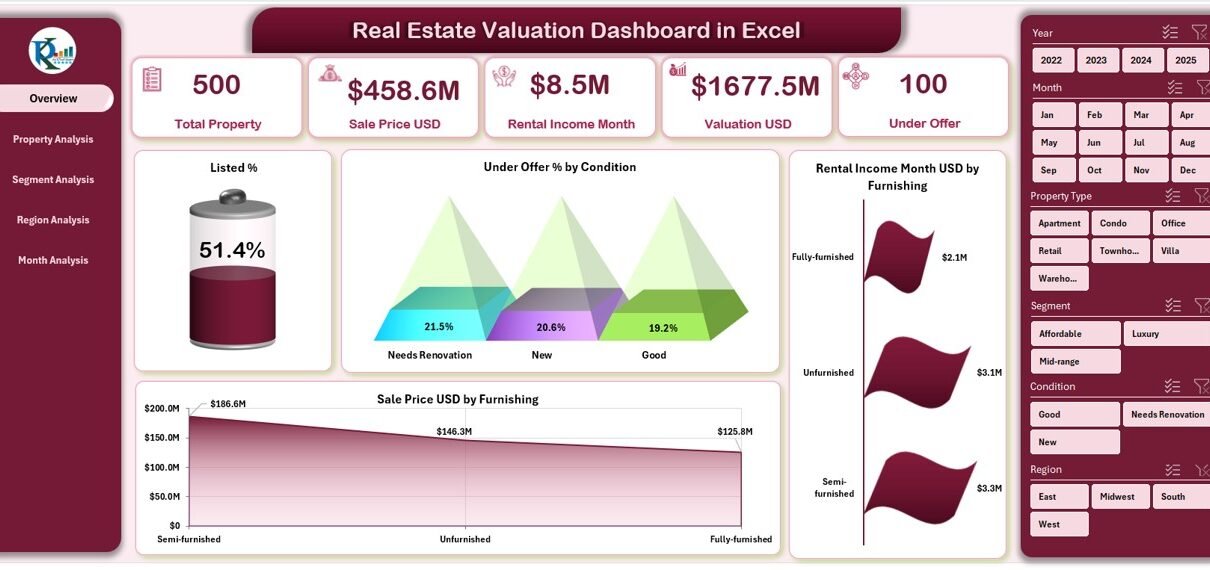
📌 Overview Page Explained
The Overview Page acts as the command center of the Real Estate Valuation Dashboard in Excel.
Key Elements of the Overview Page:
✅ Right-Side Slicer
Users can filter the entire dashboard using slicers such as:
-
Property condition
-
Furnishing status
-
Time period
-
Region or segment
Because of slicers, analysis stays flexible and fast.
✅ KPI Cards (5 Cards)
The dashboard highlights critical KPIs at a glance, such as:
Click to Purchases Real Estate Valuation Dashboard in Excel
-
Total properties
-
Listed percentage
-
Under-offer percentage
-
Total valuation
-
Total rental income
As a result, users get instant performance visibility.
✅ Analytical Charts (4 Charts)
The Overview Page includes the following charts:
-
Listed % by Condition
-
Under Offer % by Condition
-
Rental Income per Month (USD) by Furnishing
-
Sales Price (USD) by Furnishing
These visuals quickly reveal how property conditions and furnishing levels affect pricing and demand.
How Does the Property Analysis Page Help?
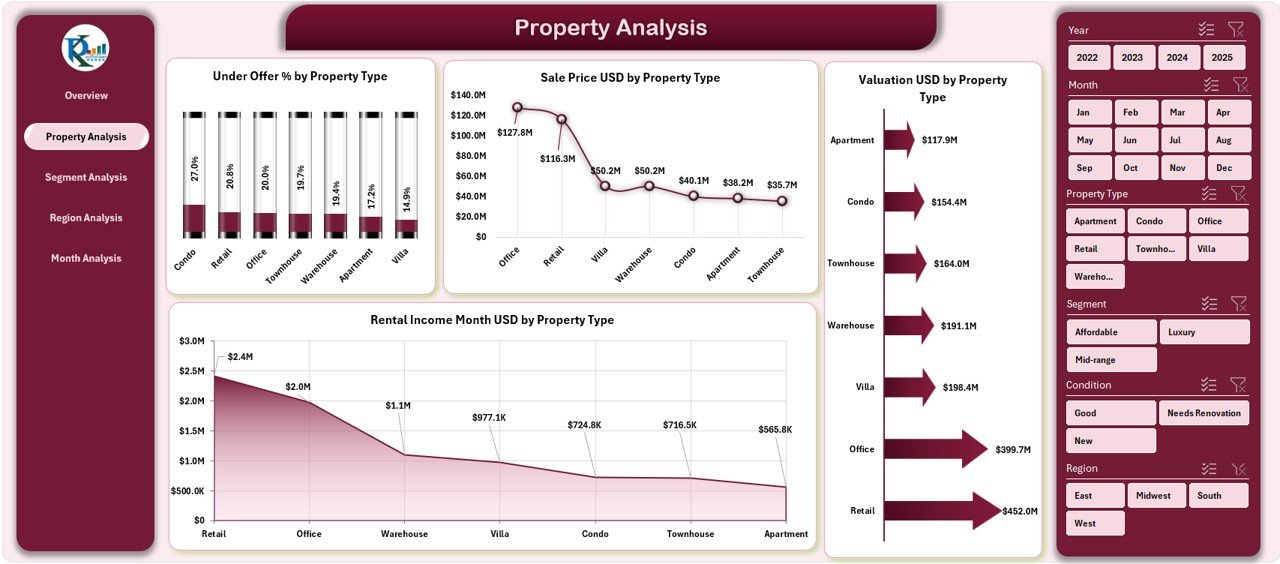
📌 Property Analysis Page Explained
The Property Analysis Page focuses on comparing property types such as apartments, villas, commercial units, or land.
Insights Provided:
-
Under Offer % by Property Type
-
Sales Price (USD) by Property Type
-
Valuation (USD) by Property Type
-
Rental Income per Month (USD) by Property Type
With these charts, users can easily identify:
-
High-value property types
-
Strong rental performers
-
Property types with fast demand
Because of this clarity, investment decisions improve significantly.
Why Is Segment Analysis Important in Real Estate?
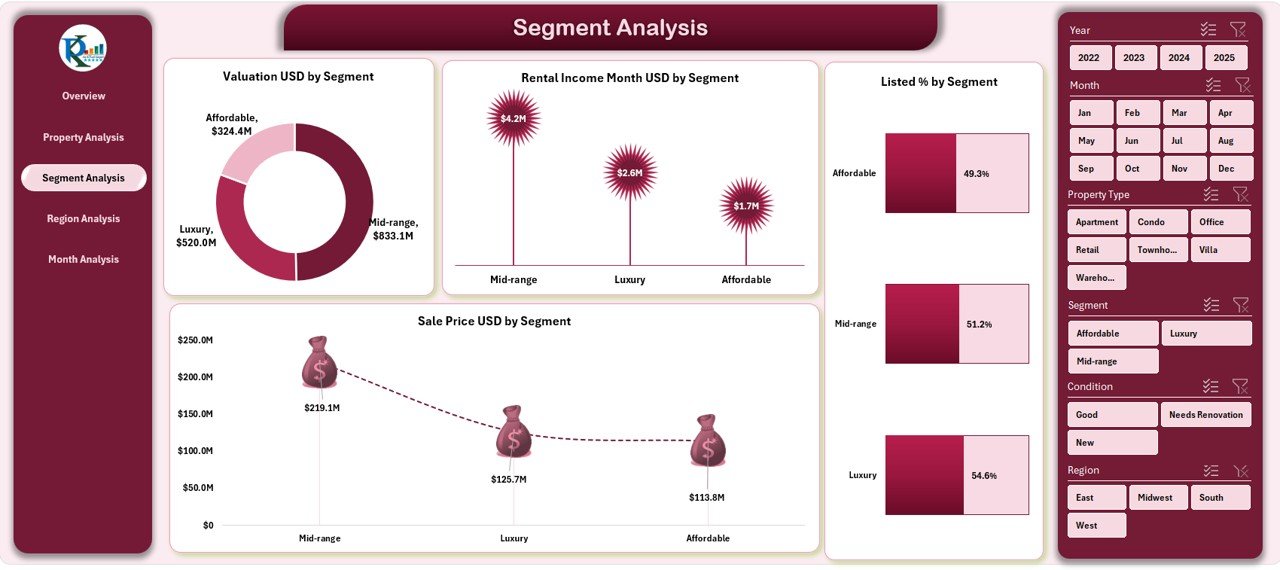
📌 Segment Analysis Page Explained
The Segment Analysis Page shows how different customer or market segments perform.
Charts Included:
Click to Purchases Real Estate Valuation Dashboard in Excel
-
Valuation (USD) by Segment
-
Rental Income per Month (USD) by Segment
-
Listed % by Segment
-
Sales Price (USD) by Segment
Therefore, users can:
-
Identify premium vs budget segments
-
Understand demand patterns
-
Focus marketing efforts effectively
Segment-wise analysis plays a crucial role in maximizing returns.
How Does the Region Analysis Page Improve Location Decisions?
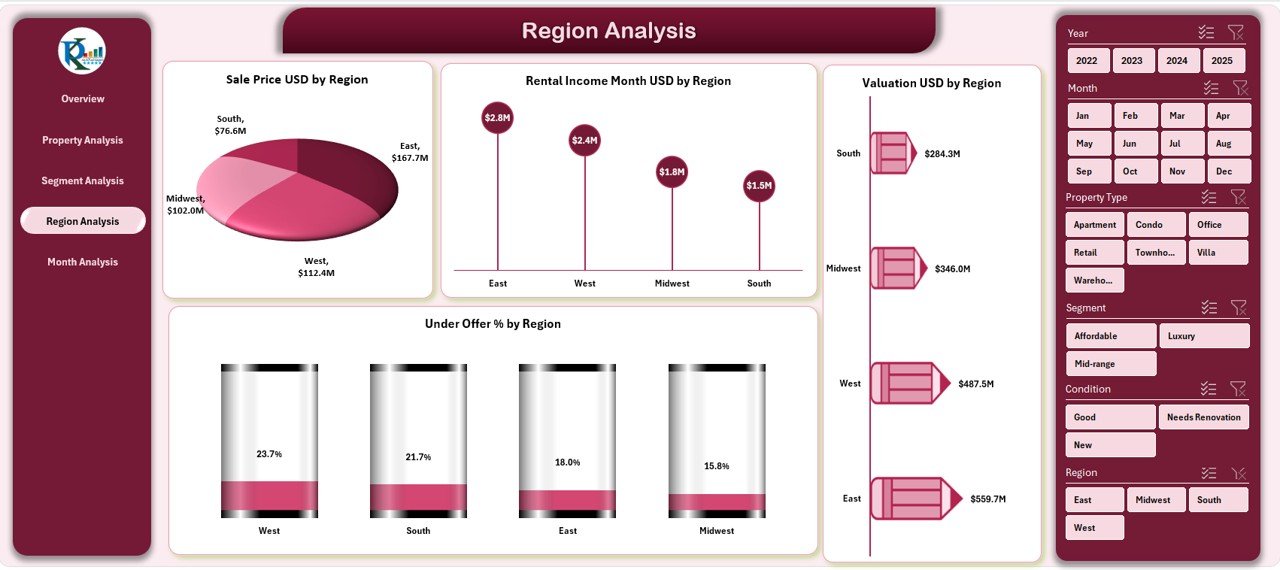
📌 Region Analysis Page Explained
Location drives real estate value. Hence, the Region Analysis Page provides location-based insights.
Key Charts:
-
Sales Price (USD) by Region
-
Rental Income per Month (USD) by Region
-
Valuation (USD) by Region
-
Under Offer % by Region
As a result, users can:
-
Compare regional pricing
-
Identify high-growth regions
-
Spot undervalued locations
This page supports smart geographic investment planning.
What Trends Does the Month Analysis Page Reveal?
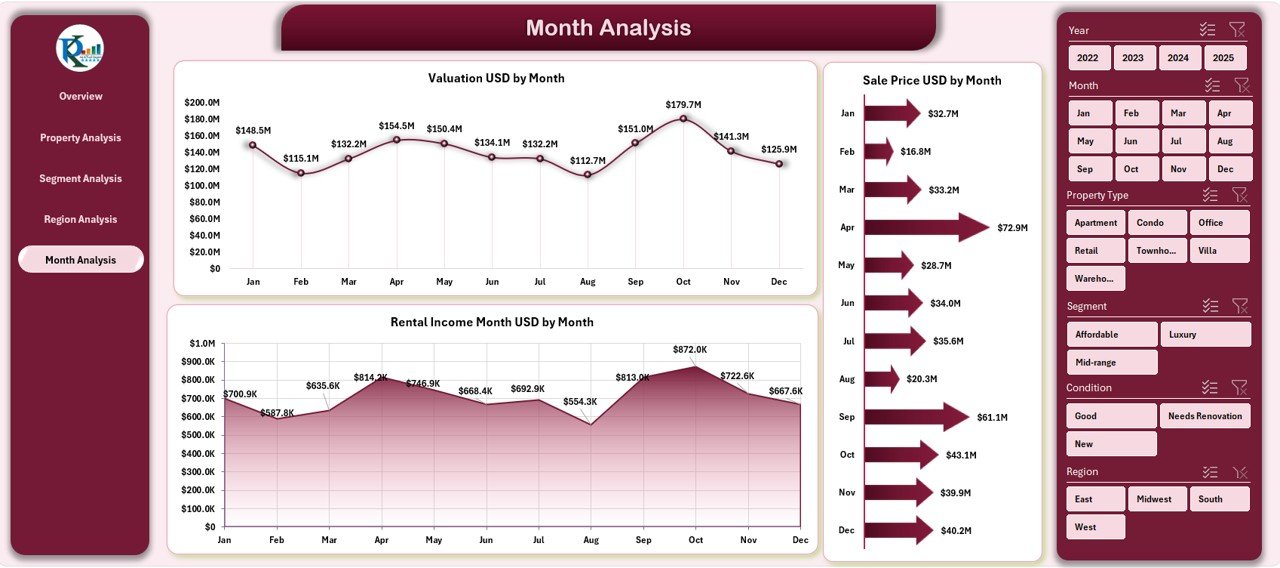
📌 Month Analysis Page Explained
Market trends change over time. Therefore, the Month Analysis Page tracks performance month by month.
Charts on This Page:
-
Valuation (USD) by Month
-
Sales Price (USD) by Month
-
Rental Income per Month (USD) by Month
With this time-based view, users can:
-
Identify seasonal trends
-
Track market cycles
-
Plan launches and pricing strategies
Time-series analysis strengthens forecasting accuracy.
What Is the Purpose of the Support Sheet?
Click to Purchases Real Estate Valuation Dashboard in Excel
The Support Sheet works behind the scenes and manages:
-
Lookup tables
-
Helper calculations
-
Pivot dependencies
Although users rarely interact with it, this sheet ensures smooth dashboard performance.
What Data Does the Data Sheet Contain?
The Data Sheet acts as the backbone of the dashboard.
It stores structured records such as:
-
Property ID
-
Property type
-
Segment
-
Region
-
Condition
-
Furnishing status
-
Sales price
-
Valuation amount
-
Monthly rental income
-
Listing and offer status
-
Date or month
Because data stays clean and standardized, reporting remains accurate.
Advantages of Real Estate Valuation Dashboard in Excel
A Real Estate Valuation Dashboard in Excel offers multiple benefits for individuals and organizations.
✅ Key Advantages:
-
🚀 Faster decision-making through visual insights
-
📊 Centralized real estate performance tracking
-
🧩 No dependency on complex tools or software
-
🔍 Clear comparison across property types and regions
-
📈 Better pricing and valuation strategies
-
💼 Highly suitable for agents, investors, and analysts
-
⚙️ Easy customization and scalability
Therefore, Excel dashboards remain one of the most cost-effective real estate analytics solutions.
Who Can Use a Real Estate Valuation Dashboard in Excel?
This dashboard works perfectly for:
-
Real estate agents and brokers
-
Property valuation analysts
-
Real estate investors
-
Asset management teams
-
Real estate consulting firms
-
Property developers
-
Leasing and rental managers
Because Excel stays familiar to most users, training time remains minimal.
Best Practices for the Real Estate Valuation Dashboard in Excel
To get maximum value from this dashboard, follow these best practices:
✅ Data Best Practices
-
Keep formats consistent
-
Avoid blank or duplicate entries
-
Update data regularly
-
Use validation where possible
✅ Dashboard Usage Best Practices
-
Apply slicers before analysis
-
Review trends over multiple months
-
Compare valuation with sales price
-
Track under-offer ratios closely
✅ Maintenance Best Practices
-
Protect formula cells
-
Maintain backup versions
-
Review KPIs quarterly
-
Update lookup tables when needed
Following these practices ensures long-term accuracy and reliability.
How Does This Dashboard Improve Real Estate Strategy?
Because this dashboard combines valuation, pricing, rental income, and market trends, it allows professionals to:
-
Identify undervalued properties early
-
Optimize pricing strategies
-
Improve portfolio performance
-
Reduce manual reporting efforts
-
Present insights confidently to stakeholders
As a result, organizations gain both operational and strategic advantages.
Conclusion
A Real Estate Valuation Dashboard in Excel transforms raw property data into clear, actionable insights. Instead of working with fragmented spreadsheets, real estate professionals gain a single source of truth for valuations, sales prices, rental income, and market trends.
With multiple analysis pages, intuitive navigation, and powerful visuals, this dashboard supports smarter decisions, faster reporting, and better investment outcomes.
If you want a reliable, flexible, and cost-effective real estate analytics solution, this Excel dashboard delivers exceptional value.
Frequently Asked Questions (FAQs)
❓ What is a Real Estate Valuation Dashboard in Excel used for?
It helps analyze property valuation, sales price, rental income, and listing status across regions, segments, and time periods.
❓ Do I need advanced Excel knowledge to use this dashboard?
No. Basic Excel knowledge works well because slicers and visuals handle most interactions.
❓ Can I customize the dashboard?
Yes. You can add KPIs, charts, segments, or additional filters based on business needs.
❓ Can this dashboard handle large datasets?
Yes. With structured tables and pivot models, it scales efficiently.
❓ Is this dashboard suitable for real estate investors?
Absolutely. Investors can track valuation trends, rental returns, and regional performance easily.
❓ Does the dashboard update automatically?
Yes. Once you update the data sheet, all visuals refresh instantly.
❓ Can I use this dashboard for presentations?
Yes. The dashboard works perfectly for management reviews, investor meetings, and client discussions.
Visit our YouTube channel to learn step-by-step video tutorials