In today’s sustainability-driven world, recycling companies play a critical role in protecting the environment and supporting the circular economy. However, many recycling businesses still depend on scattered spreadsheets and manual reports. As a result, managers struggle to track collection volumes, processing efficiency, revenue per ton, contamination rates, and operational costs in one centralized view.
So, how can recycling companies monitor operational performance, financial health, and sustainability impact in a structured and smart way?
The answer is simple.
Click to Purchases Recycling Companies KPI Dashboard in Excel
You need a Recycling Companies KPI Dashboard in Excel.
This ready-to-use Excel template helps recycling plants, waste management firms, material recovery facilities (MRFs), and environmental service providers track key performance indicators (KPIs) in one dynamic dashboard. Moreover, it offers real-time monthly and yearly performance comparison. Therefore, you gain better visibility, faster decisions, and stronger operational control.
In this detailed guide, you will learn:
-
What a Recycling Companies KPI Dashboard in Excel is
-
Why recycling businesses need KPI tracking
-
Detailed explanation of all 7 worksheets
-
Important KPIs for recycling companies
-
Advantages of the Recycling Companies KPI Dashboard in Excel
-
Best practices for implementation
-
Frequently Asked Questions with Answers
Let us explore everything step by step.
What Is a Recycling Companies KPI Dashboard in Excel?
A Recycling Companies KPI Dashboard in Excel is a structured performance management tool designed to track, measure, and analyze recycling operations using measurable indicators.
Instead of reviewing multiple files and manual summaries, you can monitor all operational, financial, and sustainability KPIs in one interactive dashboard. Consequently, you save time and reduce reporting errors.
Furthermore, this dashboard allows you to:
-
Track monthly and yearly recycling volumes
-
Compare actual vs target performance
-
Analyze previous year comparisons
-
Monitor operational efficiency
-
Identify underperforming areas instantly
Because Excel offers flexibility and automation, this dashboard works perfectly for small, medium, and large recycling companies.
Why Do Recycling Companies Need KPI Tracking?
Recycling businesses operate in a complex environment. They deal with collection logistics, material sorting, processing efficiency, compliance standards, and fluctuating commodity prices. Therefore, performance tracking becomes essential.
Without KPI monitoring:
-
Managers cannot detect rising contamination rates.
-
Plants cannot track downtime effectively.
-
Finance teams cannot measure cost per ton accurately.
-
Leadership cannot compare performance year over year.
However, when you use a KPI dashboard, you:
-
Improve transparency
-
Strengthen accountability
-
Make data-driven decisions
-
Improve sustainability reporting
-
Increase profitability
Therefore, KPI tracking does not only improve reporting. It directly improves operational performance.
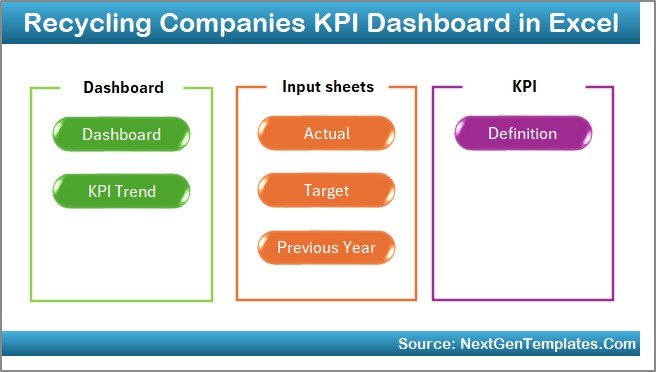
Detailed Explanation of the 7 Worksheets in the Dashboard
This ready-to-use Recycling Companies KPI Dashboard in Excel contains 7 structured worksheets. Each worksheet plays a specific role in performance management.
Let us explore each one in detail.
1️⃣ Home Sheet – Your Navigation Center
The Home sheet acts as an index page.
Here, you will find:
-
6 interactive navigation buttons
-
Quick access to all sheets
-
Structured layout for easy movement
Instead of scrolling through tabs, you can jump directly to:
-
Dashboard
-
KPI Trend
-
Actual Input
-
Target
-
Previous Year
-
KPI Definition
Therefore, this sheet improves usability and user experience.
Click to Purchases Recycling Companies KPI Dashboard in Excel
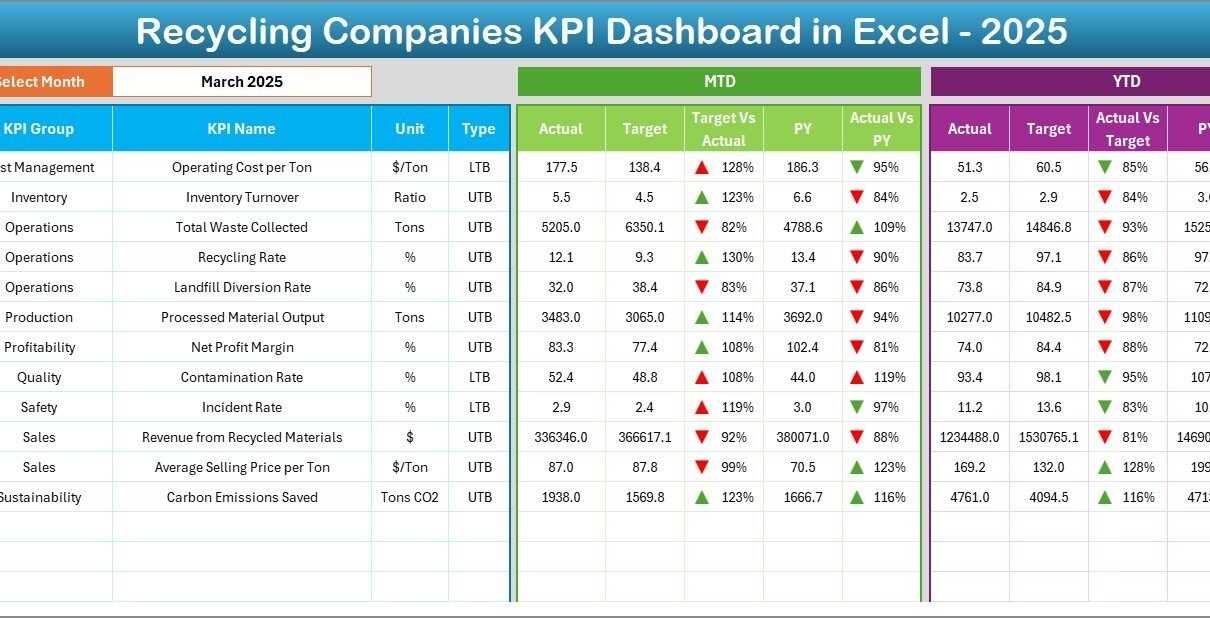
2️⃣ Dashboard Sheet Tab – The Main Performance View
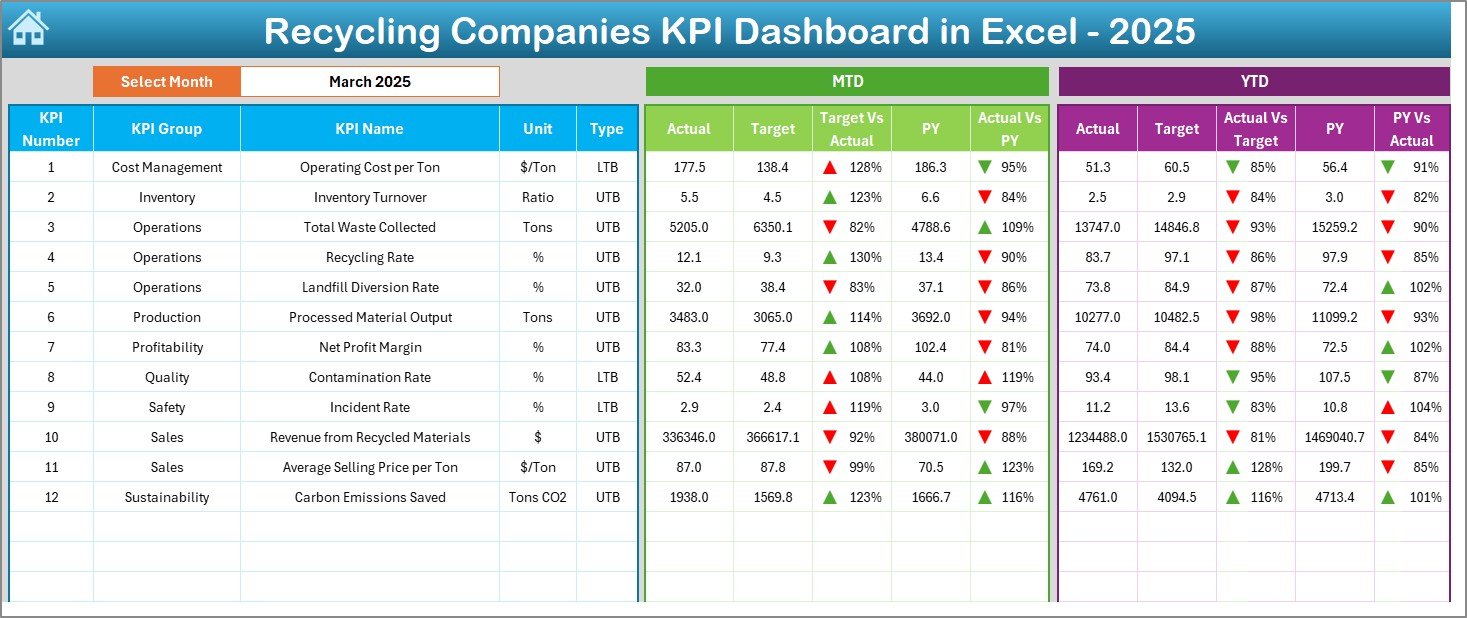
The Dashboard sheet serves as the core of the template. Here, you see the complete KPI summary.
How Does It Work?
On Cell D3, you can select the Month from a drop-down list. Once you select a month, the entire dashboard updates automatically.
What Information Does It Display?
For each KPI, the dashboard shows:
MTD (Month-to-Date) Section:
-
Actual
-
Target
-
Previous Year
-
Target vs Actual (with conditional formatting arrow)
-
Previous Year vs Actual (with conditional formatting arrow)
YTD (Year-to-Date) Section:
-
Actual
-
Target
-
Previous Year
-
Target vs Actual comparison
-
Previous Year vs Actual comparison
Because of conditional formatting with up and down arrows, you instantly see whether performance improves or declines.
As a result, managers can quickly identify problem areas without deep analysis.
3️⃣ KPI Trend Sheet Tab – Deep Performance Analysis
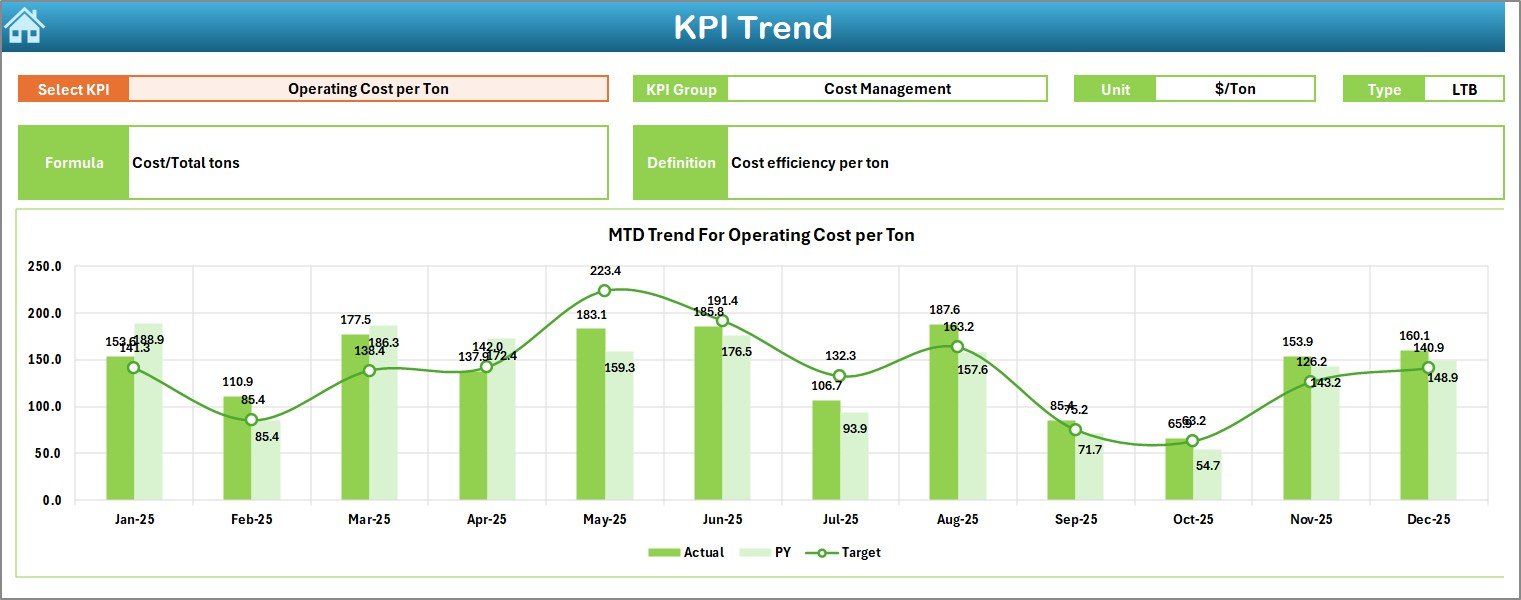
The KPI Trend sheet allows detailed KPI-level analysis.
On Cell C3, you can select the KPI Name from a drop-down.
Once you select a KPI, the sheet automatically displays:
-
KPI Group
-
Unit of KPI
-
KPI Type (Lower the Better or Upper the Better)
-
Formula
-
Definition
Additionally, you will see:
-
MTD Trend Chart (Actual vs Target vs Previous Year)
-
YTD Trend Chart (Actual vs Target vs Previous Year)
Therefore, this sheet helps managers understand performance movement over time.
Instead of guessing trends, you can visually track improvements or declines.
Click to Purchases Recycling Companies KPI Dashboard in Excel
4️⃣ Actual Numbers Input Sheet – Data Entry Made Simple
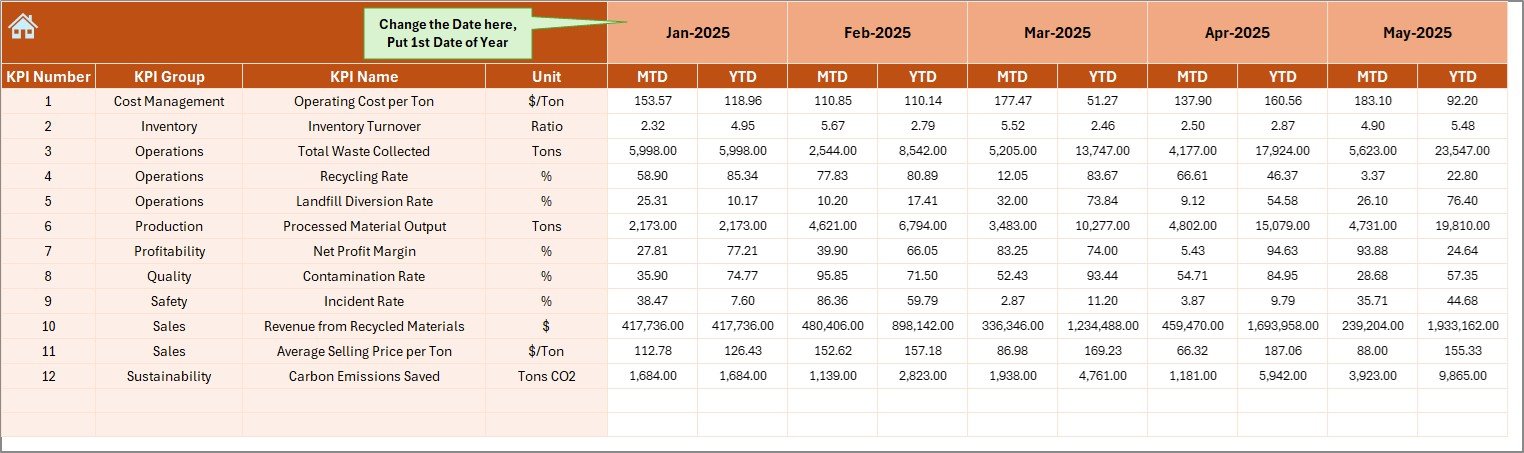
The Actual Numbers Input sheet captures real operational data.
How to Use It:
-
Enter the first month of the year in Cell E1
-
Input MTD and YTD actual numbers
-
Update data monthly
Because this sheet drives the dashboard, accurate data entry ensures reliable reporting.
5️⃣ Target Sheet Tab – Set Your Performance Goals
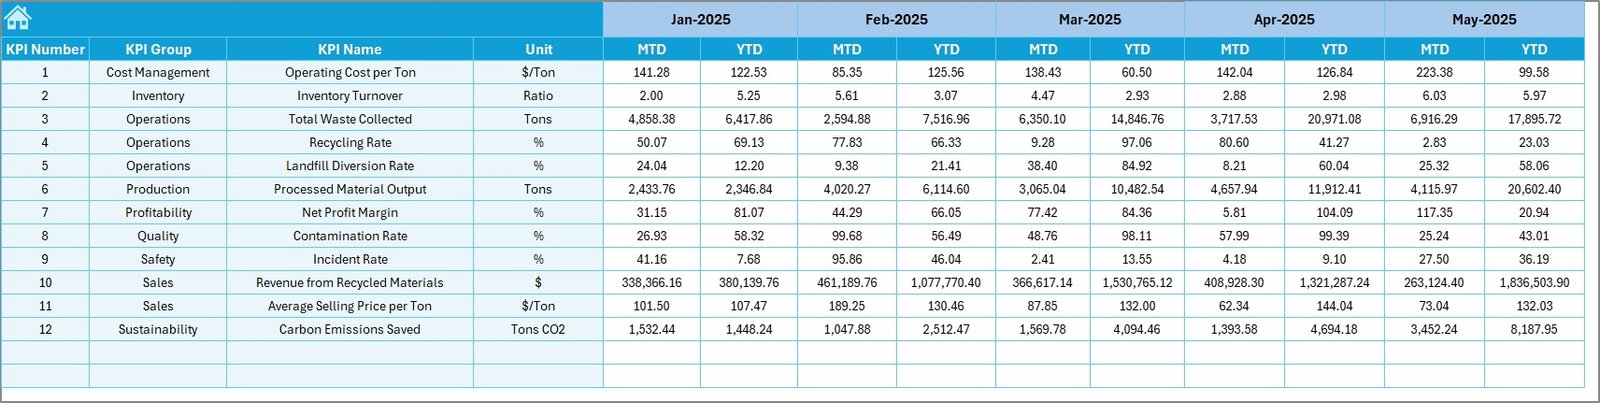
The Target sheet allows you to define performance benchmarks.
Here, you enter:
-
Monthly MTD targets
-
Monthly YTD targets
Targets help management measure performance gaps. Without targets, you cannot measure success.
Therefore, this sheet plays a strategic role in performance management.
6️⃣ Previous Year Number Sheet – Historical Comparison
In this sheet, you enter last year’s data.
Why does this matter?
Because year-over-year comparison reveals:
-
Growth rate
-
Operational improvements
-
Revenue increase
-
Efficiency gains
Without historical comparison, performance analysis remains incomplete.
7️⃣ KPI Definition Sheet Tab – Your KPI Master Library
The KPI Definition sheet stores:
-
KPI Name
-
KPI Group
-
Unit
-
Formula
-
Definition
This sheet ensures clarity.
When everyone understands KPI formulas and definitions, reporting remains consistent.
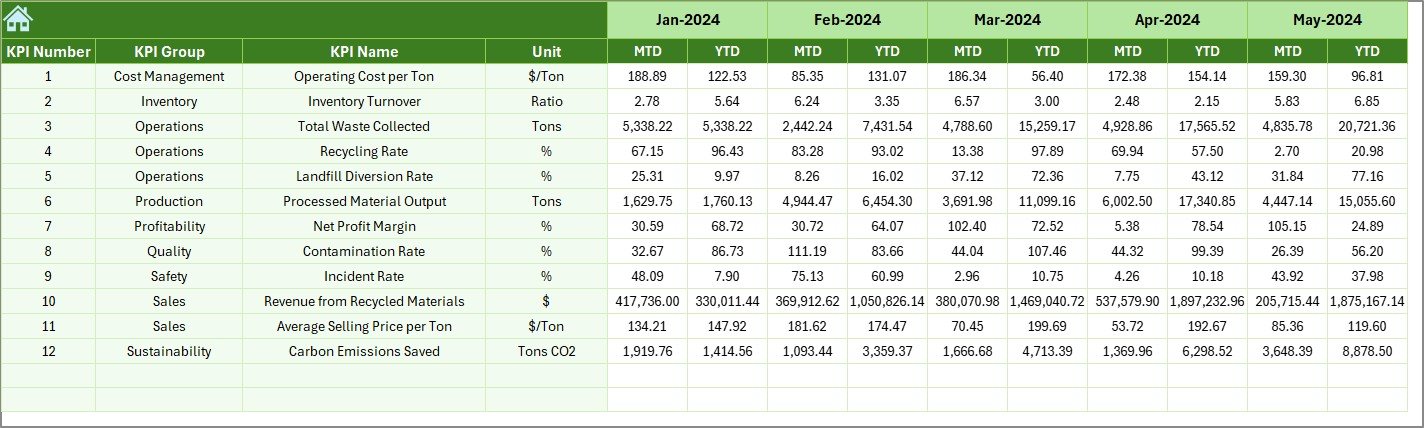
Important KPIs for Recycling Companies
Now let us explore key KPIs that recycling companies should track.
Operational KPIs
-
Total Waste Collected (Tons)
-
Total Waste Processed
-
Plant Utilization Rate
-
Equipment Downtime
-
Sorting Accuracy Rate
-
Contamination Rate (LTB)
Financial KPIs
-
Revenue per Ton
-
Processing Cost per Ton (LTB)
-
Gross Margin
-
Transportation Cost
-
Operating Expense Ratio
Sustainability KPIs
-
Recycling Rate
-
Landfill Diversion Rate
-
Carbon Emission Reduction
-
Energy Consumption per Ton (LTB)
-
Water Usage per Ton (LTB)
Productivity KPIs
-
Labor Productivity
-
Average Processing Time
-
Vehicle Utilization Rate
Tracking these KPIs improves efficiency and sustainability simultaneously.
Advantages of Recycling Companies KPI Dashboard in Excel
Click to Purchases Recycling Companies KPI Dashboard in Excel
Now let us discuss the major benefits.
1️⃣ Centralized Performance Monitoring
You can monitor all KPIs in one dashboard. Therefore, you eliminate multiple spreadsheets.
2️⃣ Real-Time Decision Making
Because the dashboard updates instantly after month selection, you gain faster insights.
3️⃣ Improved Accountability
Clear targets and comparisons improve team responsibility.
4️⃣ Enhanced Sustainability Reporting
You can measure environmental impact and compliance performance effectively.
5️⃣ Easy Customization
Excel allows easy modification based on company size or KPI structure.
6️⃣ Cost-Effective Solution
Unlike expensive software, Excel provides an affordable yet powerful solution.
Best Practices for the Recycling Companies KPI Dashboard in Excel
To maximize results, follow these best practices:
✔ Maintain Accurate Data Entry
Always validate input numbers before updating.
✔ Update Monthly Without Delay
Consistent updates ensure trend reliability.
✔ Review KPI Definitions Regularly
Make sure formulas align with business goals.
✔ Focus on Actionable KPIs
Do not track unnecessary metrics.
✔ Analyze Trends, Not Just Numbers
Trends reveal patterns better than single-month results.
✔ Conduct Monthly Review Meetings
Discuss dashboard findings with management and operations teams.
How Does This Dashboard Improve Operational Efficiency?
Click to Purchases Recycling Companies KPI Dashboard in Excel
This dashboard improves efficiency because:
-
Managers identify bottlenecks quickly
-
Teams respond to rising contamination rates immediately
-
Finance teams control cost per ton effectively
-
Leadership monitors growth trends clearly
Therefore, the dashboard supports proactive management instead of reactive decisions.
How Does It Support Sustainability Goals?
Recycling companies must meet environmental standards. This dashboard helps because:
-
It tracks landfill diversion rate
-
It measures recycling percentage
-
It monitors energy consumption
-
It compares environmental performance year over year
Consequently, companies can demonstrate compliance and sustainability impact.
Conclusion
Recycling companies operate in a competitive and environmentally sensitive industry. Therefore, they need structured performance monitoring tools.
The Recycling Companies KPI Dashboard in Excel offers:
-
Real-time KPI monitoring
-
MTD and YTD comparison
-
Target vs Actual analysis
-
Previous year comparison
-
Trend analysis
-
Structured KPI definitions
Because it centralizes performance data, it improves transparency and efficiency. Moreover, it supports better financial control and sustainability management.
If you want to strengthen your recycling operations, improve reporting clarity, and drive measurable growth, this dashboard becomes your ultimate performance management tool.
Frequently Asked Questions with Answers
1️⃣ What is the main purpose of the Recycling Companies KPI Dashboard in Excel?
This dashboard helps recycling companies track operational, financial, and sustainability KPIs in one centralized system.
2️⃣ Can small recycling businesses use this template?
Yes. Small, medium, and large recycling companies can use this Excel template easily.
3️⃣ Does the dashboard update automatically?
Yes. When you select a month in Cell D3, the dashboard updates automatically.
4️⃣ Can I customize KPIs?
Yes. You can modify KPI definitions, targets, and formulas based on your company’s needs.
5️⃣ Why does the dashboard include Previous Year comparison?
Previous year comparison helps measure growth, efficiency improvements, and operational progress.
6️⃣ Do I need advanced Excel skills to use it?
No. The template provides structured input sheets and automated calculations, so basic Excel knowledge works fine.
Visit our YouTube channel to learn step-by-step video tutorials
Click to Purchases Recycling Companies KPI Dashboard in Excel
Watch the step-by-step video tutorial: