Managing refinery contracts is never simple. In fact, refinery operations involve high-value agreements, long-term vendor relationships, strict compliance requirements, and continuous monitoring of renewals, values, and risks. Therefore, when organizations rely on manual spreadsheets or disconnected reports, they often face missed renewals, cost leakages, and unclear visibility.
That is exactly where a Refinery Contract Management Dashboard in Power BI becomes essential.
In this detailed and SEO-friendly guide, you will learn everything about the Refinery Contract Management Dashboard in Power BI. Moreover, you will understand its structure, features, advantages, best practices, and real-world benefits. In addition, this article explains how such a dashboard transforms raw contract data into clear, actionable insights for refinery leadership.
Click to Purchases Refinery Contract Management Dashboard in Power BI
What Is a Refinery Contract Management Dashboard in Power BI?
A Refinery Contract Management Dashboard in Power BI is an interactive business intelligence solution that helps refinery organizations track, analyze, and manage contract-related data using visual reports and KPIs.
Instead of managing contracts through scattered Excel files, emails, and manual logs, this dashboard centralizes all contract information into a single Power BI report. As a result, users gain instant visibility into contract values, renewal status, vendor performance, department exposure, and monthly trends.
Moreover, Power BI enables real-time filtering, dynamic charts, and easy drill-downs. Consequently, contract managers can quickly identify risks, opportunities, and performance gaps without technical complexity.
Why Do Refineries Need a Contract Management Dashboard?
Refinery contracts involve millions in annual value. Therefore, even small inefficiencies can result in significant financial impact.
Here is why refineries increasingly adopt a Contract Management Dashboard in Power BI:
-
Contracts expire across different dates and departments
-
Vendor agreements vary in duration and value
-
Renewals require timely action to avoid penalties
-
Management teams need consolidated visibility
-
Compliance and audits demand accurate reporting
However, manual tracking fails to meet these needs. In contrast, a Power BI dashboard delivers structure, automation, and clarity.
Key Objectives of a Refinery Contract Management Dashboard
A well-designed dashboard focuses on clear business objectives. Therefore, the Refinery Contract Management Dashboard aims to:
-
Centralize all contract data
-
Track renewal and termination risks
-
Monitor annual contract value exposure
-
Evaluate vendor and department performance
-
Identify monthly and location-wise trends
-
Support proactive contract decisions
Because of these objectives, decision-makers can act early instead of reacting late.
Overview of the Refinery Contract Management Dashboard in Power BI
This dashboard contains 5 professionally designed pages in the Power BI Desktop application. Each page focuses on a specific analytical area. Moreover, all pages include slicers for dynamic filtering, which allows users to interact with the data easily.
Let us explore each dashboard page in detail.
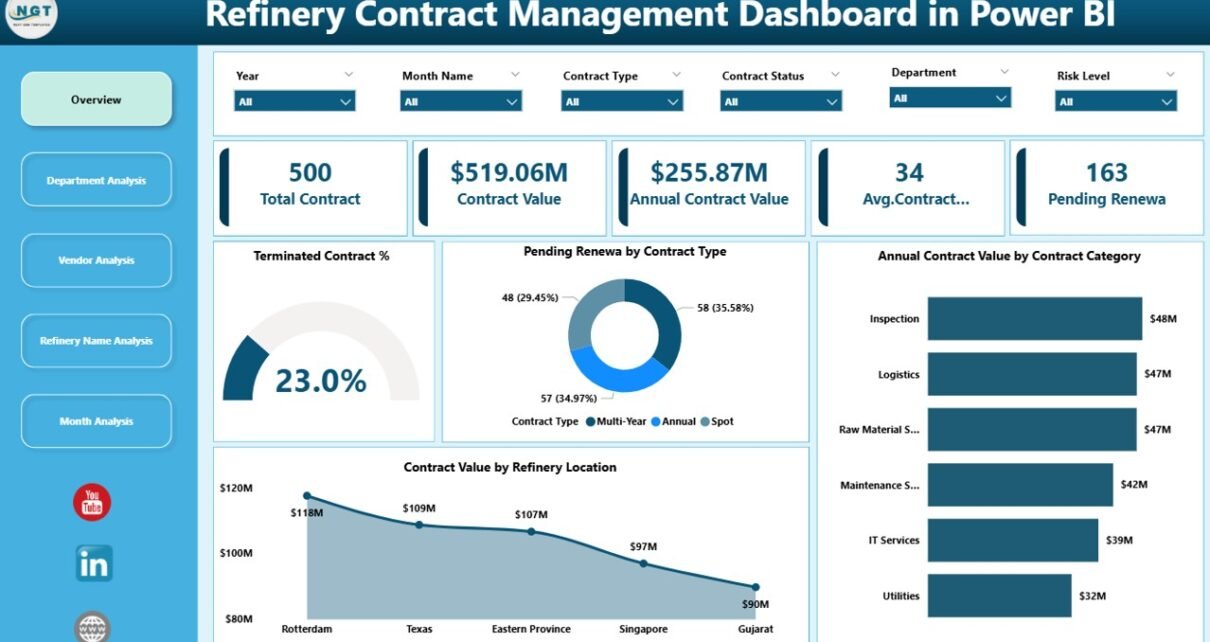
1. Overview Page: The Executive Snapshot
The Overview Page serves as the main landing page of the dashboard. It provides high-level insights for senior management and contract leaders.
What Does the Overview Page Show?
This page includes:
KPI Cards
-
Total Contracts
-
Active Contracts
-
Pending Renewals
-
Terminated Contracts %
These cards offer instant clarity about the overall contract landscape.
Key Charts on the Overview Page
-
Terminated Contract %
Helps identify contract closures and risk exposure. -
Pending Renew by Contract Type
Shows renewal requirements across different contract categories. -
Annual Contract Value by Contract Category
Highlights where most spending occurs. -
Contract Value by Refinery Location
Reveals location-wise contract exposure.
Because of this layout, executives can understand the entire contract portfolio in seconds.
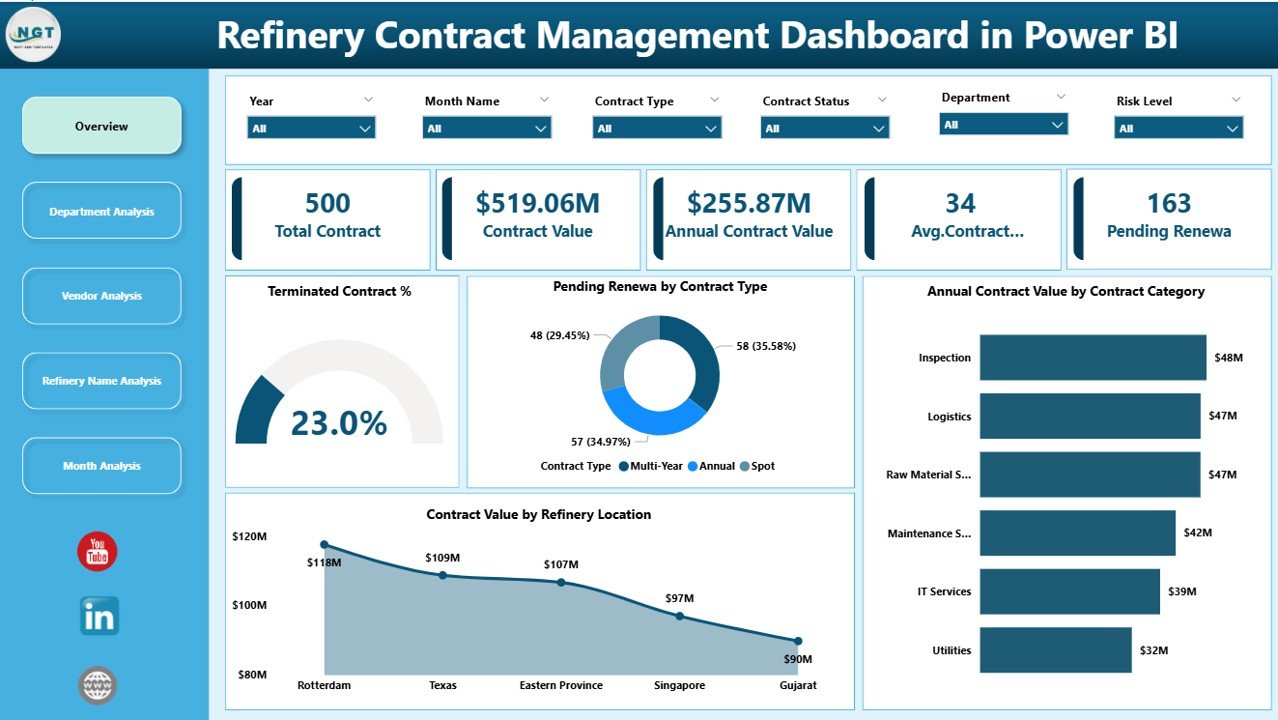
2. Department Analysis Dashboard: Contract Exposure by Function
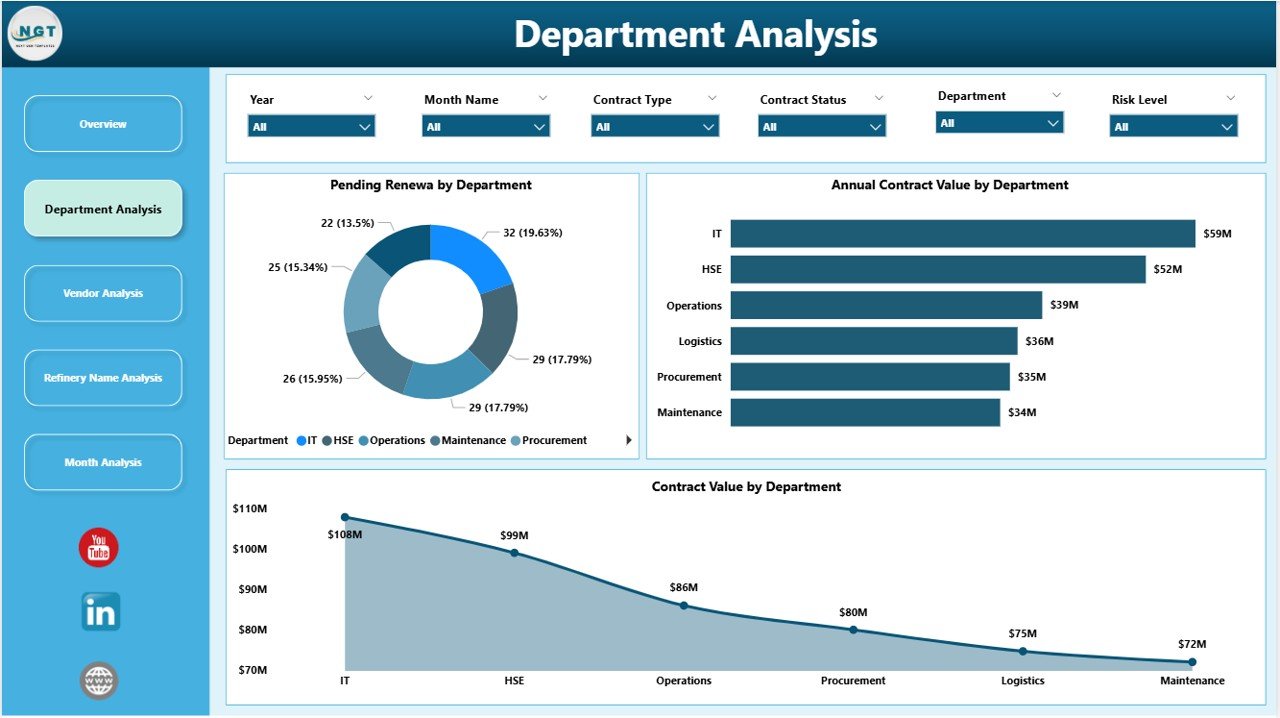
The Department Analysis page focuses on how contracts distribute across departments.
Why Is Department Analysis Important?
Departments often manage different types of contracts. Therefore, tracking department-wise exposure ensures accountability and balanced risk management.
Key Visuals on the Department Analysis Page
-
Pending Renew by Department
Identifies departments with upcoming renewals. -
Annual Contract Value by Department
Shows budget exposure for each department. -
Contract Value by Department
Helps compare total contract commitments.
As a result, contract managers can prioritize renewals and reviews based on department risk.
Click to Purchases Refinery Contract Management Dashboard in Power BI
3. Vendor Analysis Dashboard: Measuring Vendor Relationships
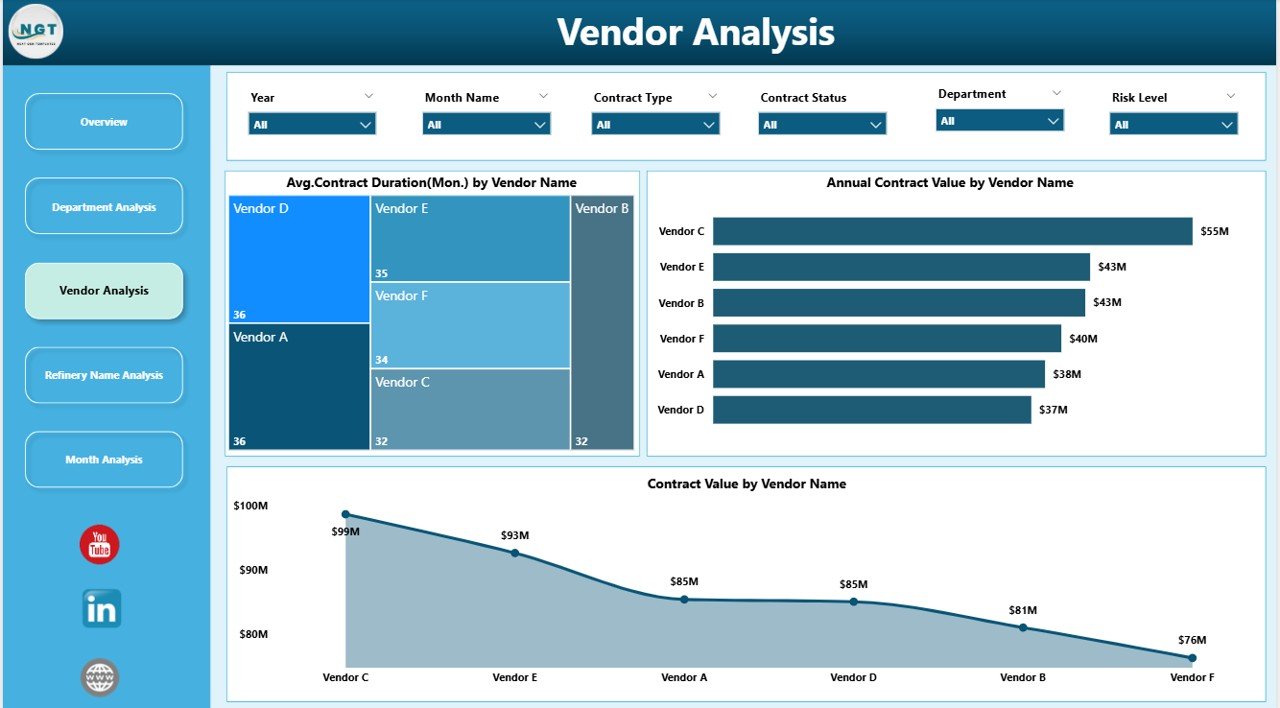
Vendor performance directly affects refinery operations. Therefore, the Vendor Analysis Dashboard plays a critical role.
Key Charts in Vendor Analysis
-
Average Contract Duration by Vendor Name
Indicates long-term versus short-term vendor relationships. -
Annual Contract Value by Vendor Name
Highlights high-value vendors. -
Contract Value by Vendor Name
Shows total business volume with each vendor.
Because of these insights, organizations can renegotiate terms, consolidate vendors, or reduce dependency risks.
4. Refinery Name Analysis Dashboard: Location-Wise Contract Insights
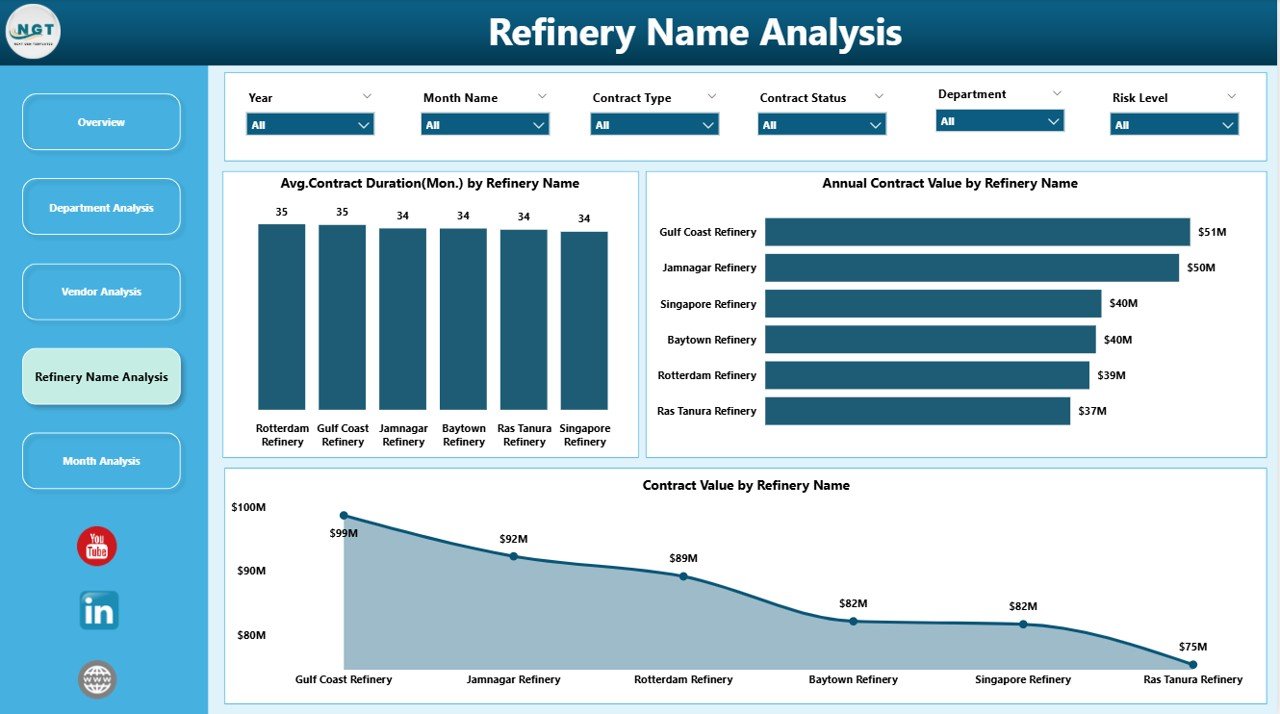
Large organizations operate multiple refineries. Therefore, location-specific contract analysis becomes essential.
What Does This Page Show?
-
Average Contract Duration by Refinery Name
-
Annual Contract Value by Refinery Name
-
Contract Value by Refinery Name
With this information, leadership can compare contract maturity, spending, and vendor concentration across refineries.
5. Monthly Trends Dashboard: Tracking Time-Based Patterns
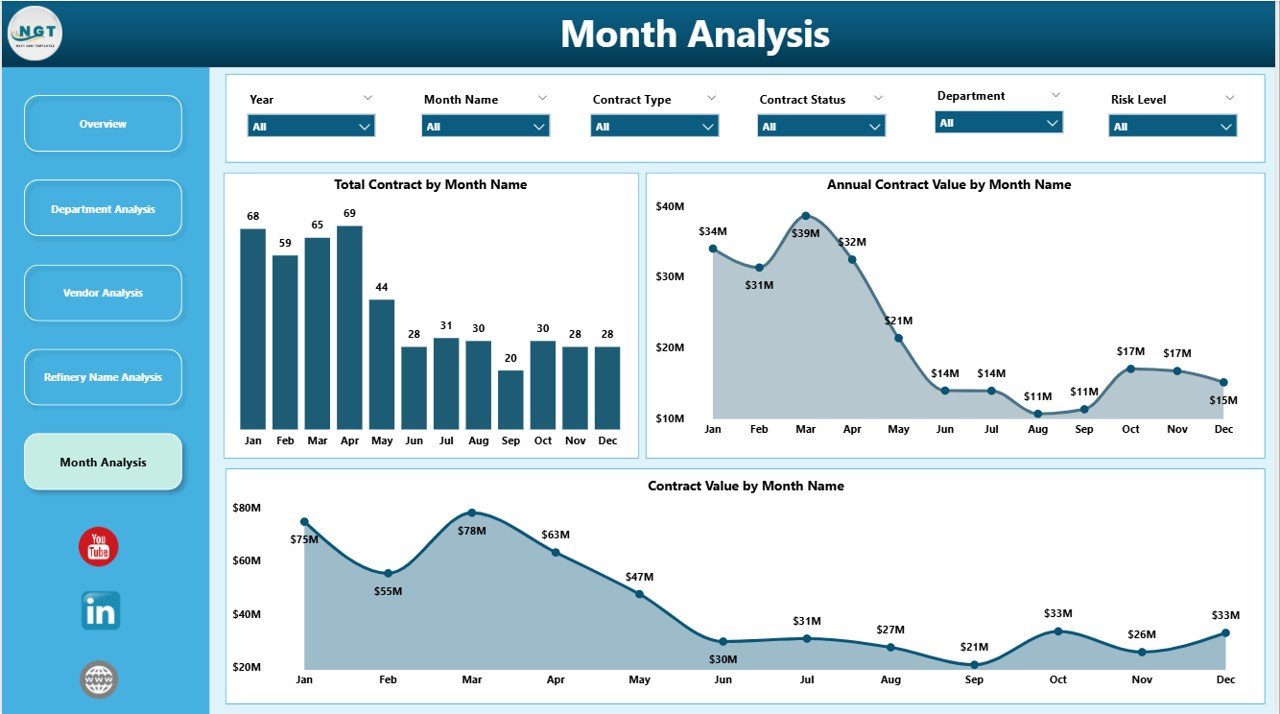
The Monthly Trends Page focuses on contract movement over time.
Key Monthly Trend Charts
-
Total Contracts by Month
-
Annual Contract Value by Month
-
Contract Value by Month
Because of monthly tracking, organizations can detect seasonality, renewal spikes, and contract growth trends early.
Advantages of a Refinery Contract Management Dashboard in Power BI
A Power BI-based contract dashboard offers multiple business advantages.
1. Centralized Contract Visibility
-
All contracts appear in one dashboard
-
No dependency on scattered files
2. Better Renewal Management
-
Early identification of pending renewals
-
Reduced risk of contract lapses
3. Improved Cost Control
-
Clear view of high-value contracts
-
Better budget planning
4. Enhanced Vendor Governance
-
Transparent vendor performance analysis
-
Stronger negotiation power
5. Faster Decision-Making
-
Real-time insights
-
Interactive filters and slicers
Because of these advantages, refineries gain operational control and financial confidence.
How Does Power BI Improve Contract Management Efficiency?
Click to Purchases Refinery Contract Management Dashboard in Power BI
Power BI transforms raw contract data into structured insights.
Key Power BI Capabilities Used
-
Interactive slicers
-
Drill-down charts
-
Dynamic measures
-
Automated refresh
-
Visual KPIs
Therefore, users spend less time preparing reports and more time analyzing data.
Who Can Benefit from This Dashboard?
This dashboard supports multiple stakeholders:
-
Contract Managers
-
Procurement Teams
-
Finance Departments
-
Compliance Officers
-
Senior Management
-
Refinery Operations Heads
Because each role sees relevant insights, collaboration improves significantly.
Best Practices for the Refinery Contract Management Dashboard in Power BI
To maximize dashboard value, organizations should follow these best practices.
1. Standardize Contract Data
-
Use consistent contract categories
-
Maintain uniform vendor naming
2. Update Data Regularly
-
Schedule periodic refresh
-
Avoid outdated insights
3. Define Clear KPIs
-
Track renewal %, termination %, and contract value
-
Align KPIs with business goals
4. Use Role-Based Access
-
Limit sensitive data exposure
-
Improve data security
5. Review Trends Monthly
-
Identify anomalies early
-
Take proactive actions
Following these practices ensures long-term dashboard success.
How Does This Dashboard Support Compliance and Audits?
Compliance teams need accuracy and traceability.
This dashboard helps by:
-
Maintaining centralized contract records
-
Tracking contract status clearly
-
Supporting audit-ready reporting
-
Reducing manual errors
As a result, audits become faster and stress-free.
Can This Dashboard Be Customized?
Yes, Power BI dashboards offer high flexibility.
You can:
-
Add new KPIs
-
Include SLA compliance metrics
-
Integrate with ERP systems
-
Customize visuals
-
Apply refinery-specific filters
Therefore, the dashboard evolves with business needs.
Common Challenges Solved by This Dashboard
Organizations often face challenges like:
-
Missed renewals
-
Poor vendor visibility
-
Unclear contract ownership
-
Budget overruns
However, this dashboard addresses these issues through structured insights and automation.
How to Get Started with a Refinery Contract Management Dashboard?
To implement this dashboard effectively:
-
Gather clean contract data
-
Define KPIs clearly
-
Build a structured Power BI model
-
Design user-friendly visuals
-
Train users on navigation
Because of this approach, adoption becomes smooth and successful.
Conclusion
A Refinery Contract Management Dashboard in Power BI is no longer a luxury. Instead, it is a strategic necessity.
This dashboard centralizes contract data, improves renewal management, strengthens vendor governance, and supports informed decisions. Moreover, it replaces manual tracking with automation and clarity.
When refineries adopt such a dashboard, they reduce risk, control costs, and gain confidence in contract management. Therefore, investing in a Power BI contract dashboard directly supports operational excellence and financial stability.
Frequently Asked Questions (FAQs)
1. What is the main purpose of a Refinery Contract Management Dashboard in Power BI?
The main purpose is to track, analyze, and manage refinery contracts efficiently using interactive visuals and KPIs.
2. Can this dashboard track contract renewals?
Yes, the dashboard clearly highlights pending renewals by contract type, department, and month.
3. Does the dashboard support vendor analysis?
Yes, it provides detailed vendor-wise insights such as contract value and average contract duration.
4. Can non-technical users use this dashboard?
Yes, Power BI offers an intuitive interface, making it easy for non-technical users to navigate.
5. How often should the dashboard be updated?
Ideally, organizations should update it monthly or weekly, depending on contract activity.
6. Can this dashboard integrate with Excel or ERP systems?
Yes, Power BI easily integrates with Excel, databases, and ERP systems.
7. Is this dashboard suitable for multi-refinery organizations?
Absolutely. The refinery-wise analysis page supports multi-location contract management effectively.
Visit our YouTube channel to learn step-by-step video tutorials