Managing procurement in a refinery is never simple. Refineries handle high-value materials, long-term vendor contracts, strict compliance rules, and continuous cost pressure. Therefore, procurement teams must track performance clearly and consistently. However, when procurement data remains scattered across multiple Excel files or manual reports, teams lose visibility and control. As a result, decision-making slows down, risks increase, and costs rise.
Click to buy Refinery Procurement KPI Dashboard in Excel
This is exactly why a Refinery Procurement KPI Dashboard in Excel becomes an essential performance management tool. This dashboard brings all procurement KPIs into one structured, visual, and easy-to-use Excel solution. Moreover, it allows refinery teams to monitor Month-to-Date (MTD) and Year-to-Date (YTD) performance, compare targets versus actuals, and analyze trends without complex software.
In this detailed and SEO-friendly guide, you will learn everything about the Refinery Procurement KPI Dashboard in Excel. We will explain what it is, why it matters, how it works, its worksheet structure, key KPIs, advantages, best practices, and frequently asked questions. By the end of this article, you will clearly understand how this dashboard strengthens procurement control in refinery operations.
What Is a Refinery Procurement KPI Dashboard in Excel?
A Refinery Procurement KPI Dashboard in Excel is a centralized performance monitoring tool designed to track and analyze procurement-related key performance indicators within refinery operations.
Instead of managing procurement performance through disconnected spreadsheets, this dashboard consolidates all KPI data into one structured Excel file. Consequently, procurement managers can review performance instantly and take faster corrective actions.
Moreover, this dashboard uses built-in Excel features such as:
- Drop-down selections
- Conditional formatting
- Automated calculations
- Dynamic charts
Because of this design, refinery teams can analyze procurement performance without advanced technical skills.
Why Do Refineries Need a Procurement KPI Dashboard in Excel?
Refineries operate in a high-risk and high-cost environment. Therefore, even small procurement inefficiencies can lead to large financial losses. However, manual tracking methods make it difficult to detect issues early.
A Refinery Procurement KPI Dashboard in Excel solves this problem by providing structured visibility. As a result, teams gain control, accuracy, and speed.
Key Reasons Refineries Need This Dashboard
- Procurement costs involve large capital values
- Vendor performance directly affects plant uptime
- Compliance and audit requirements remain strict
- Management demands accurate and timely reporting
- Excel remains widely used across refinery teams
Because Excel is already familiar, teams can adopt this dashboard quickly and effectively.
How Does a Refinery Procurement KPI Dashboard in Excel Work?
The dashboard works by separating data input, calculations, and visual reporting into dedicated worksheets. Therefore, users only need to enter numbers in input sheets, while the dashboard handles calculations automatically.
Moreover, users can select a reporting month from a drop-down. As soon as they select a month, all KPIs update instantly across the dashboard.
This design ensures accuracy, consistency, and ease of use.
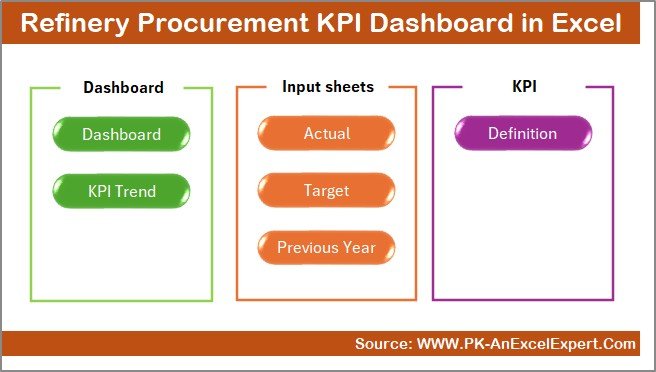
What Are the Worksheets in a Refinery Procurement KPI Dashboard in Excel?
This dashboard contains 7 well-structured worksheets, each designed for a specific purpose. Let us explore each worksheet in detail.
Summary Page – How Does the Navigation Work?
The Summary Page acts as the index sheet of the dashboard. It helps users navigate the file easily.
Key Features of the Summary Page
- Clean and simple layout
- 6 navigation buttons
- One-click access to each worksheet
Because of this design, users do not waste time searching through sheet tabs. Instead, they move directly to the required section.
Click to buy Refinery Procurement KPI Dashboard in Excel
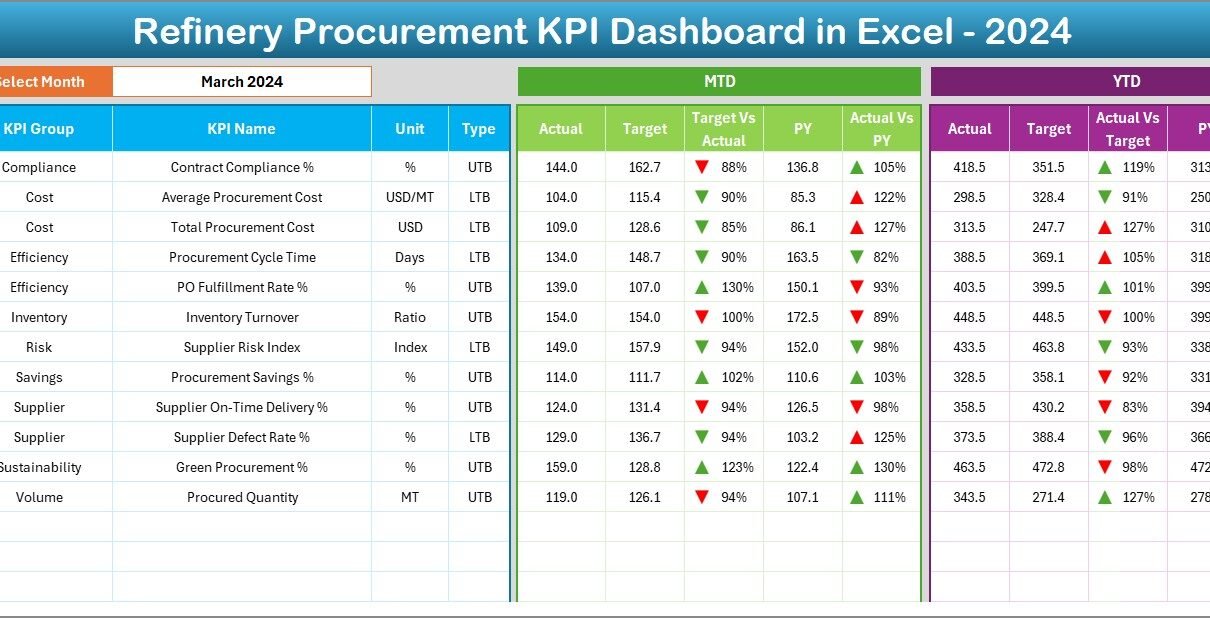
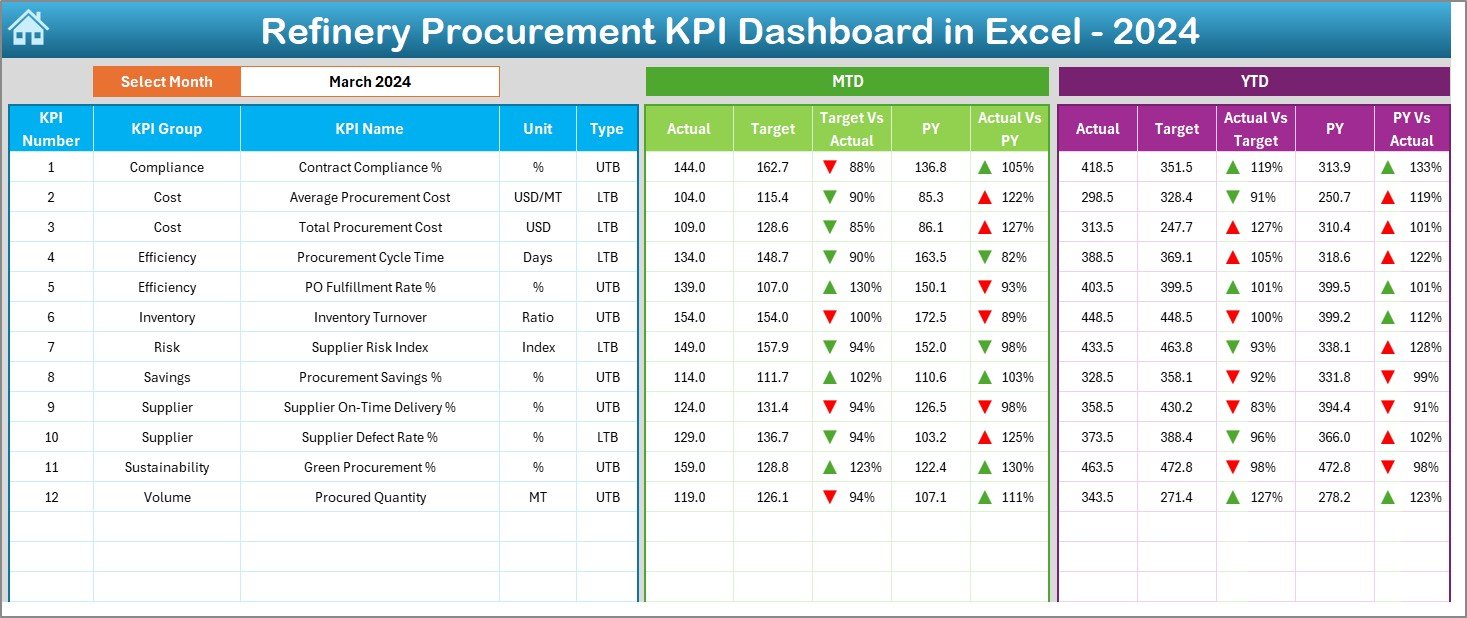
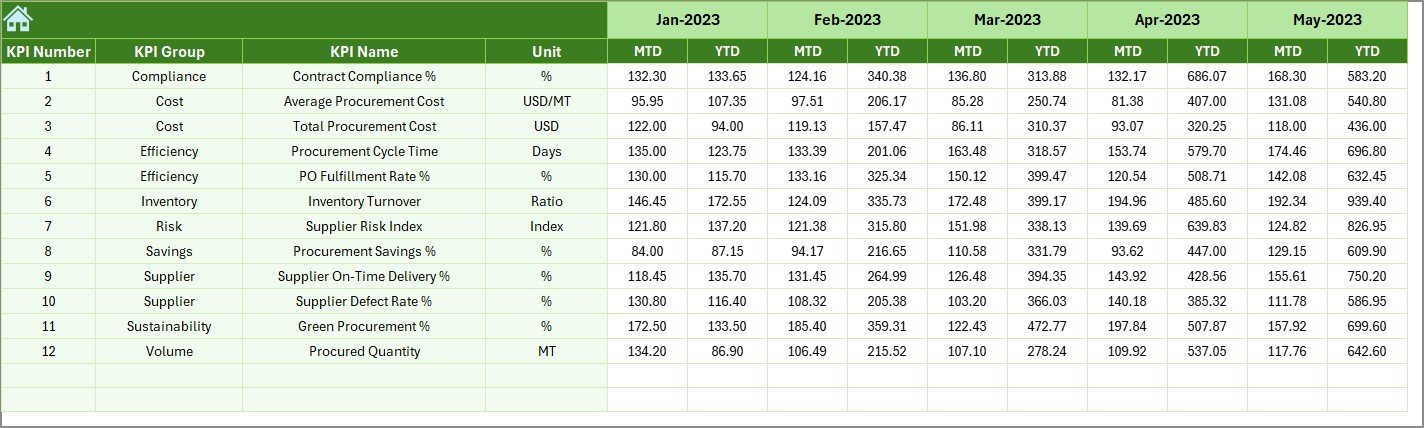
Dashboard Sheet – What Does the Main Dashboard Show?
The Dashboard Sheet is the core of the Refinery Procurement KPI Dashboard in Excel. This sheet displays all procurement KPIs in a visual and actionable format.
Key Features of the Dashboard Sheet
- Month selection drop-down on cell D3
- Automatic update of all KPIs based on selected month
- Clear MTD and YTD performance sections
KPIs Displayed on the Dashboard
For each KPI, the dashboard shows:
- MTD Actual
- MTD Target
- MTD Previous Year
- Target vs Actual variance
- Previous Year vs Actual variance
Additionally, the same metrics appear for YTD performance.
Conditional Formatting Indicators
To improve clarity, the dashboard uses:
- Green upward arrows for positive performance
- Red downward arrows for negative performance
As a result, users can identify issues at a glance.
Click to buy Refinery Procurement KPI Dashboard in Excel
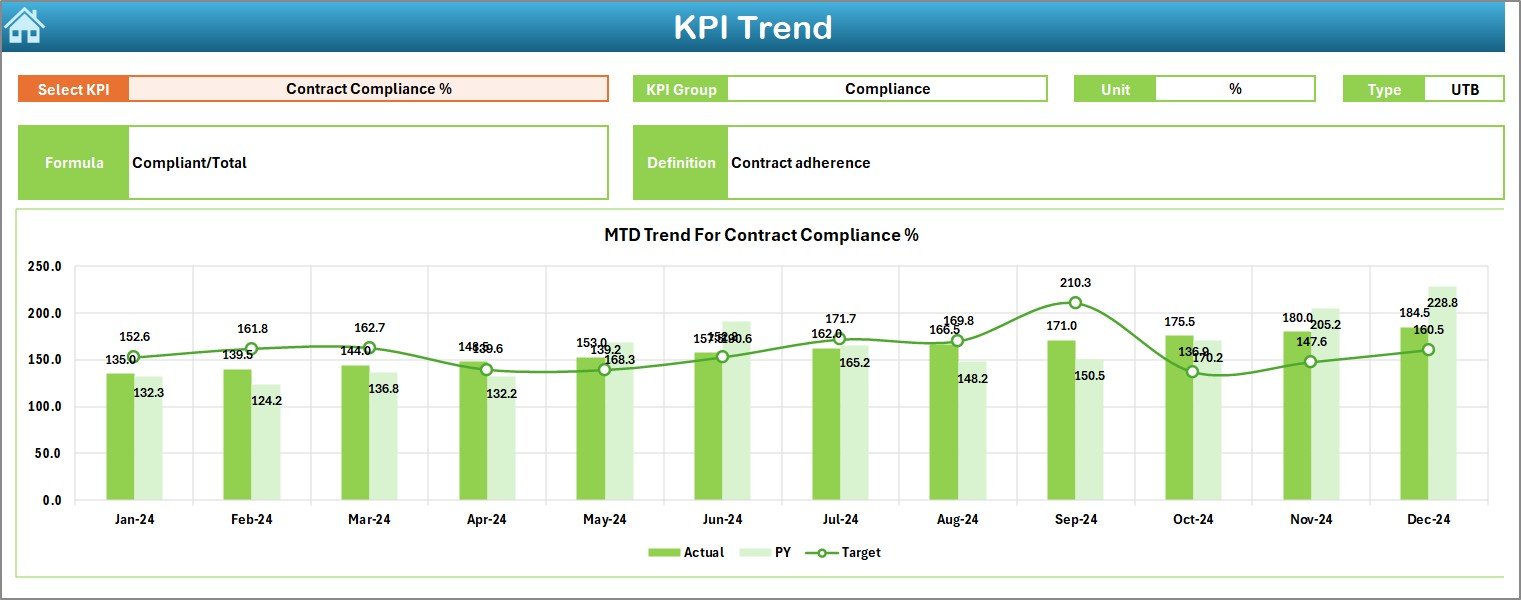
Trend Sheet – How Can You Analyze KPI Trends?
The Trend Sheet allows users to analyze performance trends over time for individual KPIs.
Key Features of the Trend Sheet
- KPI selection drop-down on cell C3
Automatic display of KPI details:
KPI Group
Unit of measurement
KPI Type (Lower the Better or Upper the Better)
KPI Formula
KPI Definition
Trend Charts Included
- MTD trend chart for Actual, Target, and Previous Year
- YTD trend chart for Actual, Target, and Previous Year
Because of these charts, procurement teams can easily identify patterns, seasonality, and long-term performance gaps.
Click to buy Refinery Procurement KPI Dashboard in Excel
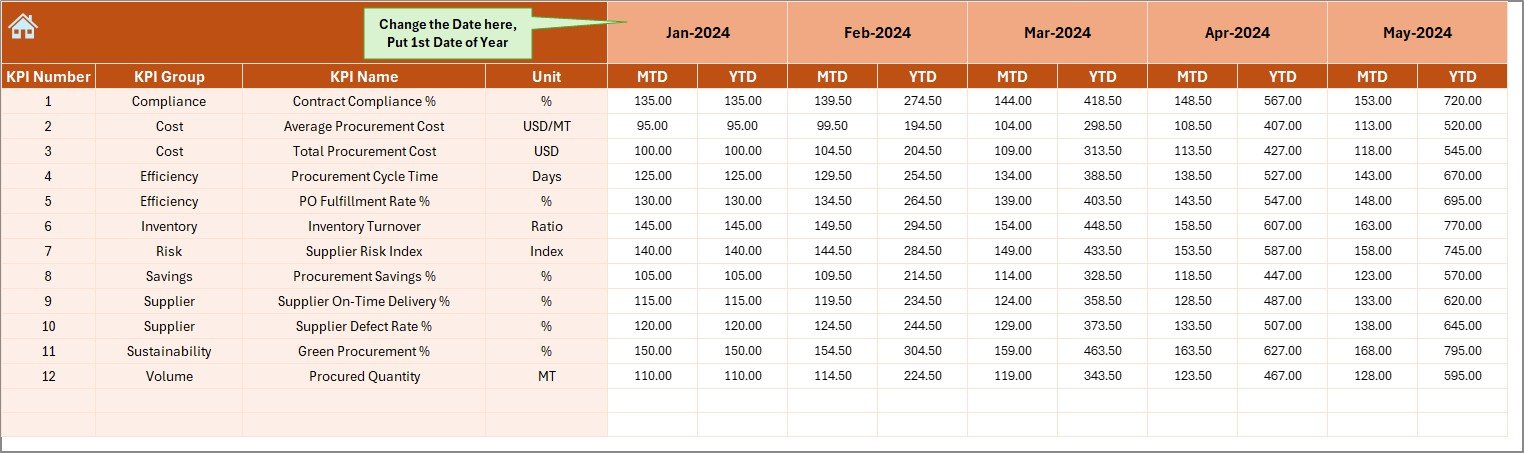
Actual Numbers Input Sheet – Where Do You Enter Actual Data?
The Actual Numbers Input Sheet is where users enter real procurement performance data.
How This Sheet Works
- Enter the first month of the year in cell E1
- Select months dynamically
- Input MTD and YTD actual numbers for each KPI
Because data entry stays separate from the dashboard, errors reduce significantly.
Target Sheet – How Are Targets Managed?
The Target Sheet allows users to define procurement targets for each KPI.
Key Target Inputs
- Monthly (MTD) targets
- Year-to-date (YTD) targets
Because targets remain structured, performance comparisons remain accurate and consistent.
Click to buy Refinery Procurement KPI Dashboard in Excel
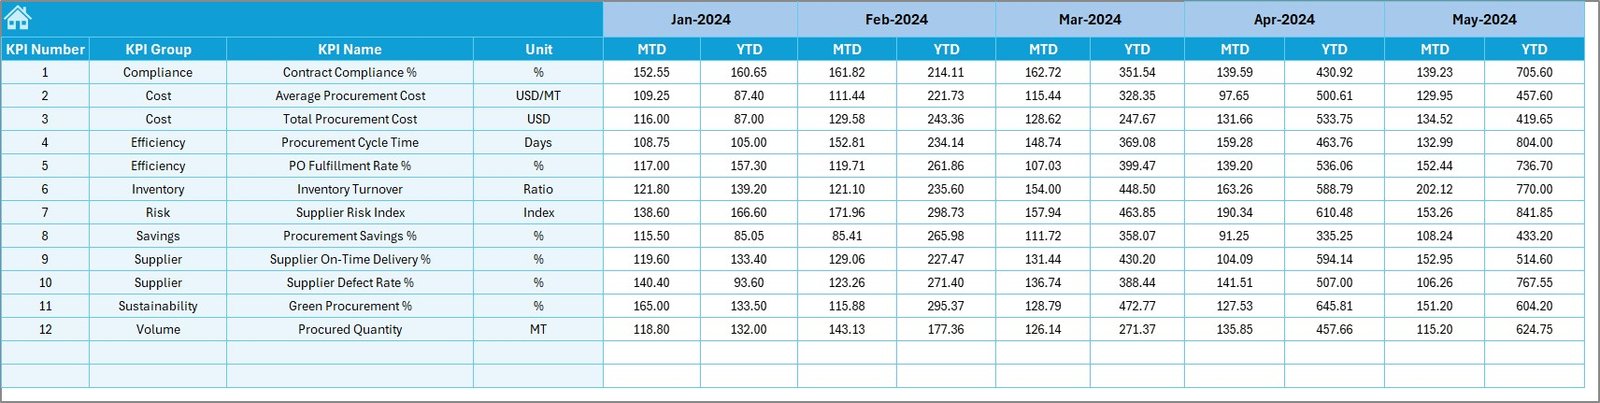
Previous Year Numbers Sheet – Why Is Historical Comparison Important?
The Previous Year Numbers Sheet stores last year’s performance data.
Benefits of Previous Year Comparison
- Measures year-over-year improvement
- Identifies recurring issues
- Supports realistic target setting
Therefore, refinery teams gain valuable historical context.
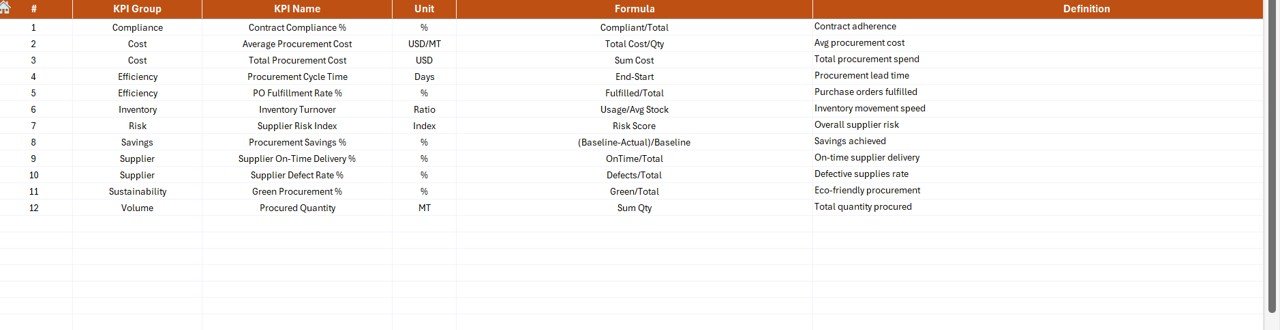
KPI Definition Sheet – How Are KPIs Documented?
The KPI Definition Sheet acts as the knowledge base of the dashboard.
Information Stored in This Sheet
- KPI Name
- KPI Group
- Unit of measurement
- KPI Formula
- KPI Definition
Because definitions remain standardized, all stakeholders interpret KPIs correctly.
]Click to buy Refinery Procurement KPI Dashboard in Excel
What Are Common Procurement KPIs in a Refinery Dashboard?
A Refinery Procurement KPI Dashboard in Excel typically includes KPIs such as:
- Purchase Order Cycle Time
- Cost Savings Achieved
- Supplier On-Time Delivery Rate
- Contract Compliance Rate
- Emergency Purchase Ratio
- Procurement Cost Variance
- Vendor Quality Rejection Rate
These KPIs help refineries maintain cost control, efficiency, and compliance.
Advantages of a Refinery Procurement KPI Dashboard in Excel
Using this dashboard delivers significant operational and strategic benefits.
Key Advantages
- Centralized procurement performance tracking
- Faster decision-making through real-time insights
- Clear MTD and YTD visibility
- Easy comparison with targets and previous year
- Improved vendor performance monitoring
- Reduced manual reporting effort
- High flexibility and customization
Because Excel remains widely accessible, implementation stays quick and cost-effective.
How Does This Dashboard Improve Procurement Decision-Making?
This dashboard transforms raw procurement data into actionable insights. Therefore, procurement leaders can:
- Identify underperforming vendors early
- Control cost overruns proactively
- Improve negotiation strategies
- Support compliance audits with accurate data
- Present performance clearly to management
As a result, procurement decisions become faster and more confident.
Best Practices for Using a Refinery Procurement KPI Dashboard in Excel
To get maximum value from this dashboard, follow these best practices.
- Standardize KPI Definitions
Always define KPIs clearly in the KPI Definition Sheet. This practice avoids confusion and misinterpretation.
- Update Data Regularly
Enter actual numbers on a monthly basis. Consistent updates keep insights accurate.
- Validate Data Before Entry
Always verify procurement data before entering it into the dashboard. This step ensures reliable reporting.
- Review Trends, Not Just Numbers
Use the Trend Sheet regularly. Trends often reveal issues that single-month data cannot show.
- Align Targets with Business Goals
Set realistic and aligned targets. Well-defined targets drive meaningful performance improvement.
- Use Conditional Formatting Wisely
Pay attention to arrows and indicators. They highlight issues that require immediate action.
Who Can Benefit from a Refinery Procurement KPI Dashboard in Excel?
This dashboard benefits multiple roles within refinery operations, including:
- Procurement Managers
- Supply Chain Teams
- Finance Departments
- Operations Managers
- Senior Leadership
- Internal Audit Teams
Because the dashboard uses Excel, all these stakeholders can access and understand the data easily.
How Is This Dashboard Different from Traditional Procurement Reports?
Traditional reports often remain static and time-consuming. In contrast, this dashboard offers:
- Dynamic month selection
- Automated calculations
- Visual indicators
- Trend-based insights
- Centralized data management
Therefore, it delivers faster and deeper insights.
Conclusion: Why Is a Refinery Procurement KPI Dashboard in Excel Essential?
A Refinery Procurement KPI Dashboard in Excel is more than just a reporting tool. It is a strategic solution that strengthens procurement governance, improves cost control, and enhances operational efficiency.
By combining structured data input, automated calculations, and clear visuals, this dashboard empowers refinery teams to track performance confidently. Moreover, because it uses Excel, it remains accessible, flexible, and cost-effective.
If your refinery wants better visibility, stronger control, and smarter procurement decisions, this dashboard becomes an essential asset.
Frequently Asked Questions (FAQs)
- What is the main purpose of a Refinery Procurement KPI Dashboard in Excel?
The main purpose is to track, analyze, and visualize procurement KPIs in one centralized Excel dashboard for better decision-making.
- Can this dashboard handle both MTD and YTD performance?
Yes, the dashboard shows both Month-to-Date and Year-to-Date performance automatically.
- Is advanced Excel knowledge required to use this dashboard?
No, basic Excel knowledge is enough. The dashboard uses simple inputs and automated calculations.
- Can I customize KPIs in this dashboard?
Yes, you can easily add, remove, or modify KPIs using the KPI Definition Sheet.
- How often should data be updated?
You should update actual numbers monthly to keep insights accurate and relevant.
- Does this dashboard support previous year comparison?
Yes, it includes a dedicated sheet for previous year numbers to enable year-over-year analysis.
- Is this dashboard suitable for large refineries?
Yes, the dashboard works well for both small and large refinery procurement operations.
Visit our YouTube channel to learn step-by-step video tutorials
Watch the step-by-step video tutorial:
Click to buy Refinery Procurement KPI Dashboard in Excel