Managing refinery projects always demands precision, visibility, and timely decision-making. Because refinery projects involve large budgets, strict timelines, safety standards, and multiple stakeholders, even a small deviation can lead to major cost overruns and delays. Therefore, refinery project teams need a structured and reliable way to track performance at every stage.
That is exactly why a Refinery Project KPI Dashboard in Excel becomes a powerful and practical solution.
In this detailed and SEO-friendly article, you will learn what a Refinery Project KPI Dashboard in Excel is, why refinery projects need it, how it works, its worksheet structure, key features, advantages, best practices, and frequently asked questions. By the end of this article, you will clearly understand how this Excel dashboard helps refinery project managers gain control, transparency, and confidence in project execution.
Click to buy Refinery Project KPI Dashboard in Excel
What Is a Refinery Project KPI Dashboard in Excel?
A Refinery Project KPI Dashboard in Excel is a structured and interactive Excel-based reporting tool designed to track, analyze, and monitor key performance indicators (KPIs) related to refinery projects.
Instead of relying on scattered spreadsheets and manual reports, this dashboard consolidates all project KPIs into one centralized Excel file. As a result, refinery project managers, engineering teams, finance teams, and senior management can monitor performance quickly and accurately.
Because this dashboard runs entirely in Microsoft Excel, it remains:
- Easy to use
- Highly flexible
- Cost-effective
- Accessible to non-technical users
Moreover, Excel-based dashboards do not require expensive project management or BI tools. Therefore, they suit both large refinery organizations and mid-sized project teams.
Why Do Refinery Projects Need a KPI Dashboard?
Refinery projects involve complex activities such as plant expansions, maintenance shutdowns, pipeline installations, equipment upgrades, and safety improvements. Because these projects run for months or even years, teams must continuously track progress and performance.
However, when teams use multiple spreadsheets and static reports, several problems arise:
- Data becomes inconsistent
- Manual errors increase
- Decision-making slows down
- Performance issues remain hidden
A Refinery Project KPI Dashboard in Excel solves these problems by providing a single source of truth.
Key Reasons to Use a Refinery Project KPI Dashboard
- To monitor project performance in real time
- To compare actual results with targets
- To identify delays and cost overruns early
- To track trends across months and years
- To improve accountability and transparency
Because refinery projects operate under tight regulations and budgets, this dashboard becomes essential rather than optional.
How Does a Refinery Project KPI Dashboard in Excel Work?
The dashboard works by separating data input, KPI definitions, and visual reporting into different worksheets. As a result, users can update data easily while keeping calculations and visuals intact.
Here is how the process usually works:
- Enter actual project data in the input sheets
- Enter target and previous year data
- Define KPIs clearly in the KPI Definition sheet
- Select the required month or KPI from drop-downs
- View instant KPI results, trends, and comparisons
Because Excel formulas and charts update automatically, the dashboard refreshes instantly when data changes.
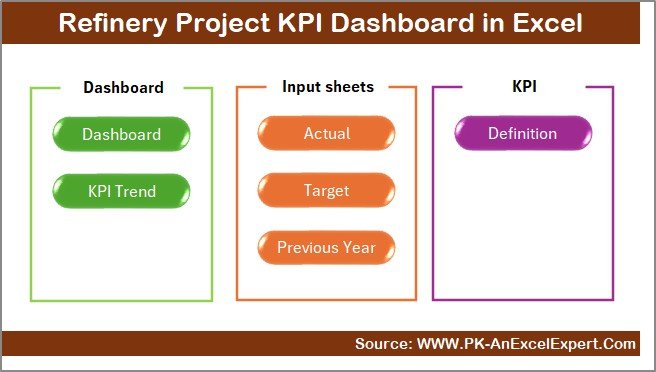
What Are the Key Worksheets in the Refinery Project KPI Dashboard in Excel?
This Refinery Project KPI Dashboard in Excel includes 7 structured worksheets, each designed for a specific purpose. Let us explore them one by one.
Summary Page – How Does the Summary Page Help?
The Summary Page works as the index of the dashboard.
Key Purpose of the Summary Page
- Acts as the navigation hub
- Improves user experience
- Saves time while switching sheets
Key Features of the Summary Page
- Clean and simple layout
- 6 navigation buttons
- One-click jump to any worksheet
Because refinery project dashboards often contain multiple sheets, this page ensures smooth navigation for all users.
Click to buy Refinery Project KPI Dashboard in Excel
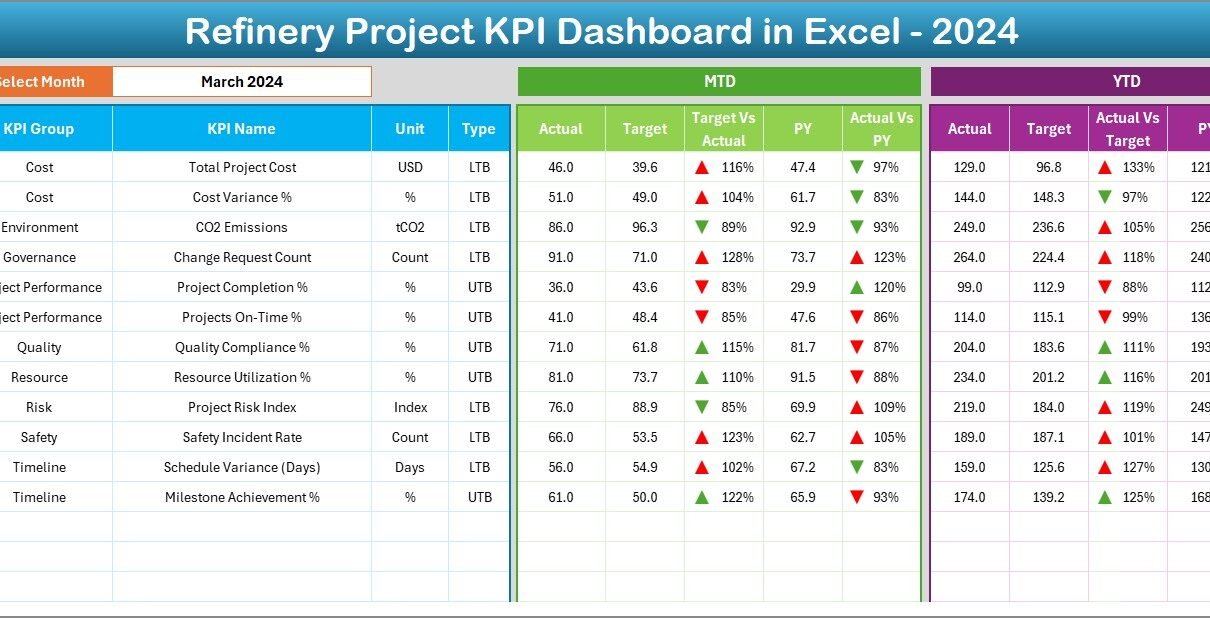
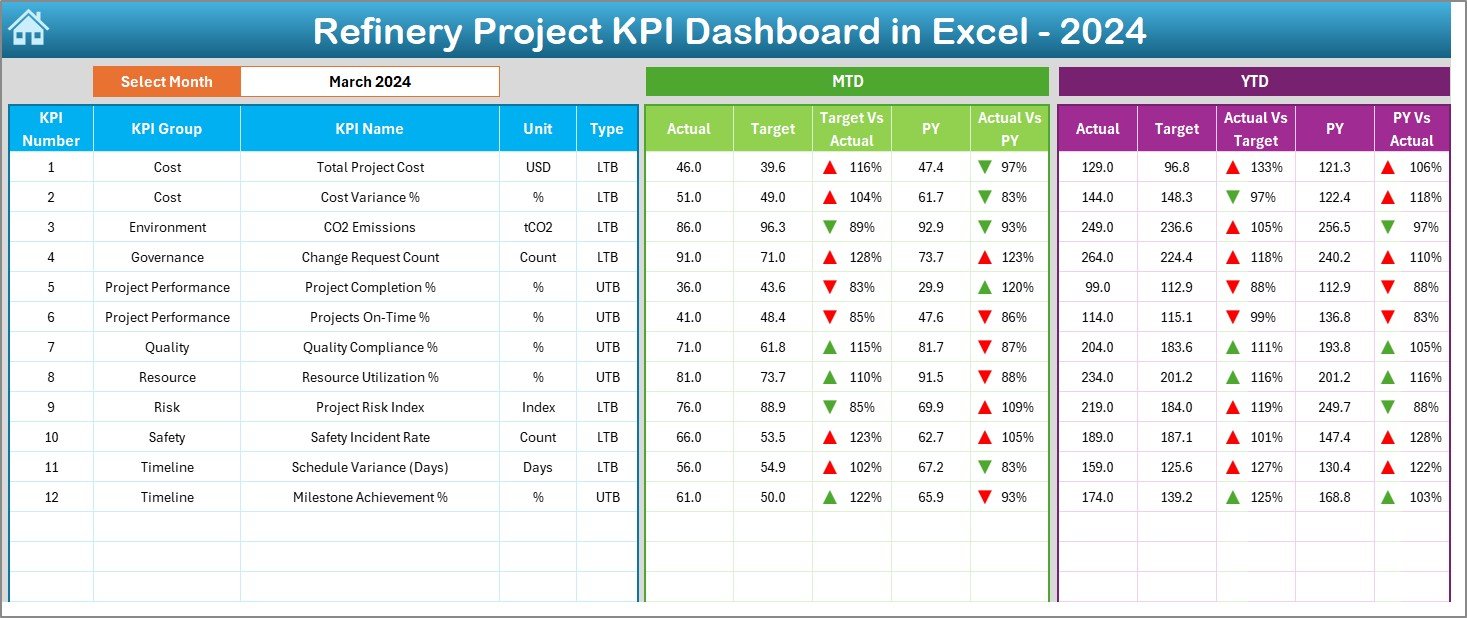
Dashboard Sheet – What Does the Main Dashboard Show?
The Dashboard Sheet serves as the heart of the entire KPI dashboard. It displays all critical project KPIs in a visual and easy-to-understand format.
Key Highlights of the Dashboard Sheet
- Centralized view of all KPIs
- Interactive month selection
- Automated KPI calculations
- Visual performance indicators
Month Selection Feature
- Located at cell D3
- Allows users to select the required month
- Updates the entire dashboard automatically
Because of this feature, users can analyze any specific month without changing formulas or charts.
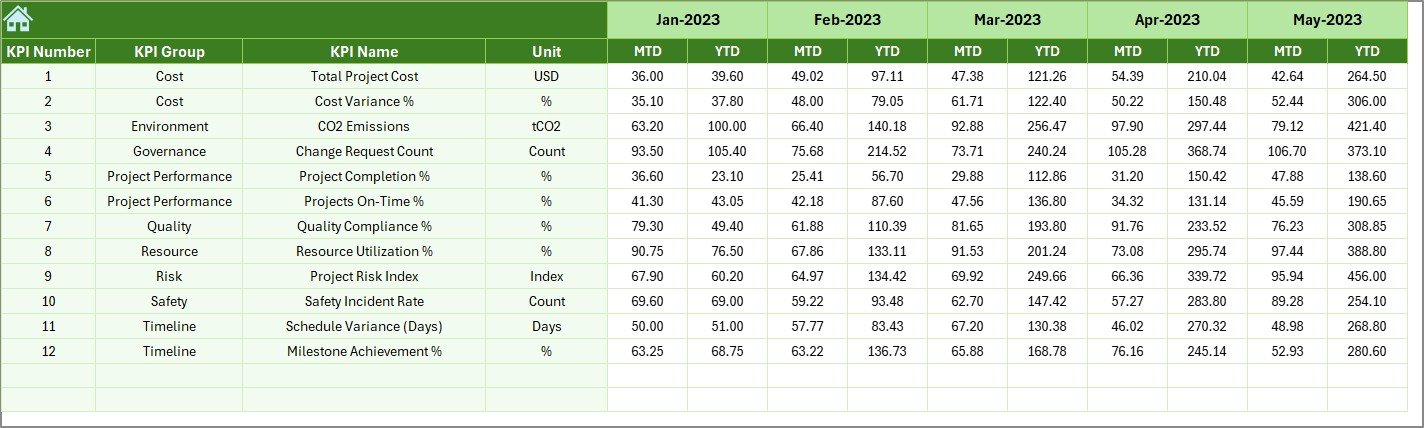
KPIs Displayed on the Dashboard
The dashboard displays the following for both MTD (Month-to-Date) and YTD (Year-to-Date):
- Actual values
- Target values
- Previous Year (PY) values
Performance Comparisons Included
- Target vs Actual comparison
- Previous Year vs Actual comparison
Visual Indicators Used
- Conditional formatting
- Up and down arrows
- Color-coded performance signals
As a result, users can instantly identify whether performance improves or declines.
Click to buy Refinery Project KPI Dashboard in Excel
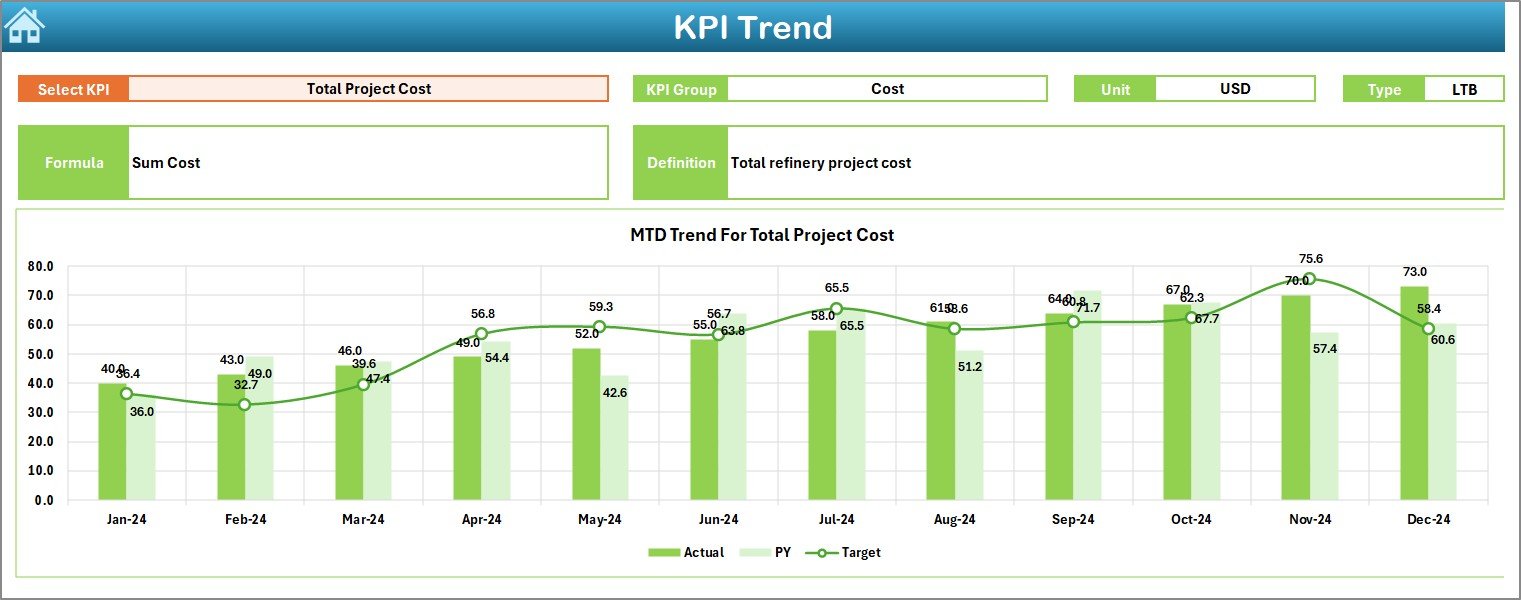
Trend Sheet – How Can You Analyze KPI Trends?
The Trend Sheet focuses on deep KPI analysis over time.
KPI Selection Feature
- KPI selection drop-down at cell C3
- Allows analysis of one KPI at a time
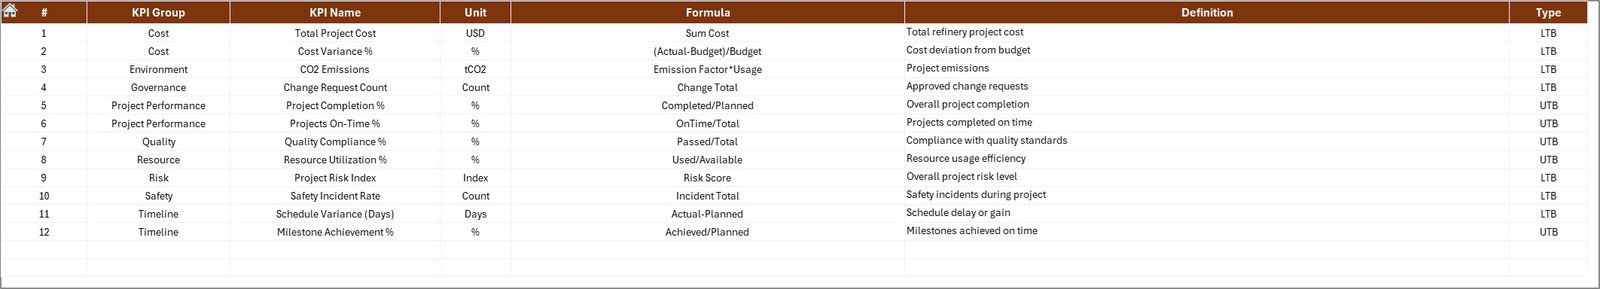
KPI Information Displayed
For the selected KPI, the dashboard shows:
- KPI Group
Unit of KPI
Type of KPI
Upper the Better
Lower the Better
KPI Formula
- KPI Definition
Because this information appears alongside charts, users clearly understand what each KPI represents.
Trend Charts Included
- MTD trend chart
- YTD trend chart
- Comparison of:
Actual
Target
Previous Year
As a result, project managers can easily identify patterns, growth, or performance drops.
Click to buy Refinery Project KPI Dashboard in Excel
Actual Numbers Input Sheet – Where Do You Enter Actual Data?
The Actual Numbers Input Sheet handles all actual project performance data.
Key Features of the Actual Numbers Input Sheet
- Structured data entry format
- Separate fields for MTD and YTD values
- Month control using cell E1
How Month Selection Works
- Enter the first month of the year in cell E1
- Update actual numbers for each KPI
- Excel automatically aligns data by month
Because of this setup, data entry remains simple and organized throughout the year.
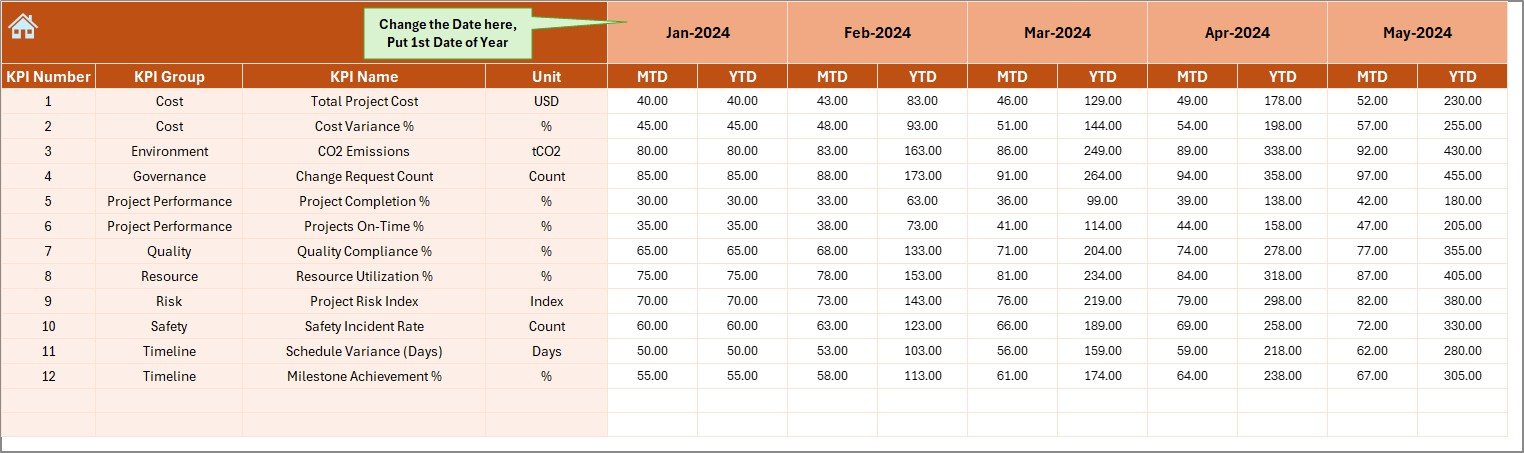
Target Sheet – How Do You Define Project Targets?
The Target Sheet stores all planned or target KPI values.
Key Functions of the Target Sheet
- Enter monthly targets for each KPI
- Maintain both MTD and YTD targets
- Enable accurate performance comparison
Because targets remain clearly defined, teams can easily evaluate whether projects stay on track.
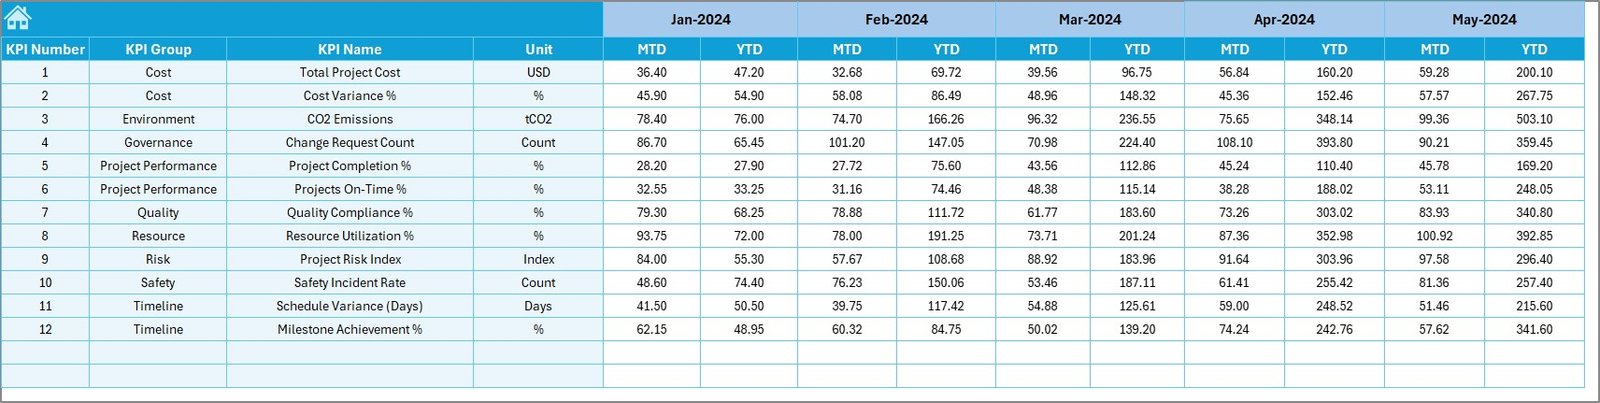
Previous Year Number Sheet – Why Compare with Previous Year?
The Previous Year Number Sheet allows year-over-year analysis.
Key Benefits of This Sheet
- Stores last year’s KPI data
- Uses the same structure as current year data
- Enables fair and accurate comparison
Because refinery projects often span multiple years, this comparison helps measure long-term improvement.
KPI Definition Sheet – Why Is KPI Definition Important?
The KPI Definition Sheet ensures clarity and consistency across the dashboard.
Information Stored in This Sheet
- KPI Name
- KPI Group
- KPI Unit
- KPI Formula
- KPI Definition
Because every KPI is clearly defined, all users interpret results correctly.
What Are the Key Features of a Refinery Project KPI Dashboard in Excel?
This dashboard offers several powerful features that support refinery project management.
Key Features at a Glance
- Centralized KPI tracking
- Interactive drop-down controls
- Automated calculations
- MTD and YTD analysis
- Target and PY comparisons
- Trend analysis charts
- Conditional formatting indicators
- Easy navigation
Together, these features turn raw project data into meaningful insights.
Advantages of a Refinery Project KPI Dashboard in Excel
Using a Refinery Project KPI Dashboard in Excel offers several clear advantages.
- Better Project Visibility
- View all KPIs on one screen
- Track progress without manual reports
- Faster Decision-Making
- Identify issues instantly
- Act before problems grow
- Cost Control
- Compare planned vs actual performance
- Detect overruns early
- Improved Accountability
- Assign responsibility to KPIs
- Track performance objectively
- Easy Customization
- Modify KPIs as per project needs
- Add new metrics anytime
- Cost-Effective Solution
- No need for expensive software
- Uses existing Excel skills
Best Practices for the Refinery Project KPI Dashboard in Excel
To get the best results, teams should follow proven best practices.
- Define KPIs Clearly
- Use clear formulas
- Avoid ambiguous metrics
- Update Data Regularly
- Enter data monthly
- Avoid delays in updates
- Limit KPIs to What Matters
- Focus on critical project KPIs
- Avoid clutter
- Validate Data Before Entry
- Check accuracy
- Reduce errors
- Use Consistent Units
- Keep KPI units uniform
- Avoid confusion
- Review Trends, Not Just Numbers
- Analyze patterns
- Look beyond single-month results
- Train Users
- Ensure team members understand the dashboard
- Improve adoption
Who Can Use a Refinery Project KPI Dashboard in Excel?
This dashboard benefits multiple roles, including:
- Refinery Project Managers
- Engineering Teams
- Planning and Scheduling Teams
- Finance and Cost Control Teams
- Operations Managers
- Senior Management
Because Excel remains widely used, almost any team can adopt this dashboard quickly.
Conclusion: Why Should You Use a Refinery Project KPI Dashboard in Excel?
A Refinery Project KPI Dashboard in Excel transforms complex project data into clear, actionable insights. Instead of managing dozens of spreadsheets, teams gain one structured and interactive dashboard.
Because it tracks MTD and YTD performance, compares targets and previous year data, and visualizes trends, it empowers teams to control costs, manage timelines, and improve overall project success.
In short, this dashboard becomes an essential tool for any refinery organization that values accuracy, transparency, and performance.
Frequently Asked Questions (FAQs)
What is the main purpose of a Refinery Project KPI Dashboard in Excel?
The main purpose is to track, analyze, and monitor refinery project KPIs in a centralized and visual format.
Can this dashboard handle multiple projects?
Yes, you can structure KPIs to track multiple projects by adding project-level dimensions.
Do I need advanced Excel skills to use this dashboard?
No, basic Excel knowledge is enough to update data and analyze results.
How often should I update the dashboard?
You should update it monthly or as per project reporting cycles.
Can I customize KPIs in the dashboard?
Yes, the KPI Definition sheet allows full customization.
Is this dashboard suitable for large refinery projects?
Yes, it scales well for both small and large refinery projects.
Visit our YouTube channel to learn step-by-step video tutorials
Watch the step-by-step video tutorial:
Click to buy Refinery Project KPI Dashboard in Excel