Restaurants & Food Services KPI Dashboard in Power BI Running a restaurant or food service business successfully requires much more than just great food and service. To thrive in today’s competitive market, restaurant owners and managers must constantly monitor their key performance indicators (KPIs) — covering everything from sales and customer satisfaction to cost control and operational efficiency.
The Restaurants & Food Services KPI Dashboard in Power BI offers a complete digital solution to track, visualize, and analyze performance in real time. This ready-to-use dashboard is designed to provide actionable insights that help management teams make data-driven decisions quickly and effectively.
Click to Purchases Restaurants & Food Services KPI Dashboard in Power BI
Restaurants & Food Services KPI Dashboard in Power BI In this article, we’ll explore the complete structure, key features, benefits, and best practices for using this dashboard — along with some frequently asked questions to help you get started.
📊 What Is a Restaurants & Food Services KPI Dashboard in Power BI?
A Restaurants & Food Services KPI Dashboard in Power BI is a visual analytics solution that consolidates key business metrics into an interactive, easy-to-understand format.
It connects to your Excel data and allows restaurant owners, food service managers, and finance teams to monitor performance across departments, locations, and time periods.
Instead of juggling multiple reports, this dashboard combines financial, operational, and customer-related KPIs into one centralized platform.
With dynamic visuals, real-time updates, and interactive slicers, users can explore insights such as:
-
Monthly performance by KPI category
-
Year-to-date (YTD) and month-to-date (MTD) progress
-
Target vs Actual comparisons
-
Trends over time
-
Drill-through KPI definitions and formulas
This makes it an essential tool for restaurants aiming to increase profitability, improve service quality, and optimize operations.
Click to Purchases Restaurants & Food Services KPI Dashboard in Power BI
🧩 Structure of the Dashboard
The Restaurants & Food Services KPI Dashboard in Power BI consists of three powerful pages that present data in different analytical perspectives.
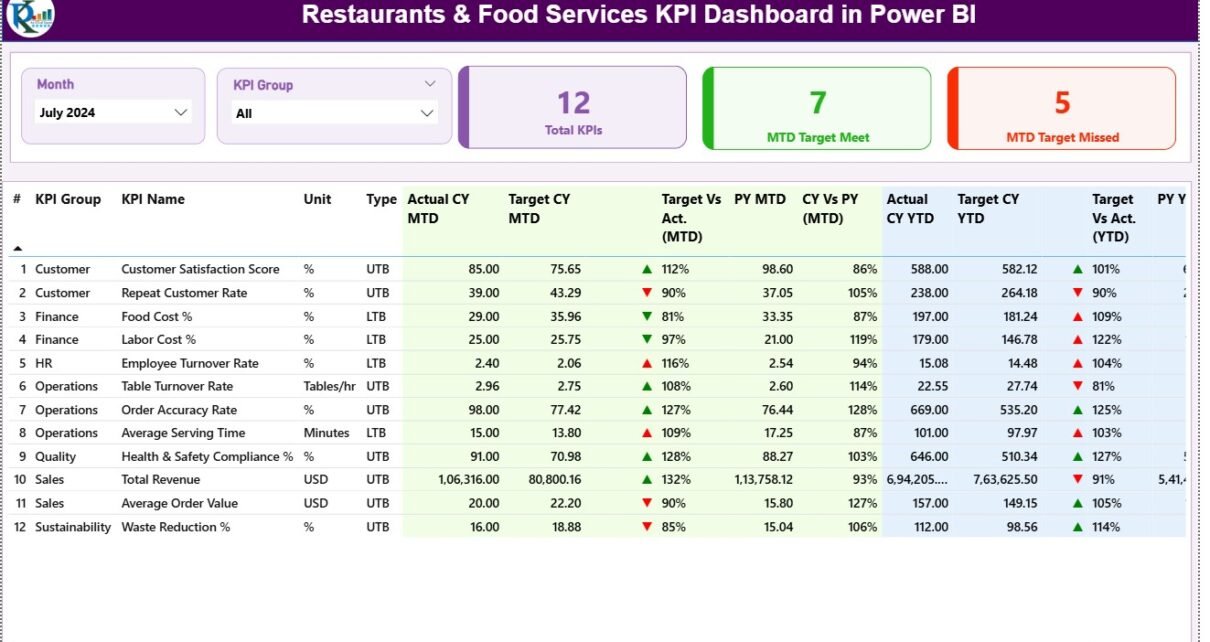
1️⃣ Summary Page – Overview of Performance
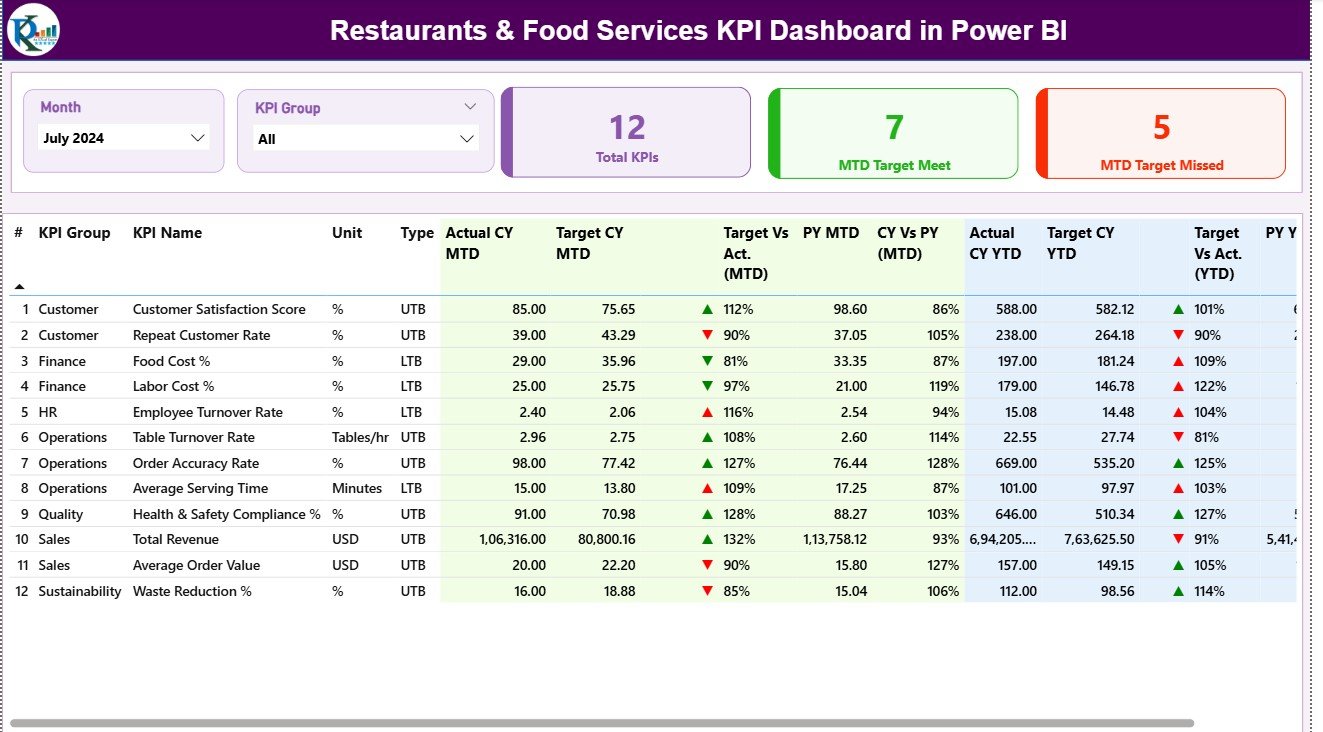
The Summary Page is the main page of the dashboard and acts as the central control hub.
At the top, you’ll find Month and KPI Group slicers, allowing you to filter the view easily.
Key features of this page include:
-
KPI Summary Cards:
-
Total KPIs Count: Displays the total number of KPIs being tracked.
-
MTD Target Met Count: Shows how many KPIs met or exceeded their monthly targets.
-
MTD Target Missed Count: Displays how many KPIs failed to meet the target.
-
2️⃣ KPI Trend Page – Visualizing Data Over Time
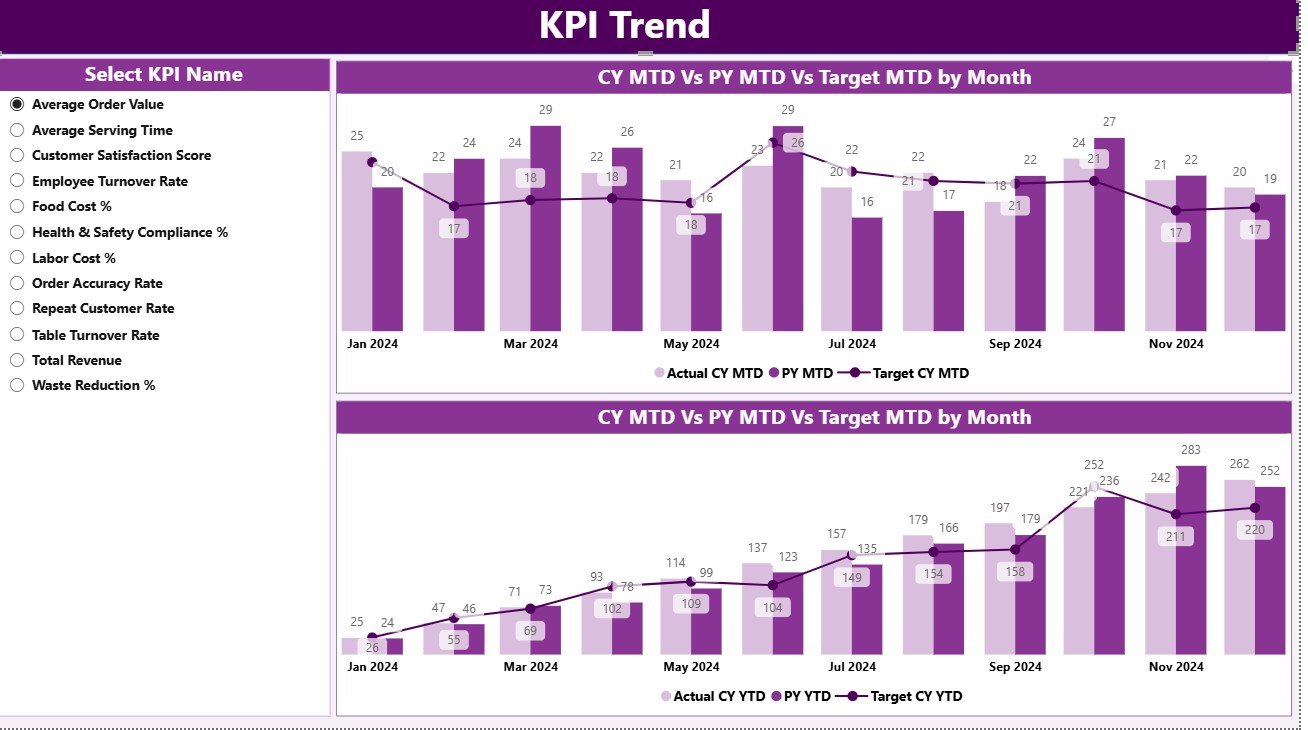
The KPI Trend Page helps analyze how performance evolves month after month.
It includes two combo charts showing Actual, Target, and Previous Year data for both MTD and YTD numbers.
Key highlights:
-
KPI Name Slicer: Located on the left side to choose a specific KPI for analysis.
-
MTD Combo Chart: Displays short-term trends for month-to-date values.
-
YTD Combo Chart: Visualizes cumulative yearly progress.
These trend charts help restaurant managers identify growth patterns, detect performance dips, and forecast future outcomes with ease.
3️⃣ KPI Definition Page – Reference for Clarity
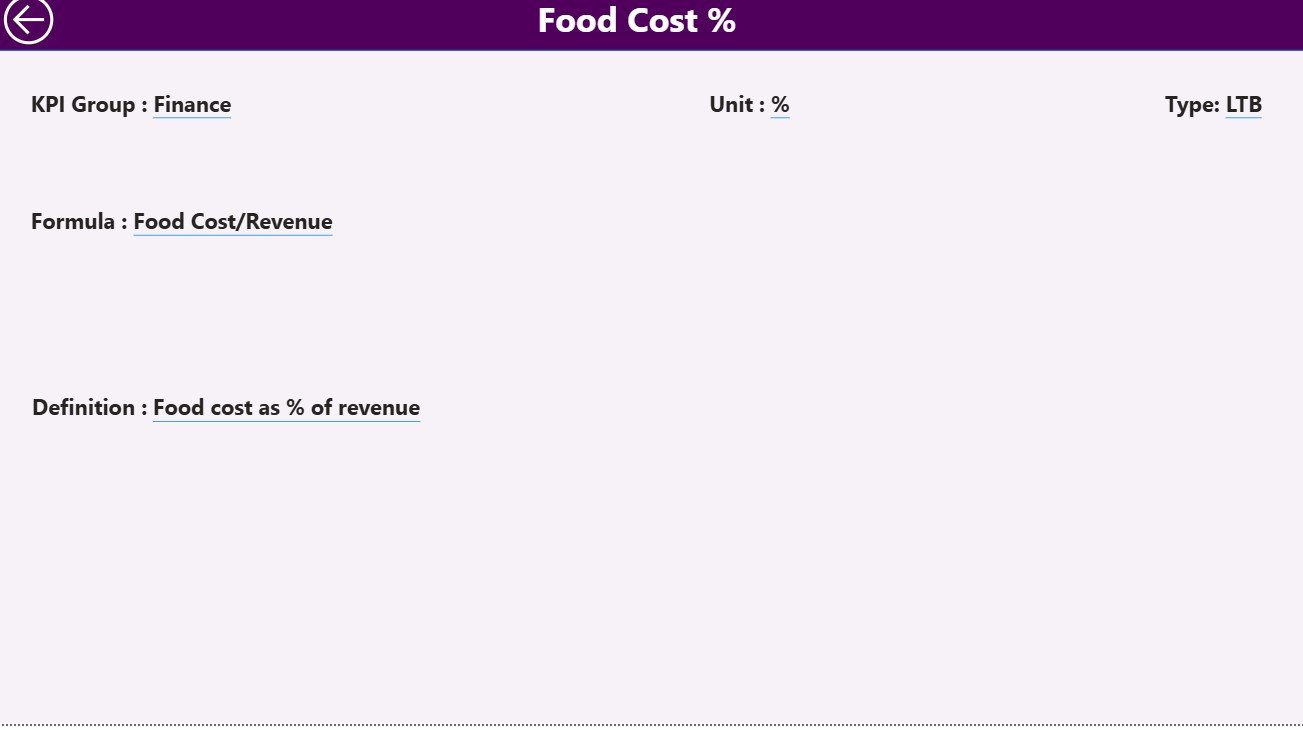
The KPI Definition Page is a hidden drill-through page, accessible from the Summary page by right-clicking on a KPI record.
This page displays detailed information for each KPI:
-
Formula: How the KPI is calculated.
-
Definition: What the KPI represents and its purpose.
-
Unit and Type: Clarifies whether it’s an efficiency, cost, or performance metric.
A convenient Back Button on the top-left corner allows users to return quickly to the main dashboard.
📘 Excel Data Source Structure
The Power BI dashboard uses an Excel file as its data source. The Excel workbook includes three main sheets that act as data feeders for Power BI visuals.
Click to Purchases Restaurants & Food Services KPI Dashboard in Power BI
1. Input_Actual Sheet
Here, users enter:
-
KPI Name
-
Month (use the first date of the month)
-
MTD (Month-to-Date) Actual numbers
-
YTD (Year-to-Date) Actual numbers
2. Input_Target Sheet
This sheet captures target values for each KPI:
-
KPI Name
-
Month
-
MTD Target numbers
-
YTD Target numbers
3. KPI Definition Sheet
This contains detailed metadata for all KPIs:
-
KPI Number
-
KPI Group
-
KPI Name
-
Unit
-
Formula
-
Definition
-
Type (LTB or UTB)
Once these sheets are updated, Power BI automatically refreshes visuals, making the dashboard dynamic and interactive.
💡 Importance of KPI Tracking for Restaurants & Food Services
In the fast-paced food industry, data-driven decision-making is crucial. Restaurants face numerous challenges such as high competition, fluctuating ingredient costs, and evolving customer preferences.
Monitoring KPIs helps in:
-
Evaluating financial performance
-
Optimizing supply chain management
-
Improving customer satisfaction
-
Controlling costs and waste
-
Ensuring consistent quality and efficiency
With this dashboard, managers can make informed decisions backed by real-time insights rather than guesswork.
📈 Key KPIs for Restaurants & Food Services
Below are some examples of KPIs commonly tracked in the Power BI dashboard:
🧾 Financial KPIs
-
Revenue Growth (%) – Measures increase in total sales over time.
-
Gross Profit Margin (%) – Indicates profitability after deducting cost of goods sold.
-
Average Check Value (USD) – Tracks the average spending per customer.
-
Cost of Goods Sold (COGS %) – Helps control material costs relative to revenue.
👩🍳 Operational KPIs
-
Table Turnover Rate – Measures how efficiently tables are used.
-
Inventory Turnover Ratio – Evaluates how quickly inventory is sold or used.
-
Order Accuracy Rate (%) – Reflects operational precision.
-
Food Waste (%) – Tracks how much prepared food goes unused or discarded.
👥 Customer KPIs
-
Customer Satisfaction Score (CSAT) – Captures guest satisfaction levels.
-
Repeat Customer Rate (%) – Measures loyalty and return visits.
-
Complaint Resolution Time (mins) – Shows service responsiveness.
By visualizing these KPIs, restaurant owners can maintain profitability while enhancing the overall customer experience.
🖥️ How the Power BI Dashboard Works
-
Data Input – Enter actual, target, and previous year data into the Excel sheets.
-
Data Refresh – Power BI automatically updates visuals upon refresh.
-
Interactive Filtering – Use slicers to analyze data by month or KPI group.
-
Visual Comparison – View MTD/YTD actual vs. target results with icons and color codes.
-
Drill-Through for Details – Get KPI definitions and formulas for context.
This automated workflow eliminates manual effort, ensuring faster reporting and better decision-making.
Click to Purchases Restaurants & Food Services KPI Dashboard in Power BI
🧠 Advantages of the Restaurants & Food Services KPI Dashboard in Power BI
✅ Real-Time Monitoring: Instantly updates results when new data is entered.
✅ Clear Visuals: Charts, cards, and icons make complex data easy to interpret.
✅ Time Savings: Reduces manual reporting and repetitive calculations.
✅ Error Reduction: Automated formulas ensure accurate metrics.
✅ Performance Transparency: All KPIs are visible to stakeholders.
✅ Customizable: Add, remove, or modify KPIs to fit your business model.
✅ Comparative Insights: Analyze MTD and YTD performance against targets and previous years.
✅ User-Friendly: No coding required — built with simplicity in mind.
This dashboard empowers restaurant owners to make decisions confidently and efficiently.
⚙️ How Power BI Transforms Restaurant Management
Power BI enhances operational efficiency in many ways:
-
Consolidates all data sources (sales, finance, HR) into one platform.
-
Enables predictive insights through trends and historical analysis.
-
Encourages accountability by assigning KPIs to departments.
-
Improves communication by visually sharing reports with teams.
-
Supports sustainability efforts by tracking waste and cost-saving metrics.
When used effectively, Power BI becomes a strategic tool that drives restaurant growth and profitability.
🧭 Best Practices for Using the Restaurants & Food Services KPI Dashboard
To make the most of this tool, follow these practical best practices:
-
Update Data Monthly
Keep the Excel sheets current to ensure accuracy. -
Define KPIs Clearly
Maintain consistent KPI definitions for all stakeholders. -
Review Both MTD and YTD
Short-term and long-term comparisons reveal meaningful insights. -
Leverage Trend Charts
Use the KPI Trend Page to identify recurring issues or seasonal patterns. -
Set Realistic Targets
Align goals with achievable benchmarks to motivate teams. -
Encourage Collaboration
Share Power BI reports across departments to promote unified performance tracking. -
Use Conditional Formatting Effectively
Let color-coded icons highlight key variances instantly. -
Drill Down for Root Causes
Investigate underperforming KPIs using the Definition Page to understand their formulas.
🍽️ Real-World Applications
-
Restaurant Chains: Monitor sales, staff efficiency, and customer retention across multiple locations.
-
Catering Services: Track event performance and cost margins.
-
Quick-Service Restaurants (QSRs): Measure speed, accuracy, and waste levels.
-
Fine Dining Establishments: Analyze guest feedback and table utilization.
-
Food Delivery Businesses: Track order volumes, delivery time, and accuracy.
No matter the size or type of restaurant, this dashboard delivers the insights needed to improve profitability and enhance service quality.
📘 How to Get Started
-
Download the Dashboard
Get the ready-to-use Power BI file. -
Prepare Your Data
Fill in the Excel sheets (Actuals, Targets, Definitions). -
Connect Excel to Power BI
Load the data and refresh visuals automatically. -
Analyze and Take Action
Explore KPI insights, identify issues, and make informed business decisions.
With just a few steps, your restaurant’s data turns into a powerful visual management tool.
📅 Why Choose Power BI for Restaurant Analytics?
💡 Interactive Reports: Drill down into specifics and visualize trends dynamically.
⚡ Automation: Power BI refreshes dashboards automatically with new data.
🔒 Data Security: Control access levels for teams and departments.
🔄 Integration: Connects easily with Excel, SQL, or other databases.
📊 Scalability: Works for single restaurants or global chains alike.
Power BI simplifies the process of tracking KPIs and makes business intelligence accessible for everyone — from managers to owners.
🏁 Conclusion
The Restaurants & Food Services KPI Dashboard in Power BI is a must-have solution for modern restaurant management.
By combining clear visuals, real-time analytics, and easy Excel integration, it transforms how businesses measure and improve their performance.
With actionable insights across sales, operations, and customer experience, restaurants can boost profitability, minimize waste, and maintain consistent quality.
If you want to run your restaurant based on facts instead of intuition, this dashboard is your ultimate tool for smarter decisions.
Click to Purchases Restaurants & Food Services KPI Dashboard in Power BI
❓ Frequently Asked Questions (FAQs)
1. What is a Restaurants KPI Dashboard in Power BI?
It’s a data visualization tool that tracks restaurant performance metrics like sales, costs, and customer satisfaction in Power BI.
2. Can I connect live data instead of Excel?
Yes. You can connect Power BI directly to POS systems, databases, or cloud services for real-time data updates.
3. Is this dashboard customizable?
Absolutely. You can add or modify KPIs, visuals, and filters based on your restaurant’s requirements.
4. Do I need Power BI Pro?
For sharing and collaboration features, Power BI Pro is recommended. However, basic use works with Power BI Desktop.
5. What if I have multiple branches?
You can add branch-level filters or create additional reports for comparative insights.
6. Can non-technical staff use it?
Yes. The interface is intuitive, requiring no technical background to interpret visuals.
7. Does it support both MTD and YTD analysis?
Yes. The dashboard displays both month-to-date and year-to-date comparisons along with target vs actual visuals.
Click to Purchases Restaurants & Food Services KPI Dashboard in Power BI
Visit our YouTube channel to learn step-by-step video tutorials