In the world of sales, tracking performance is not optional—it’s essential. Every company aims to hit or exceed its targets, but without clear, actionable insights, this mission becomes a shot in the dark. That’s where a Sales Target Dashboard in Excel comes into play. 🧭
This powerful, easy-to-use, and fully interactive Excel dashboard enables sales teams and business leaders to monitor performance, analyze trends, and track achievement percentages—all in one place. Whether you’re managing a team of ten or a hundred, this tool helps you stay ahead.
In this comprehensive guide, we’ll explore everything you need to know about the Sales Target Dashboard in Excel—its structure, key features, benefits, and best practices. Let’s dive in! 💡
Click to Purchases Sales Target Dashboard in Excel
What is a Sales Target Dashboard in Excel?
A Sales Target Dashboard in Excel is a dynamic reporting tool designed to compare Actual Sales vs Target Sales and deliver data-driven insights in a visual format. It includes charts, cards, filters (often referred to as “slicers”), and performance indicators that allow managers to:
-
Evaluate achievement percentages 📈
-
Monitor target variances 📉
-
Identify top performers 🏆
-
Analyze monthly trends 📆
-
Make strategic decisions with confidence 🤝
It acts as the central hub for performance review, making sales data not only more accessible but also more actionable.
Structure of the Sales Target Dashboard in Excel
This Excel dashboard contains five interactive pages, each tailored for a specific analytical view. With the Page Navigator on the left-hand side, users can quickly switch between these pages for focused insights.
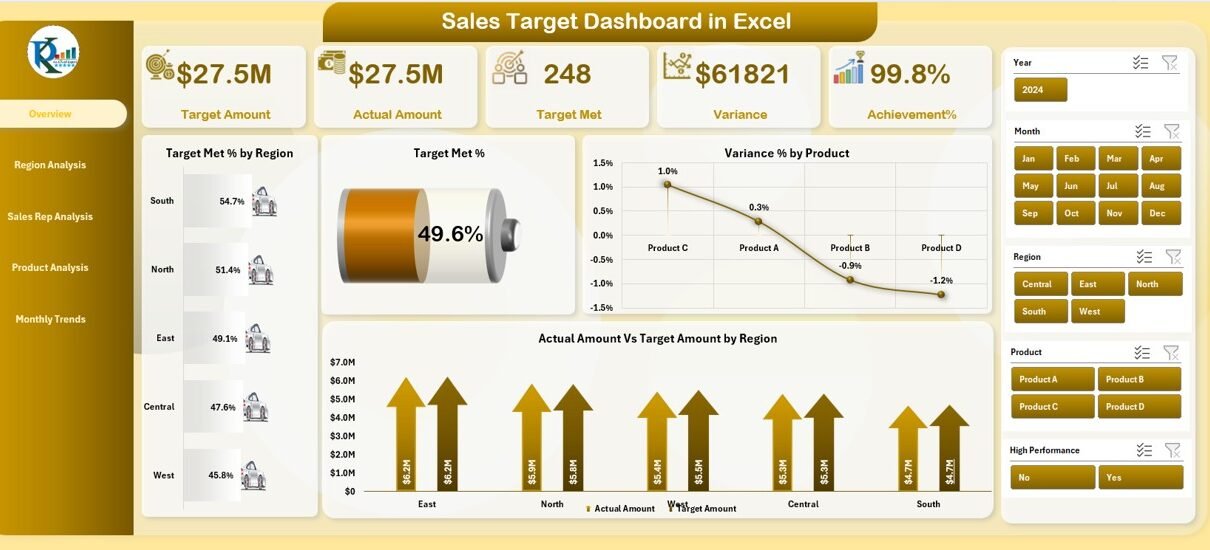
Overview Page
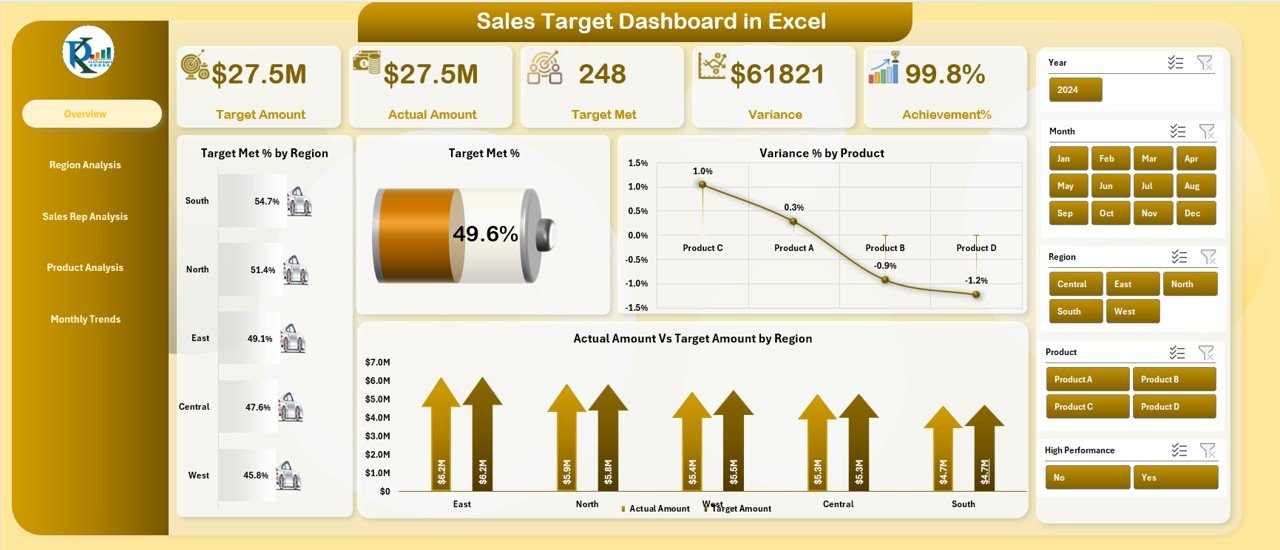
The Overview Page is the heart of the dashboard, providing a high-level summary of sales performance.
Key Elements:
-
🎯 5 Metric Cards – Highlighting Total Sales, Target Amount, Achievement %, Target Met %, and Variance %
📊 4 Charts:
- Target Met % by Region
- Overall Target Met %
- Variance % by Product
- Actual vs Target Amount by Region
-
🎚️ Slicers on the right – Filter by Region, Sales Rep, Product, Month, and Year
This page gives a quick health check of the business and allows stakeholders to spot red flags or opportunities in seconds.
Region Analysis Page
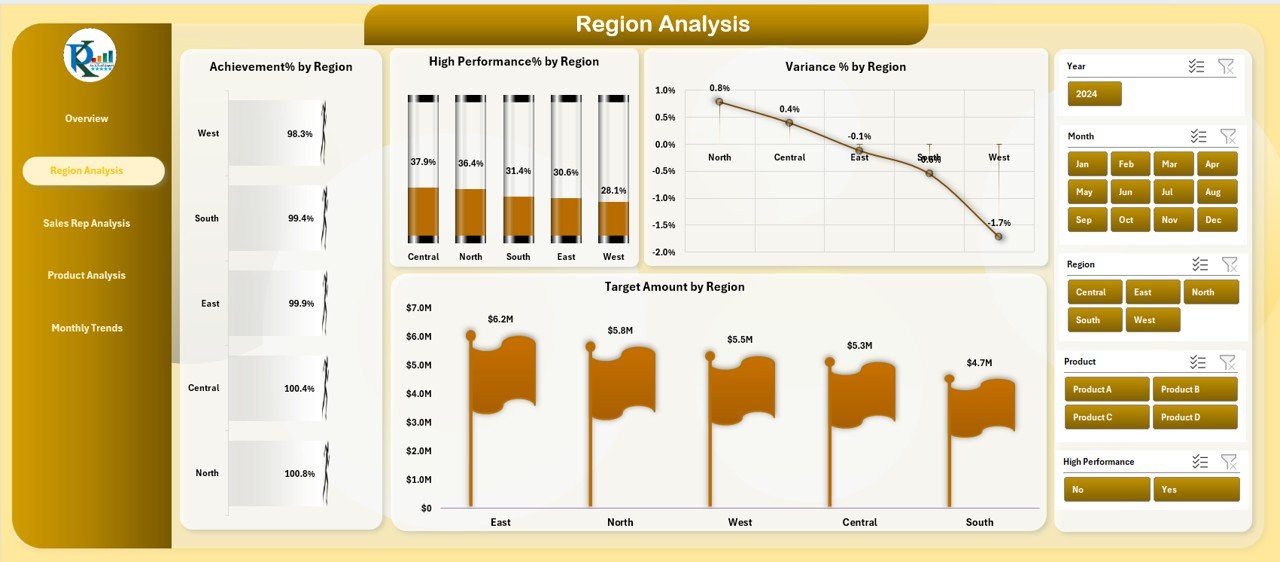
This section provides region-wise performance analysis, enabling localized decision-making.
Click to Purchases Sales Target Dashboard in Excel
Charts Included:
-
🌎 Achievement % by Region
-
🏅 High Performance % by Region
-
📉 Variance % by Region
-
💰 Target Amount by Region
With the slicers, you can narrow down data by product or sales rep to drill deeper into regional dynamics.
Sales Rep Analysis Page
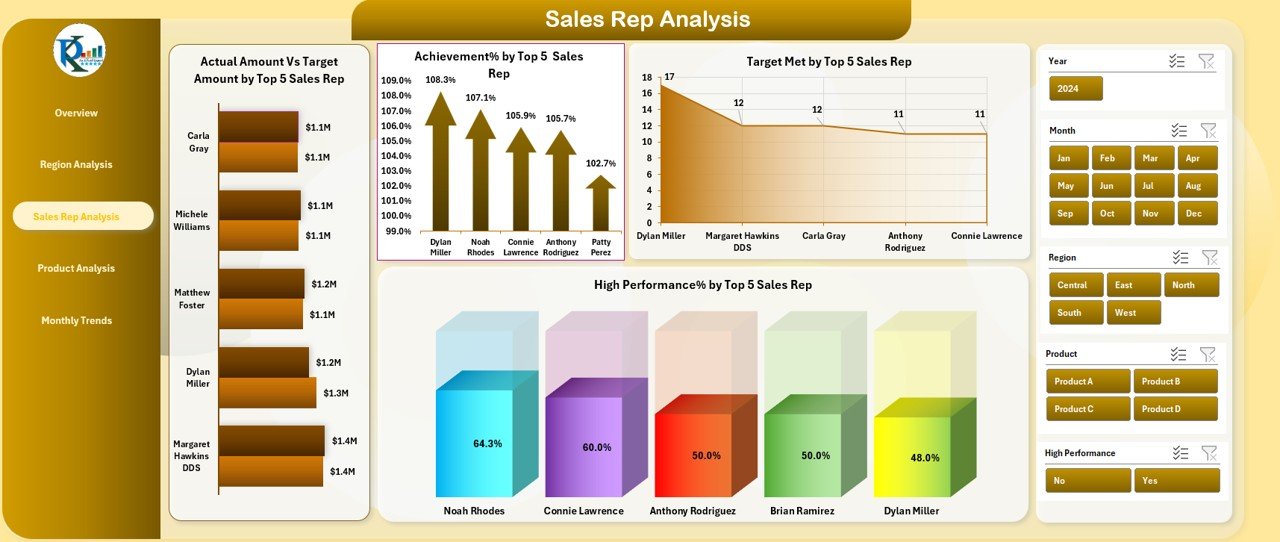
This page shines a light on individual performance metrics for sales representatives.
Key Charts:
-
👤 Actual vs Target Amount by Top 5 Sales Reps
-
🧮 Achievement % by Top 5 Sales Reps
-
✔️ Target Met Count by Top 5 Sales Reps
-
🔥 High Performance % by Top 5 Sales Reps
It’s ideal for sales managers who want to recognize top performers and identify underperformers.
Product Analysis Page
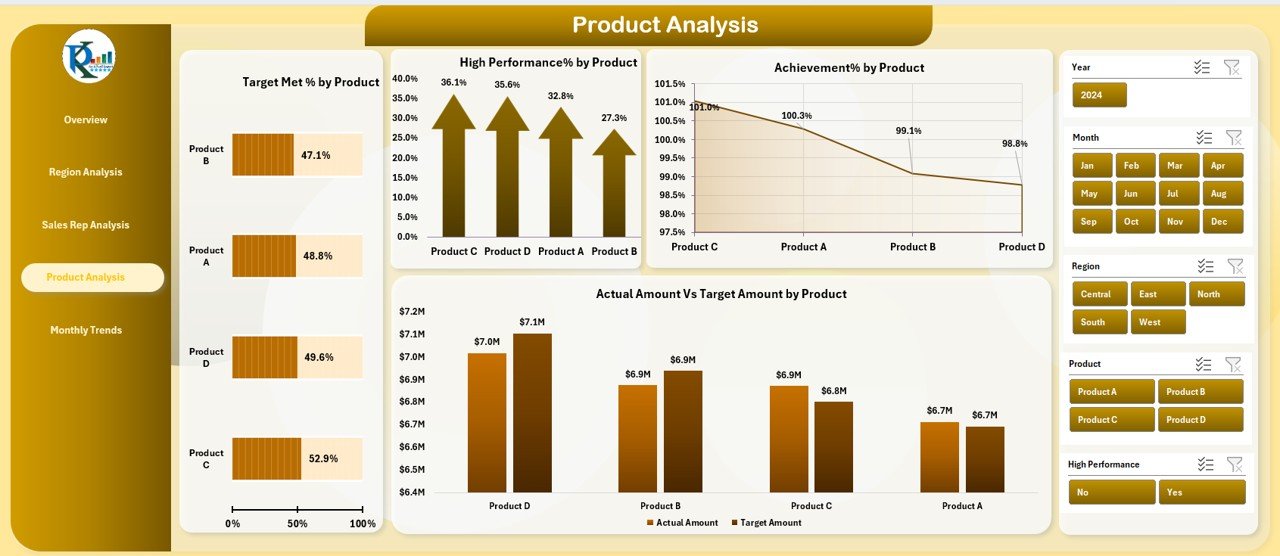
Here, we focus on product-level performance, crucial for marketing and inventory planning.
Visuals Included:
-
🧪 Target Met % by Product
-
🔼 High Performance % by Product
-
📊 Achievement % by Product
-
🆚 Actual vs Target Amount by Product
Product managers can use this to find which products consistently outperform or need strategic intervention.
Monthly Trends Page
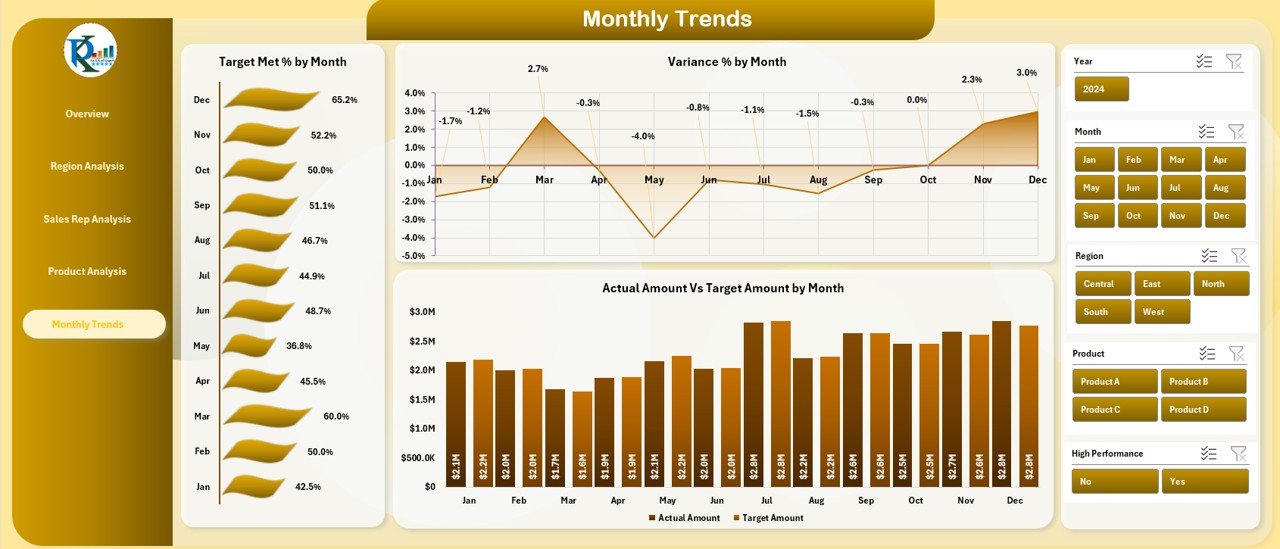
Time-based analysis is crucial. This page showcases how performance changes over months.
Monthly Charts:
-
📅 Target Met % by Month
-
📉 Variance % by Month
-
📊 Actual vs Target Amount by Month
This view is particularly useful for quarterly reviews and forecasting.
Advantages of Using a Sales Target Dashboard in Excel
Using this Excel-based dashboard can transform how your team works. Let’s look at the key advantages:
-
✅ Easy to Use – Built on Excel, no need for specialized tools or training
-
📈 Real-Time Insights – Visualizations update automatically with new data
-
🛠️ Fully Customizable – Add or remove KPIs and metrics as per business needs
-
💰 Cost-Effective – No subscription or expensive BI tools required
-
🧩 Modular Design – Analyze by region, product, rep, and time frame
-
🚦 Highlight Issues Quickly – Visual indicators make problems obvious
-
📋 Professional Reports – Impress stakeholders with polished insights
Why Choose Excel for Sales Dashboards?
While there are many BI tools out there, Excel still dominates in accessibility, flexibility, and adoption.
Here’s why Excel remains a top choice:
-
✔️ Widely Available: Every team already uses Excel
-
✔️ Lower Learning Curve: Familiar interface
-
✔️ Supports Advanced Formulas: Use VLOOKUP, INDEX-MATCH, SUMIFS, etc.
-
✔️ Integrates with Power Query and PivotTables
-
✔️ Easy to Share & Print
Best Practices for the Sales Target Dashboard in Excel
To make the most of this dashboard, follow these best practices:
1. Keep Data Structured and Clean
Use a well-formatted table for actual and target values with fields like:
-
Date
-
Region
-
Product
-
Sales Rep
-
Actual Amount
-
Target Amount
2. Use Clear Naming Conventions
Keep names for KPIs, charts, and slicers short and intuitive.
3. Update Data Regularly
Maintain a weekly or monthly update schedule to ensure decisions reflect the latest numbers.
4. Leverage Conditional Formatting
Use up/down arrows, color codes, and bars to show performance levels.
5. Protect Your Sheets
Lock formula cells to avoid accidental changes while allowing data entry in designated areas.
6. Build with Scalability in Mind
Design your dashboard so that it can handle an increase in data volume without breaking formulas or visuals.
How to Use the Sales Target Dashboard in Excel?
Click to Purchases Sales Target Dashboard in Excel
Here’s a step-by-step way to interact with the dashboard:
-
Open the Excel file
-
Use the Page Navigator on the left to go to any section
-
Apply Slicers to filter data (Region, Sales Rep, Product, etc.)
-
Review KPIs on the cards to understand overall health
-
Check charts for performance gaps
-
Download or share reports by exporting charts as images or PDF
This user-friendly process ensures that even non-technical users can make sense of complex data.
Real-World Use Cases for This Dashboard
This Sales Target Dashboard isn’t just theory—it’s already helping teams across industries:
-
🛍️ Retail Chains track region-wise sales vs target for stores
-
🧪 Pharmaceutical Companies analyze rep-level performance
-
🏢 SaaS Companies use it to evaluate BDR and SDR teams
-
🚗 Automobile Dealers compare product-wise monthly target achievements
-
📦 FMCG Brands monitor high-velocity products vs forecast
How to Customize the Dashboard for Your Business?
You can easily customize the Excel dashboard:
-
🎨 Add your branding (logo, fonts, colors)
-
🧮 Insert custom KPIs like Profit Margin, ASP, or Order Count
-
📁 Add a new sheet for “Previous Year Comparison”
-
🔧 Modify slicers to include Sales Channels, Zones, or Territories
SEO Benefits of Sharing This Dashboard on Your Website
If you offer sales solutions or training, showcasing this dashboard on your blog can:
-
📈 Increase organic traffic with “sales dashboard” and “target tracker” keywords
-
🧲 Generate leads by offering a downloadable version
-
📊 Demonstrate your data literacy and analytical capabilities
-
🤝 Improve trust and conversion by showing tools in action
Conclusion
The Sales Target Dashboard in Excel is more than a spreadsheet—it’s your performance command center. Whether you’re tracking a regional sales force, product lines, or monthly performance, this dashboard ensures clarity, precision, and control.
With easy navigation, actionable metrics, and interactive charts, you can take data-driven decisions faster and smarter.
Don’t just set targets—hit them with confidence! ✅
Frequently Asked Questions (FAQs)
Q1. Can I use this dashboard for any industry?
Absolutely! It’s designed to be industry-agnostic. You can customize fields based on your sector.
Q2. How do I update data in the dashboard?
You just need to update the Actual and Target tables. Charts and KPIs will refresh automatically if the formulas are linked properly.
Q3. Can I add new KPIs to this dashboard?
Yes, you can. Simply insert new metrics in the data sheet and link them to charts or cards as needed.
Q4. Is Excel sufficient for large sales teams?
Yes, but if your dataset exceeds 100K+ rows, consider using Power Query or migrating to Power BI.
Q5. Can I share this dashboard with my team?
Yes. You can share via email or cloud platforms like OneDrive or SharePoint. Make sure to lock formulas before sharing.
Q6. Does this dashboard require advanced Excel skills?
Not at all. It’s designed for intermediate Excel users. However, knowing PivotTables and slicers helps.
Visit our YouTube channel to learn step-by-step video tutorials
Click to Purchases Sales Target Dashboard in Excel
Watch the step-by-step video tutorial: