In today’s digital world, organizations face growing cybersecurity risks, operational threats, and compliance challenges. Every company manages sensitive data, business systems, and digital infrastructure that require continuous monitoring. Therefore, security teams must track incidents, analyze risks, and respond quickly to threats.However, many organizations still depend on scattered spreadsheets and manual reporting. As a result, decision-makers struggle to understand security performance in real time. They often miss early warning signs, which increases operational risks and financial losses.So, how can organizations monitor security incidents efficiently and make faster decisions?The answer is simple — Security Dashboard in Power BI.This article explains everything you need to know about a Security Dashboard in Power BI, including its features, dashboard pages, benefits, implementation process, best practices, and frequently asked questions.
Click to buy Security Dashboard in Power BI
What Is a Security Dashboard in Power BI?
A Security Dashboard in Power BI is an interactive analytics solution designed to monitor security incidents, risks, compliance performance, and operational security metrics using real-time visualizations.
Instead of reviewing multiple reports, teams can track all key security indicators in one centralized dashboard.
Power BI transforms raw security data into meaningful insights through:
- Interactive charts
- KPI cards
- Trend analysis
- Incident monitoring visuals
- Location-based risk analysis
- Compliance tracking
As a result, security managers gain complete visibility into organizational security performance.
Why Do Organizations Need a Security Dashboard?
Modern businesses operate in complex digital environments. Therefore, security teams must continuously monitor incidents and vulnerabilities.
Without a centralized dashboard:
- Incident tracking becomes slow.
- Teams struggle to prioritize threats.
- Reporting consumes valuable time.
- Leadership lacks real-time insights.
However, a Power BI security dashboard solves these problems by providing clear, visual analytics.
Key Reasons Organizations Use Security Dashboards
- Monitor incidents in real time
- Improve response time
- Reduce security risks
- Track compliance performance
- Analyze impact costs
- Identify recurring threats
Consequently, organizations move from reactive security management to proactive risk control.
Key Features of the Security Dashboard in Power BI
The Security Dashboard in Power BI includes five interactive pages, each designed to analyze security performance from a different perspective.
Let’s explore each page in detail.
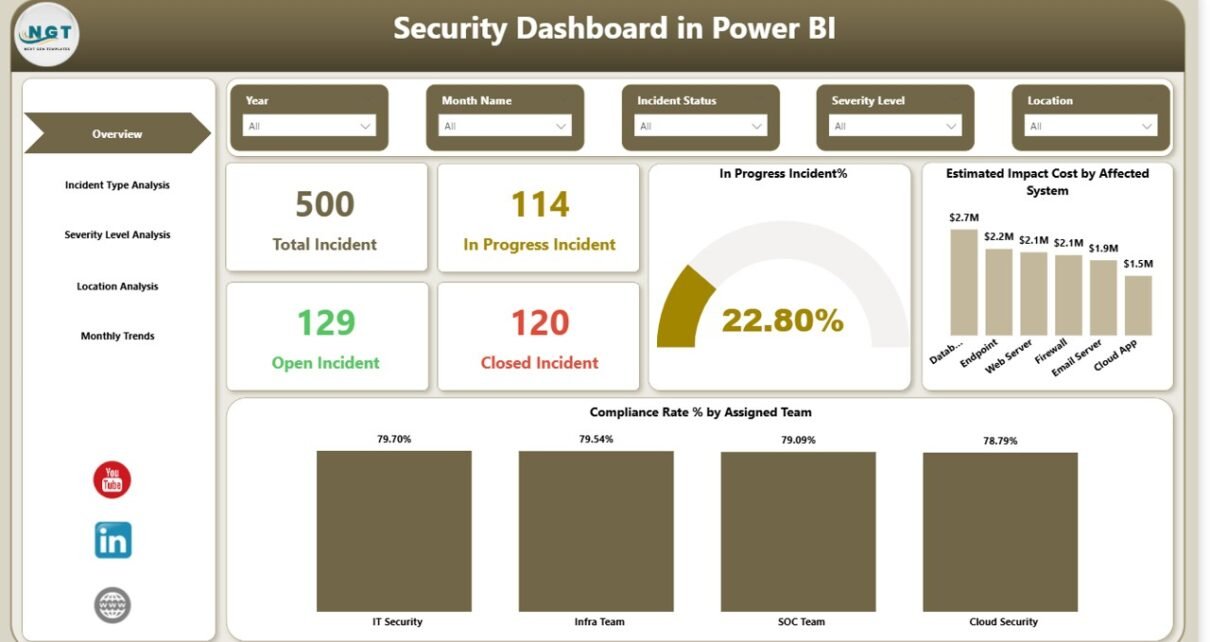
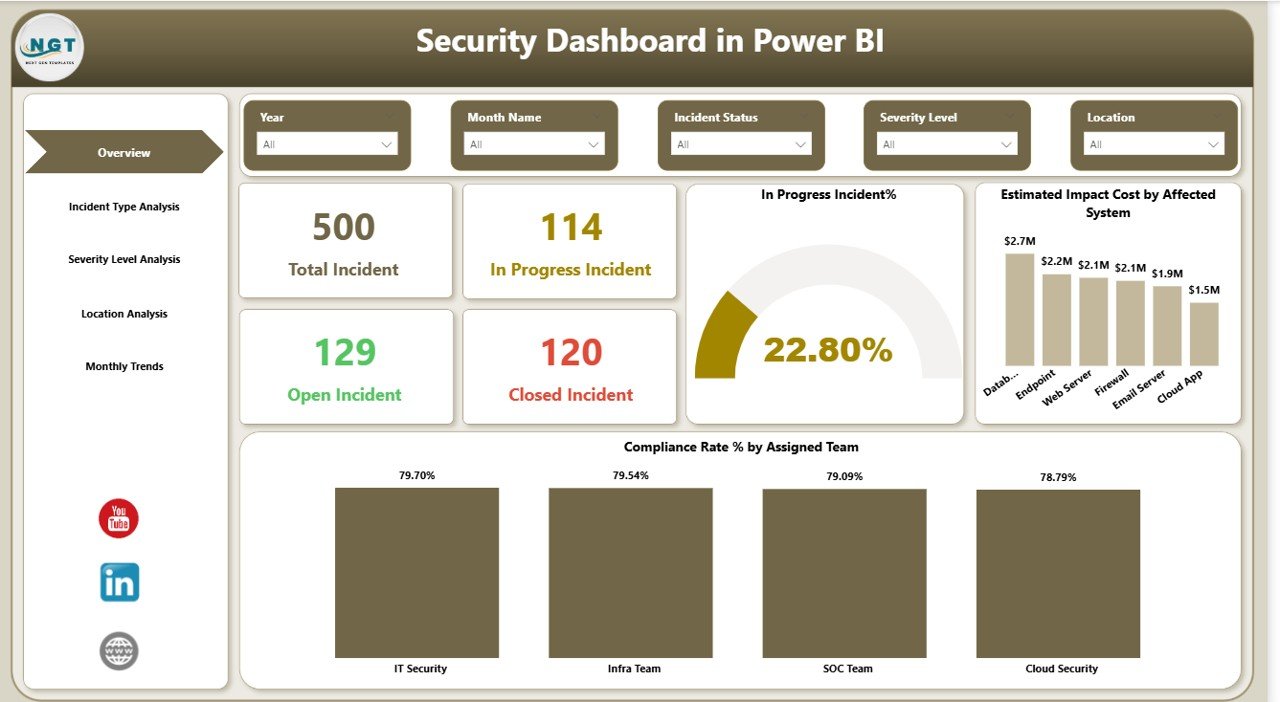
Overview Page – How Can You Monitor Security at a Glance?
The Overview Page acts as the central control panel of the dashboard. It provides a quick summary of overall security performance.
KPI Cards Available
- Total Incidents
- In Progress Incidents
- Open Incidents
- Closed Incidents
These cards allow managers to understand the current security status instantly.
Charts Included
- In Progress Incident %
- Estimated Impact Cost by Affected System
- Compliance Rate % by Assigned Team
Because all high-level metrics appear on one screen, decision-makers quickly identify areas that require attention.
Click to buy Security Dashboard in Power BI
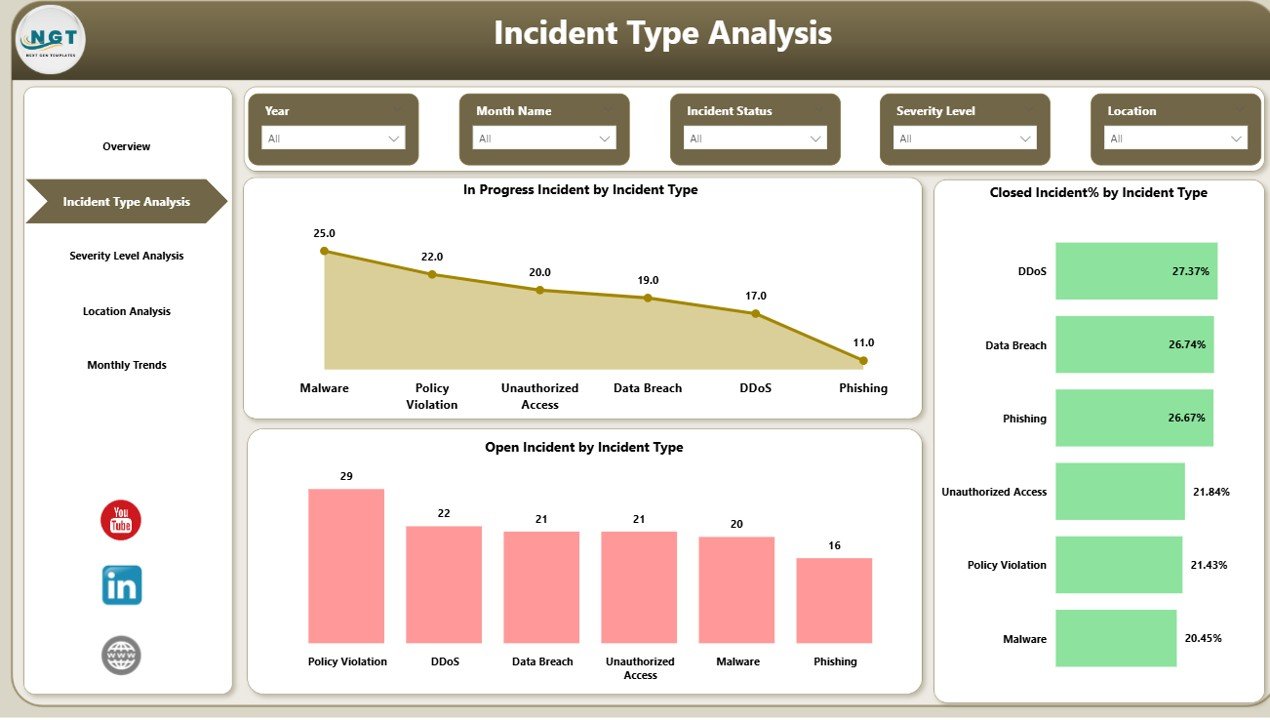
Incident Type Analysis – Which Incidents Occur Most Often?
The Incident Type Analysis Page helps organizations understand the nature of security threats.
Visuals Included
- In Progress Incidents by Incident Type
- Closed Incident % by Incident Type
- Open Incidents by Incident Type
This analysis reveals patterns such as:
- Frequent phishing attempts
- Malware incidents
- Unauthorized access cases
- Data leakage risks
Therefore, teams can prioritize prevention strategies effectively.
Click to buy Security Dashboard in Power BI
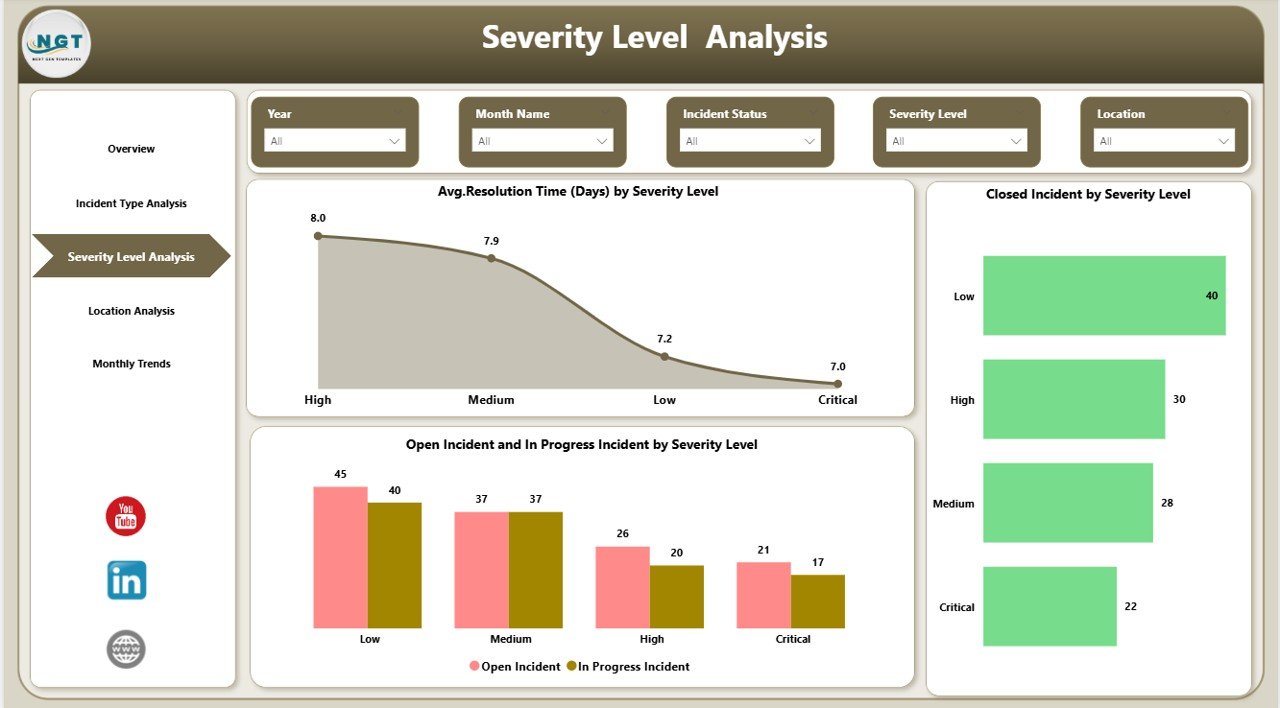
Severity Level Analysis – How Serious Are Security Incidents?
Not all incidents carry the same level of risk. Some require immediate action, while others need monitoring.
The Severity Level Analysis Page focuses on incident seriousness.
Charts Available
- Average Resolution Time (Days) by Severity Level
- Closed Incidents by Severity Level
- Open and In Progress Incidents by Severity Level
Using this analysis, organizations can:
- Evaluate response efficiency
- Identify high-risk incidents
- Improve escalation processes
As a result, teams reduce downtime and strengthen security posture.
Click to buy Security Dashboard in Power BI
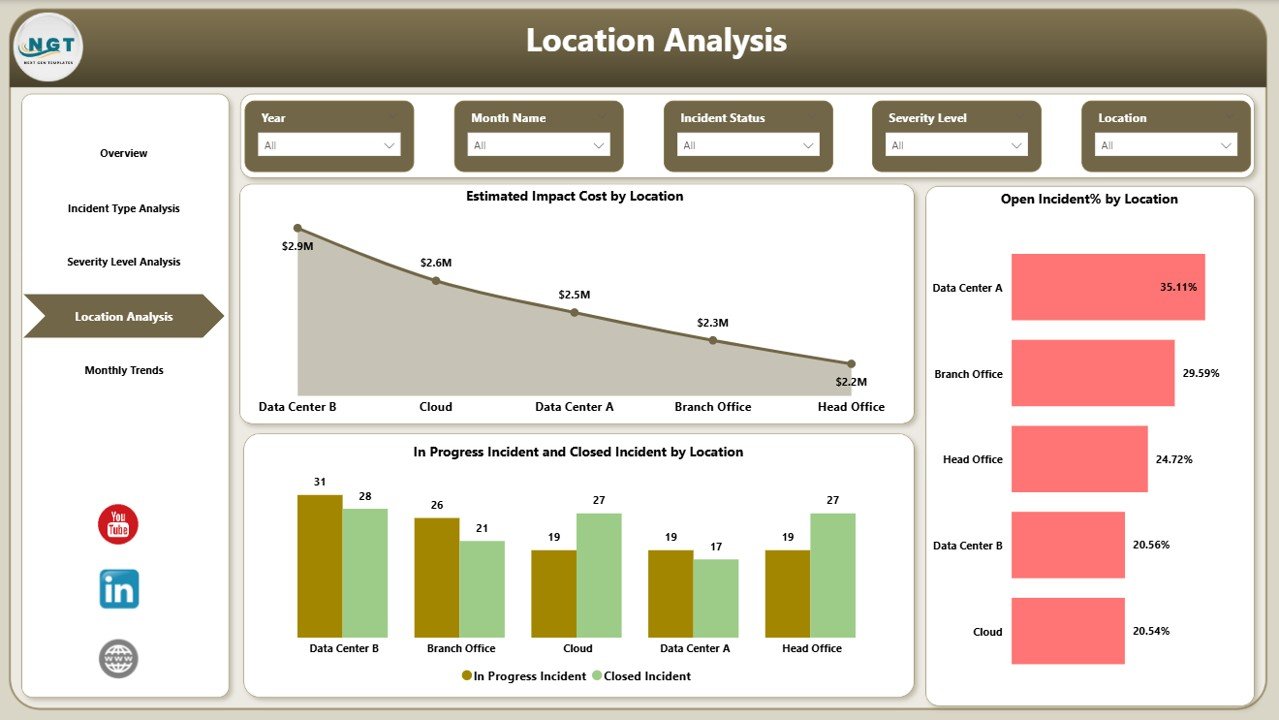
Location Analysis – Where Do Security Risks Occur?
Security risks often vary across regions or offices. Therefore, location-based analysis becomes essential.
The Location Analysis Page provides geographic insights.
Charts Included
- Estimated Impact Cost by Location
- Open Incident % by Location
- In Progress and Closed Incidents by Location
This page helps organizations:
- Identify vulnerable locations
- Allocate resources strategically
- Improve regional compliance
Consequently, leadership can focus efforts where risks remain highest.
Click to buy Security Dashboard in Power BI
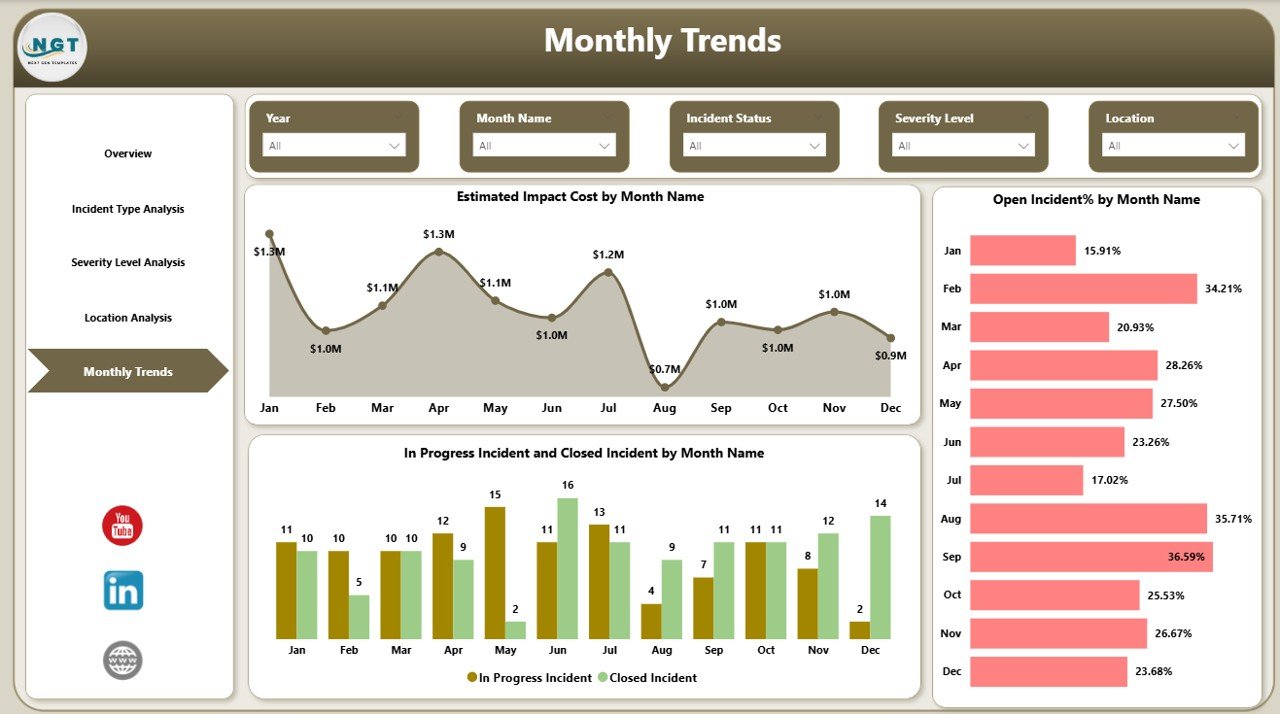
Monthly Trends – How Does Security Performance Change Over Time?
Security monitoring requires trend analysis. Without historical comparison, teams cannot measure improvement.
The Monthly Trends Page shows performance over time.
Visualizations Included
- Estimated Impact Cost by Month
- Open Incident % by Month
- In Progress and Closed Incidents by Month
Because trends appear clearly, organizations can:
- Detect recurring threats
- Measure improvement initiatives
- Forecast future risks
Click to buy Security Dashboard in Power BI
What KPIs Should a Security Dashboard Track?
A strong dashboard depends on meaningful KPIs. Therefore, organizations should include measurable indicators.
Common Security KPIs
- Total security incidents
- Incident resolution time
- Compliance rate
- Incident severity distribution
- Open vs closed incidents
- Estimated financial impact
- Team performance metrics
- Monthly incident trends
These KPIs allow leaders to measure both operational efficiency and risk exposure.
Advantages of Security Dashboard in Power BI
A Security Dashboard offers multiple strategic and operational benefits.
Real-Time Visibility
- Monitor incidents instantly
- Identify risks early
- Improve decision-making speed
Centralized Reporting
- Combine multiple data sources
- Reduce manual reporting
- Maintain one source of truth
Improved Incident Response
- Track resolution timelines
- Assign accountability
- Reduce response delays
Data-Driven Decisions
- Use visual analytics
- Compare performance trends
- Support leadership decisions
Better Compliance Monitoring
- Track team compliance rates
- Identify gaps quickly
- Improve audit readiness
How Does a Security Dashboard Improve Incident Management?
Incident management becomes more effective when teams use structured analytics.
Step-by-Step Impact
- Dashboard captures incident data.
- Power BI transforms data into visuals.
- Teams monitor status instantly.
- Managers identify critical issues.
- Teams respond faster.
- Leadership evaluates performance trends.
Therefore, organizations move toward proactive security operations.
How to Implement a Security Dashboard in Power BI?
Implementation becomes simple when organizations follow a structured approach.
Step 1: Define Security KPIs
Identify metrics that align with business security goals.
Step 2: Prepare Data Source
Collect data from:
- Incident management systems
- Security tools
- Excel files
- Compliance platforms
Step 3: Clean and Transform Data
Use Power Query to:
- Remove duplicates
- Standardize formats
- Create calculated fields
Step 4: Build Data Model
Create relationships between:
- Incident tables
- Teams
- Locations
- Severity levels
Step 5: Design Dashboard Pages
Create visuals for overview, analysis, and trends.
Step 6: Publish and Share
Upload dashboard to Power BI Service for collaboration.
Best Practices for the Security Dashboard in Power BI
Following best practices ensures long-term dashboard success.
Focus on Actionable KPIs
Track metrics that drive decisions instead of vanity metrics.
Keep Layout Simple
Avoid overcrowding visuals. Maintain clarity.
Use Consistent Colors
Use red, amber, and green indicators for quick understanding.
Enable Interactive Filters
Allow users to explore data dynamically.
Monitor Data Refresh
Schedule automatic updates for real-time monitoring.
Protect Sensitive Data
Apply role-based access control.
Who Can Benefit from a Security Dashboard?
Many industries benefit from security analytics.
Suitable Users Include
- IT Security Teams
- Cybersecurity Analysts
- Compliance Managers
- Risk Management Teams
- Operations Leaders
- Enterprise Executives
Because security impacts every department, dashboards support organization-wide visibility.
Future Trends in Security Analytics Using Power BI
Security analytics continues to evolve rapidly.
Emerging Trends
- AI-driven threat detection
- Predictive risk analytics
- Automated incident classification
- Real-time cloud monitoring
- Integration with SIEM tools
Therefore, Power BI dashboards will become even more intelligent and proactive.
Conclusion
Organizations cannot rely on manual security reporting anymore. Cyber threats evolve constantly, and businesses require faster insights to respond effectively.
A Security Dashboard in Power BI provides centralized monitoring, interactive analytics, and real-time visibility into security incidents. Moreover, it helps organizations analyze severity levels, monitor compliance, evaluate locations, and track monthly trends efficiently.
When organizations adopt a structured dashboard approach, they improve response time, reduce risks, and strengthen overall security performance.
Ultimately, the Security Dashboard transforms security management from reactive monitoring into proactive protection.
Frequently Asked Questions (FAQs)
What is the purpose of a Security Dashboard in Power BI?
A Security Dashboard helps organizations monitor incidents, risks, and compliance performance using interactive visuals and real-time analytics.
Can Power BI connect with security tools?
Yes. Power BI connects with Excel, databases, cloud platforms, APIs, and security management systems.
Who should use a Security Dashboard?
Security analysts, IT teams, compliance managers, and executives benefit from dashboard insights.
Does the dashboard support real-time monitoring?
Yes. Scheduled refresh and live connections allow near real-time monitoring.
What KPIs are most important in a security dashboard?
Key KPIs include incident count, resolution time, compliance rate, severity distribution, and impact cost.
Is Power BI suitable for enterprise security reporting?
Yes. Power BI supports scalability, role-based security, and enterprise-level analytics.
How often should security dashboards refresh data?
Organizations usually refresh data hourly or daily depending on operational requirements.
Visit our YouTube channel to learn step-by-step video tutorials
Watch the step-by-step video tutorial:
Click to buy Security Dashboard in Power BI