In today’s competitive digital landscape, SEO and SEM services play a crucial role in driving traffic, leads, and revenue. However, success in SEO and paid search does not depend only on execution. Instead, it depends heavily on how effectively teams track, analyze, and optimize performance.
That is exactly where an SEO and SEM Services KPI Dashboard in Excel becomes a powerful solution.
This comprehensive guide explains what an SEO and SEM Services KPI Dashboard in Excel is, why it is essential, how it works, and how each worksheet supports smarter marketing decisions. Moreover, you will learn its advantages, best practices, real-world use cases, and answers to frequently asked questions.
Click to Purchases SEO and SEM Services KPI Dashboard in Excel
What Is an SEO and SEM Services KPI Dashboard in Excel?
An SEO and SEM Services KPI Dashboard in Excel is a ready-to-use performance tracking tool that consolidates key SEO and paid search KPIs into a single, interactive Excel workbook.
Instead of checking multiple tools for traffic, rankings, conversions, cost, and ROI, this dashboard brings everything together in Microsoft Excel.
As a result, marketing teams gain:
-
Clear visibility into SEO and SEM performance
-
Accurate MTD and YTD tracking
-
Easy comparison with targets and previous year results
Why Do SEO and SEM Teams Need a KPI Dashboard?
SEO and SEM campaigns generate large volumes of data. Therefore, without a structured dashboard, teams often struggle to convert raw data into insights.
Because of that, many organizations face:
-
Scattered reports across tools
-
Delayed performance reviews
-
Difficulty comparing targets vs actuals
-
Limited historical trend visibility
An SEO and SEM KPI Dashboard in Excel solves these challenges by offering centralized reporting, visual clarity, and actionable insights.
How Does an SEO and SEM Services KPI Dashboard in Excel Work?
This dashboard uses manual or exported data inputs combined with dynamic Excel formulas and visuals.
How the Workflow Looks
-
Users enter actual, target, and previous year data
-
Excel automatically calculates KPIs
-
Dashboards update instantly based on selected month
-
Teams analyze performance and trends
Therefore, teams spend less time building reports and more time optimizing campaigns.
Click to Purchases SEO and SEM Services KPI Dashboard in Excel
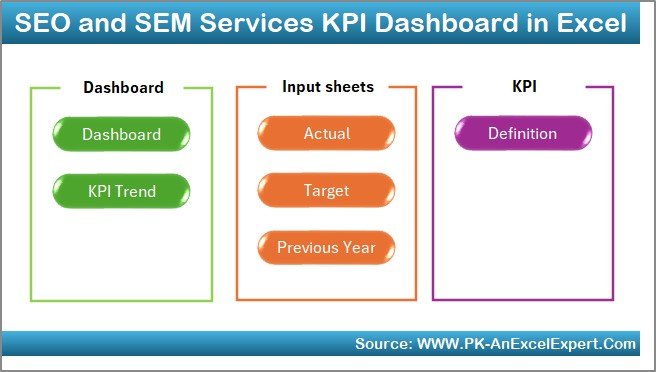
What Worksheets Are Included in the SEO and SEM KPI Dashboard in Excel?
The dashboard contains 7 well-structured worksheets, each designed for a specific purpose.
1) Home Sheet: How Does It Improve Navigation?
The Home Sheet acts as an index page for the entire dashboard.
Key Purpose of the Home Sheet
-
Provides 6 navigation buttons
-
Allows users to jump directly to any worksheet
-
Improves usability for non-technical users
Because of this layout, even first-time users can navigate the dashboard confidently.
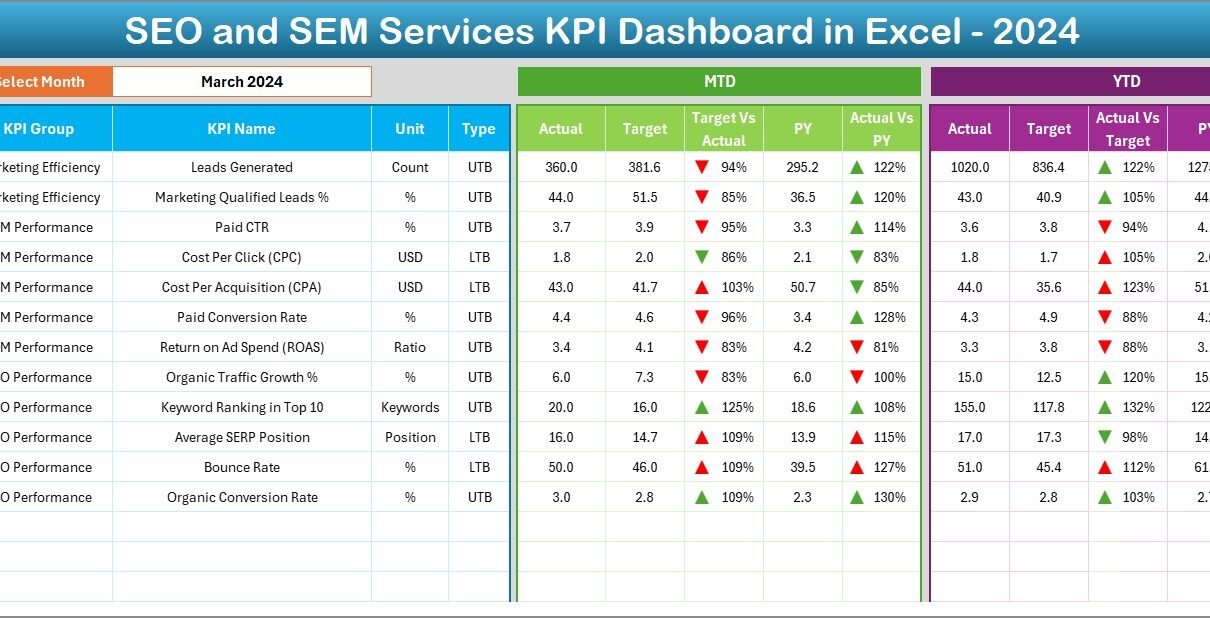
2) Dashboard Sheet: How Does It Deliver a Complete KPI Overview?
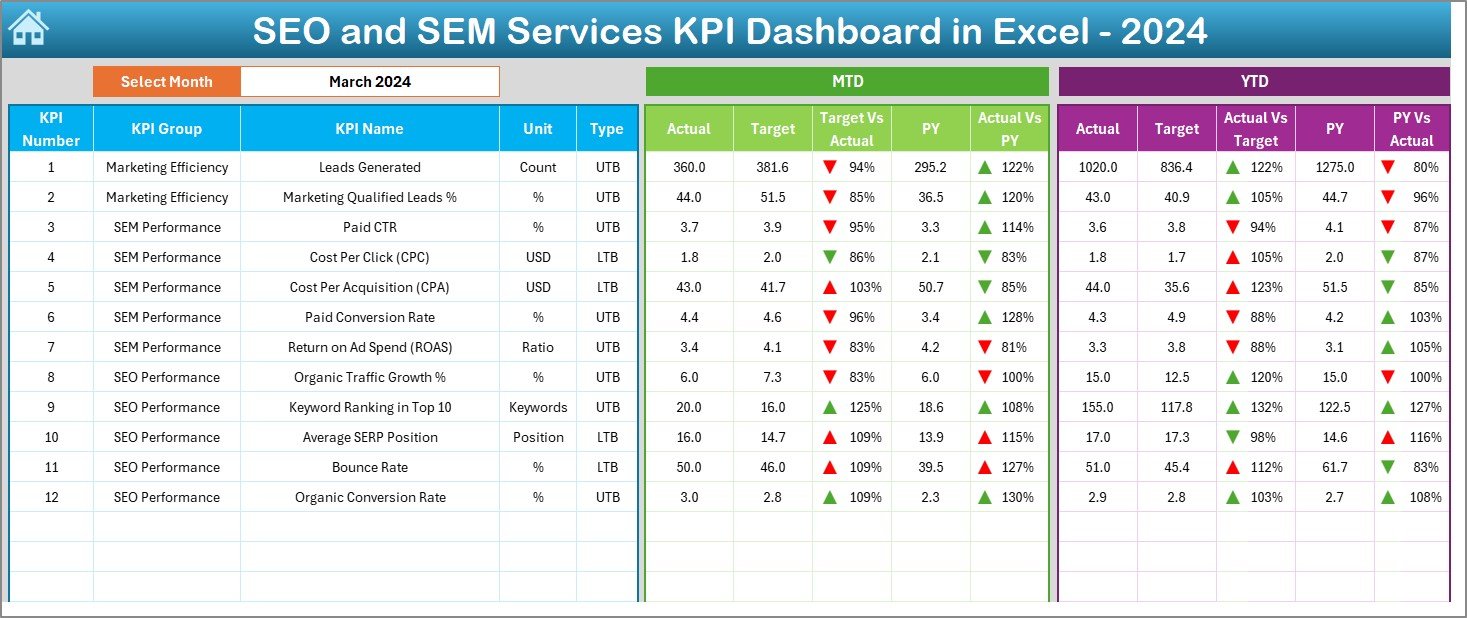
The Dashboard Sheet is the core of the workbook.
Month Selection
On cell D3, users can select the month from a drop-down list. As soon as the month changes, the entire dashboard updates automatically.
KPIs Displayed on the Dashboard
The dashboard shows both MTD and YTD performance, which ensures balanced analysis.
Month-to-Date (MTD) Metrics
-
Actual MTD
-
Target MTD
-
Previous Year MTD
-
Target vs Actual %
-
PY vs Actual %
-
Conditional formatting arrows (▲ ▼)
Year-to-Date (YTD) Metrics
-
Actual YTD
-
Target YTD
-
Previous Year YTD
-
Target vs Actual %
-
PY vs Actual %
-
Conditional formatting arrows (▲ ▼)
Because of conditional formatting, users can instantly identify:
-
KPIs performing well
-
KPIs that need attention
3) KPI Trend Sheet: How Can You Analyze SEO and SEM Trends?
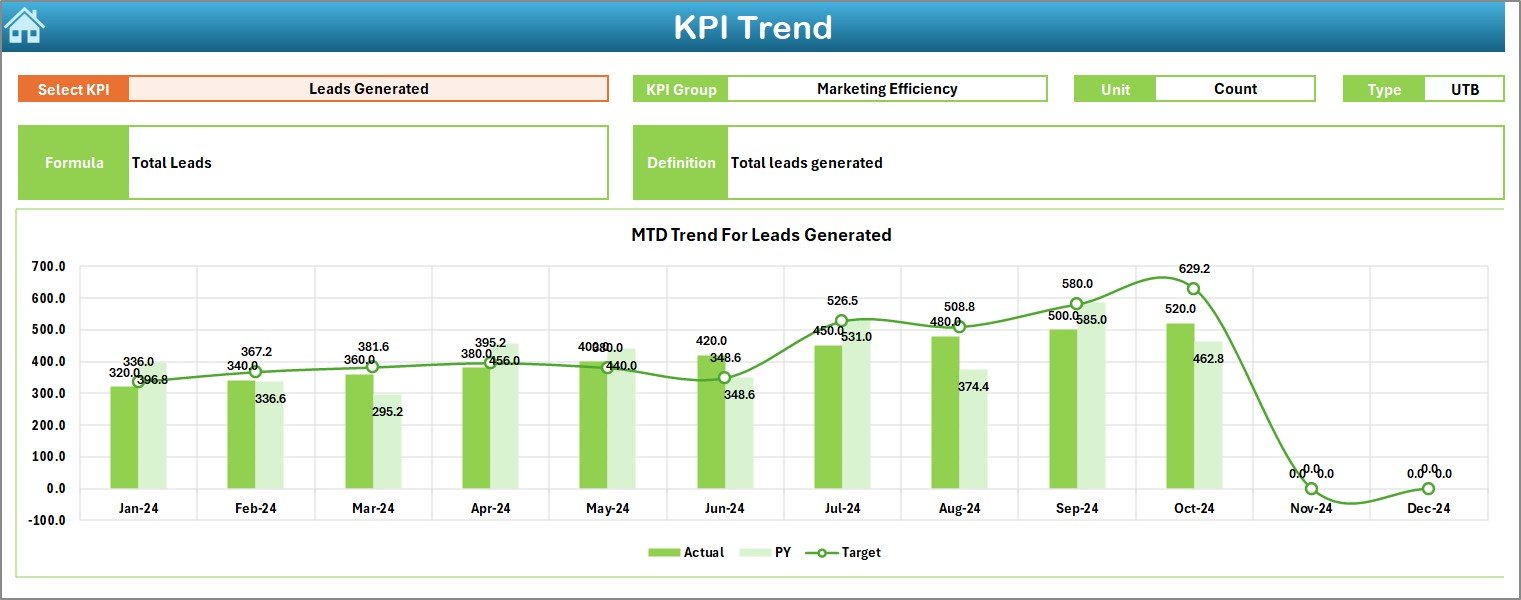
The KPI Trend Sheet focuses on deep-dive analysis for individual KPIs.
KPI Selection
Users can select a KPI name from the drop-down available on cell C3.
KPI Details Displayed
Once a KPI is selected, the sheet shows:
-
KPI Group
-
Unit of Measurement
-
KPI Type (Lower the Better or Upper the Better)
-
KPI Formula
-
KPI Definition
This information ensures clarity and consistency across teams.
Trend Charts
The sheet displays MTD and YTD trend charts for:
-
Actual values
-
Target values
-
Previous Year values
Therefore, users can easily spot:
-
Growth or decline patterns
-
Seasonal behavior
-
Long-term campaign impact
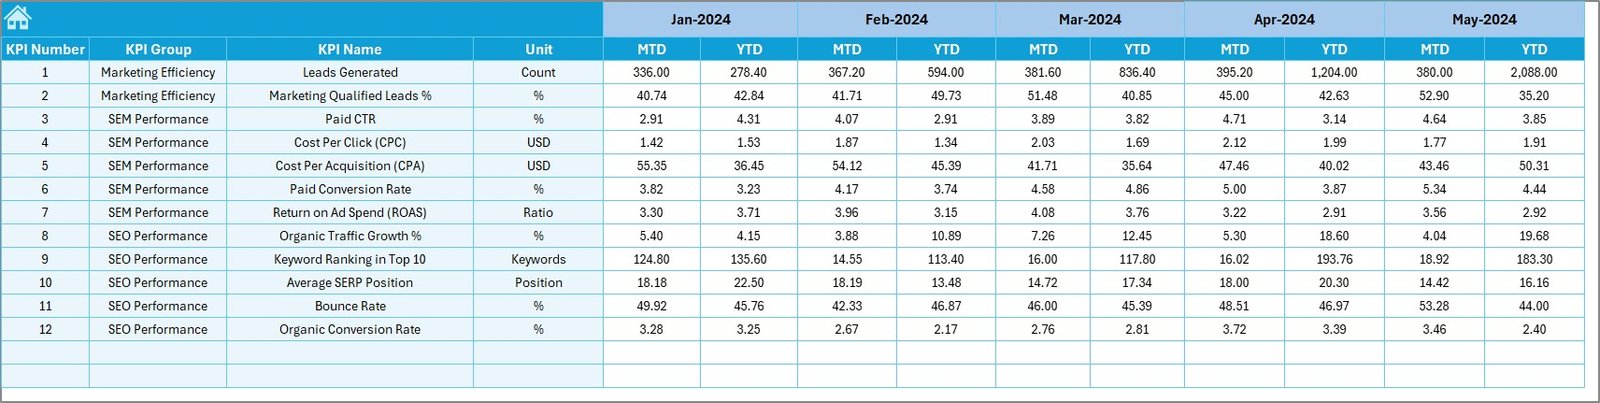
4) Actual Numbers Input Sheet: How Do You Enter Data Correctly?
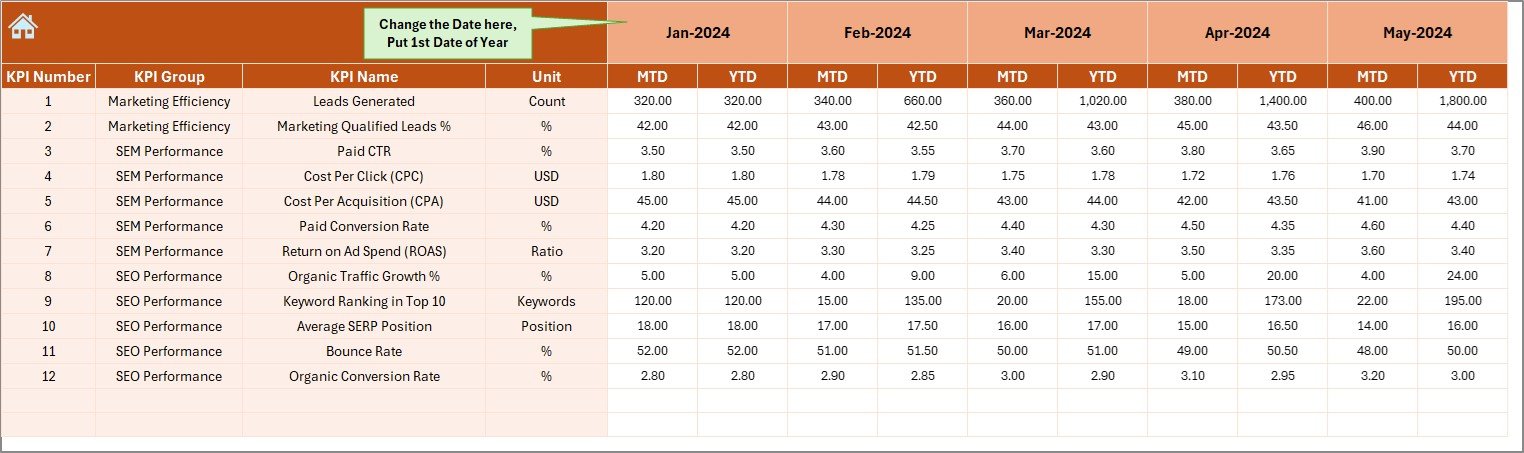
The Actual Numbers Input Sheet captures current year performance data.
Key Features
-
Users enter MTD and YTD actual values
-
Month selection is controlled from cell E1
-
Users must enter the first month of the year in E1
Because of this design, calculations remain accurate throughout the year.
Click to Purchases SEO and SEM Services KPI Dashboard in Excel
5) Target Sheet: How Are Goals Tracked?
The Target Sheet stores planned performance benchmarks.
What Users Enter
-
Monthly target MTD values
-
Monthly target YTD values
-
KPI-wise targets
As a result, the dashboard can clearly calculate Target vs Actual performance.
6) Previous Year Number Sheet: Why Is Historical Comparison Important?
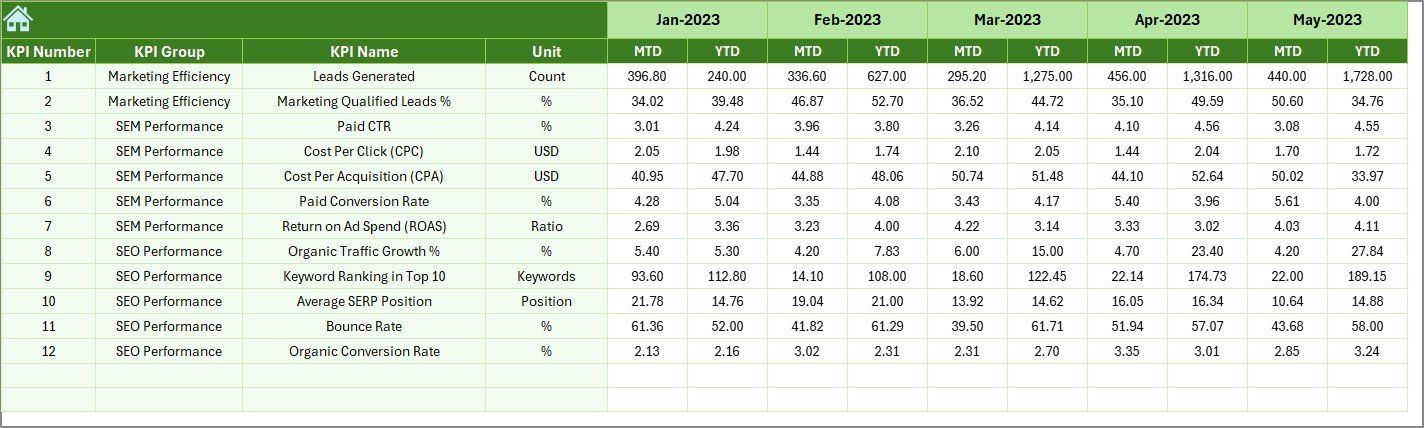
The Previous Year Number Sheet captures last year’s data.
Purpose of This Sheet
-
Enables year-over-year comparison
-
Highlights growth or decline
-
Supports long-term strategy evaluation
By comparing CY vs PY, teams can understand whether strategies deliver real improvements.
7) KPI Definition Sheet: Why Does KPI Standardization Matter?
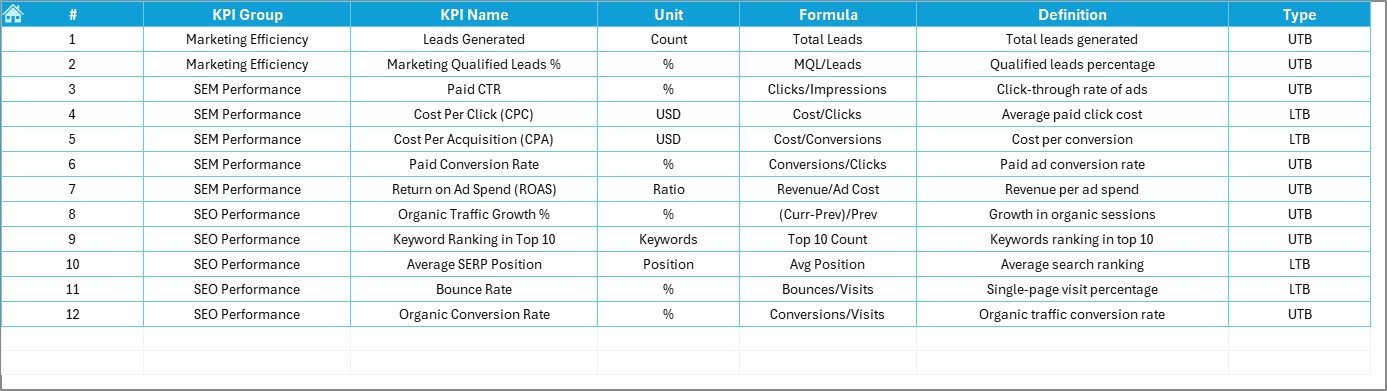
The KPI Definition Sheet defines each KPI clearly.
Fields Included
-
KPI Name
-
KPI Group
-
Unit
-
Formula
-
KPI Definition
Because of this sheet, all stakeholders interpret KPIs in the same way.
What KPIs Can Be Tracked in an SEO and SEM Dashboard?
This dashboard supports a wide range of SEO and SEM KPIs, such as:
-
Organic traffic
-
Keyword rankings
-
Click-through rate (CTR)
-
Cost per click (CPC)
-
Conversion rate
-
Leads generated
-
Paid search spend
-
Return on ad spend (ROAS)
You can easily extend the dashboard with additional KPIs as business needs grow.
Click to Purchases SEO and SEM Services KPI Dashboard in Excel
Advantages of SEO and SEM Services KPI Dashboard in Excel
Why Should Digital Marketing Teams Use This Dashboard?
📊 Centralized Performance View
All SEO and SEM KPIs stay in one place.
⏱ Faster Reporting
Monthly reports update instantly with new data.
🎯 Clear Target Tracking
MTD and YTD comparisons highlight performance gaps.
📈 Strong Trend Analysis
Trend charts reveal patterns and long-term results.
🔍 Improved Transparency
Clear KPI definitions reduce confusion.
💡 Better Decision-Making
Data-driven insights guide optimization strategies.
How Does This Dashboard Support Better SEO and SEM Decisions?
Because the dashboard shows actual vs target vs previous year, teams can:
-
Identify underperforming campaigns early
-
Reallocate budgets effectively
-
Optimize keywords and ads faster
-
Track ROI more accurately
As a result, marketing decisions become proactive instead of reactive.
Click to Purchases SEO and SEM Services KPI Dashboard in Excel
Best Practices for the SEO and SEM Services KPI Dashboard in Excel
How Can You Get the Best Results from This Dashboard?
✔ Keep KPI Definitions Consistent
Always maintain the same formulas and units.
✔ Update Data Regularly
Enter actual, target, and PY data on a fixed schedule.
✔ Review MTD and YTD Together
Short-term results should align with long-term goals.
✔ Use Conditional Formatting Actively
Focus immediately on KPIs showing negative trends.
✔ Train Team Members
Ensure everyone understands how to use the dashboard.
✔ Validate Data Before Review
Accurate input ensures reliable insights.
Who Can Benefit from an SEO and SEM KPI Dashboard in Excel?
This dashboard is ideal for:
-
Digital marketing agencies
-
SEO consultants
-
SEM specialists
-
Marketing managers
-
Growth teams
-
Business owners
Because it runs on Excel, it works for both small teams and large enterprises.
How Does This Dashboard Improve Marketing ROI?
The dashboard highlights which KPIs drive results and which consume budget without impact. Therefore, teams can optimize campaigns, reduce waste, and improve overall ROI.
Conclusion: Why Is an SEO and SEM Services KPI Dashboard in Excel Essential?
An SEO and SEM Services KPI Dashboard in Excel transforms scattered marketing data into clear, actionable insights. It simplifies performance tracking, strengthens accountability, and supports smarter campaign decisions.
By combining structured data input with interactive dashboards, this solution helps teams measure what matters, optimize continuously, and achieve sustainable digital growth.
In a results-driven marketing environment, this dashboard is not optional—it is essential.
Click to Purchases SEO and SEM Services KPI Dashboard in Excel
Frequently Asked Questions (FAQs)
What is the main purpose of an SEO and SEM KPI Dashboard in Excel?
It helps track, analyze, and compare SEO and SEM performance against targets and previous year results.
Do I need advanced Excel skills to use this dashboard?
No. Basic Excel knowledge is enough to enter data and review results.
Can I customize the KPIs?
Yes. You can add, remove, or modify KPIs easily.
How often should I update the dashboard?
Most teams update it monthly, but weekly updates also work.
Is this dashboard suitable for agencies?
Yes. Agencies can use it to track client-wise or campaign-wise performance.
Can this dashboard replace SEO tools?
No. It complements SEO tools by consolidating performance metrics into a single reporting view.
Click to Purchases SEO and SEM Services KPI Dashboard in Excel
Visit our YouTube channel to learn step-by-step video tutorials