Skill development missions play a vital role in building a future-ready workforce. Governments, training institutions, and development agencies invest heavily in upskilling initiatives. However, without clear performance tracking, even the best programs struggle to deliver results. That is exactly where a Skill Development Missions KPI Dashboard in Power BI becomes a powerful solution.
This detailed guide explains what a Skill Development Missions KPI Dashboard in Power BI is, why it matters, how it works, and how you can use it to improve outcomes. Moreover, you will learn about dashboard pages, KPIs, advantages, best practices, and frequently asked questions. By the end of this article, you will clearly understand how this dashboard transforms raw training data into actionable insights.
Click to buy Skill Development Missions KPI Dashboard in Power BI
What Is a Skill Development Missions KPI Dashboard in Power BI?
A Skill Development Missions KPI Dashboard in Power BI is a ready-to-use analytical dashboard designed to track and monitor key performance indicators related to skill development programs.
Instead of reviewing multiple Excel sheets and manual reports, this dashboard consolidates all KPI data into one interactive view. As a result, decision-makers can instantly understand performance trends, target achievement, and year-over-year progress.
Moreover, Power BI provides interactive slicers, drill-through options, and dynamic visuals. Therefore, users can analyze performance at both summary and detailed levels without technical effort.
Why Do Skill Development Missions Need a KPI Dashboard?
Skill development missions involve multiple stakeholders, programs, and targets. Because of this complexity, tracking performance manually becomes time-consuming and error-prone. Therefore, a KPI dashboard becomes essential.
Here is why organizations adopt a Skill Development Missions KPI Dashboard in Power BI:
- It centralizes all training and performance data
- It improves transparency and accountability
- It enables faster, data-driven decisions
- It highlights performance gaps early
- It supports continuous improvement
Moreover, when leadership sees accurate KPIs in real time, they can act quickly and confidently.
How Does a Skill Development Missions KPI Dashboard in Power BI Work?
The dashboard uses Excel as a data source and Power BI as the visualization layer. This structure ensures flexibility and ease of use.
You only need to update Excel sheets. After that, Power BI refreshes visuals automatically. As a result, reporting becomes simple, fast, and reliable.
What Are the Main Pages in the Skill Development Missions KPI Dashboard in Power BI?
This dashboard includes three structured pages, each serving a specific analytical purpose.
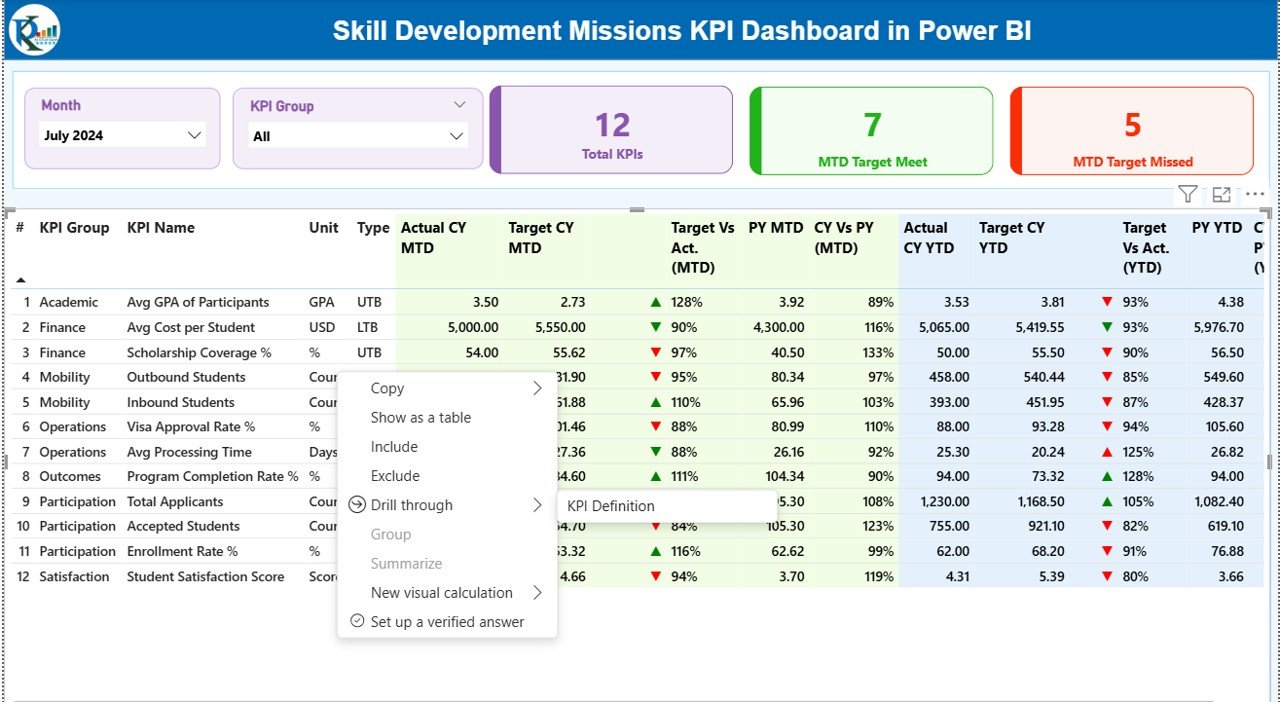
Summary Page
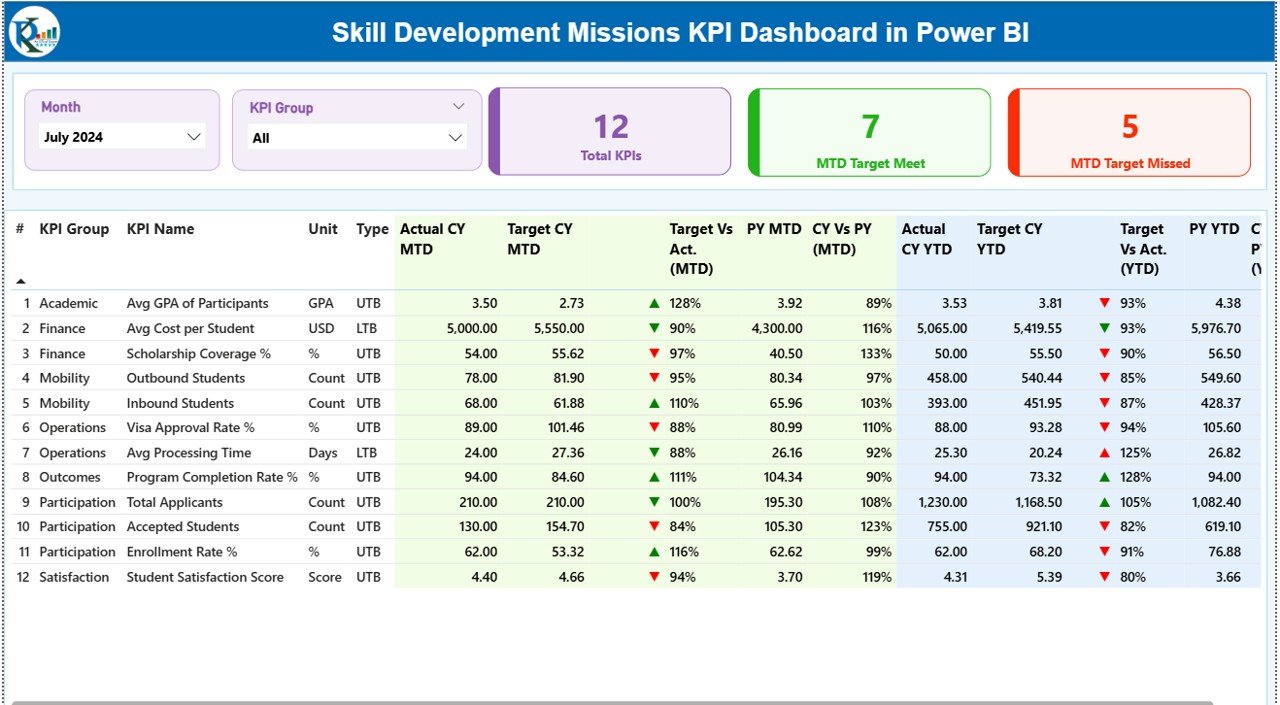
The Summary Page acts as the main control center of the dashboard.
Key Elements of the Summary Page
- Month Slicer at the top to select reporting month
- KPI Group Slicer to filter by category
- Three KPI Cards, showing:
Total KPIs Count
MTD Target Meet Count
MTD Target Missed Count
Because of these elements, users get a quick snapshot of overall performance.
Click to buy Skill Development Missions KPI Dashboard in Power BI
What Details Appear in the KPI Table on the Summary Page?
Below the cards, the dashboard displays a detailed KPI table. This table shows both MTD and YTD performance metrics clearly.
KPI Table Columns Explained
- KPI Number – Sequential identifier of each KPI
- KPI Group – Category or functional group
- KPI Name – Name of the performance metric
- Unit – Unit of measurement
- Type – KPI nature:
LTB (Lower the Better)
UTB (Upper the Better)
MTD Performance Columns
- Actual CY MTD – Current year actual MTD value
- Target CY MTD – Current year target MTD value
- MTD Icon – ▲ or ▼ icon with green or red color
- Target vs Actual (MTD) – Actual ÷ Target
- PY MTD – Previous year MTD value
- CY vs PY (MTD) – CY MTD ÷ PY MTD
YTD Performance Columns
- Actual CY YTD – Current year actual YTD value
- Target CY YTD – Current year target YTD value
- YTD Icon – Status indicator using arrows
- Target vs Actual (YTD) – Actual ÷ Target
- PY YTD – Previous year YTD value
- CY vs PY (YTD) – CY YTD ÷ PY YTD
Because of this structure, users can compare performance across time instantly.
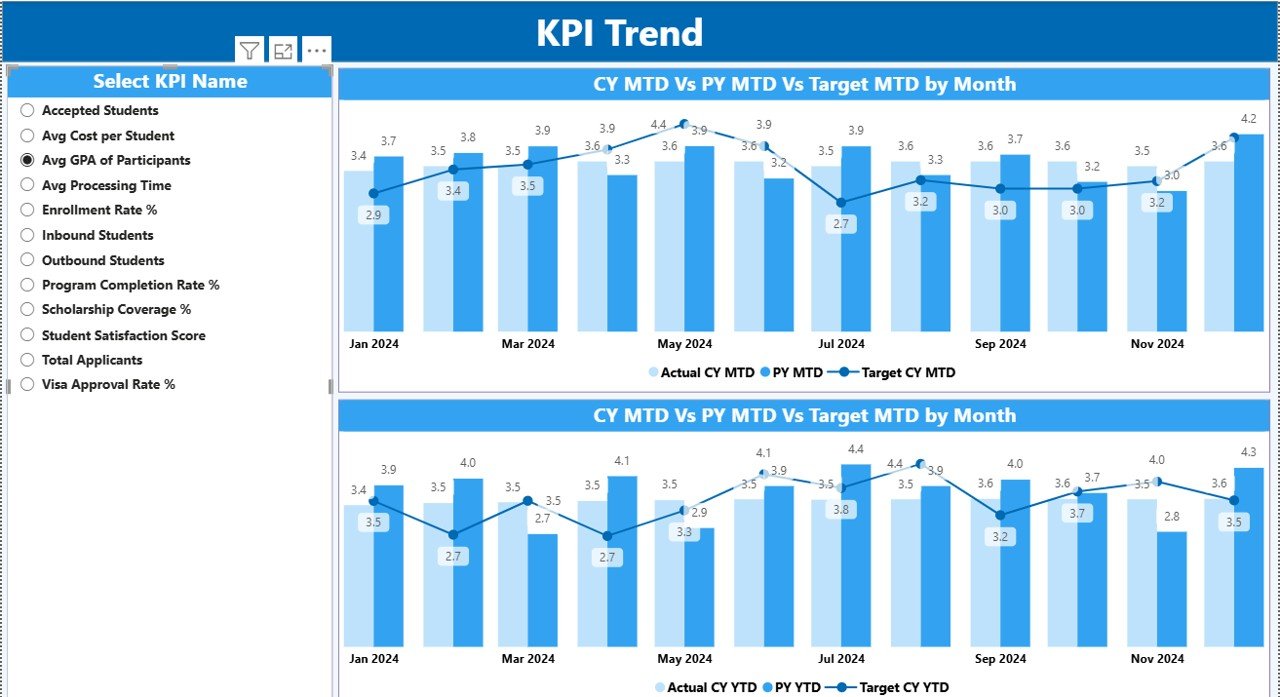
KPI Trend Page
The KPI Trend Page focuses on performance movement over time.
Key Features of the KPI Trend Page
- Two Combo Charts:
MTD Actual vs Target vs PY
YTD Actual vs Target vs PY
KPI Name Slicer on the left
By selecting a KPI, users can instantly see how performance evolves month by month. Therefore, trend analysis becomes simple and visual.
Click to buy Skill Development Missions KPI Dashboard in Power BI
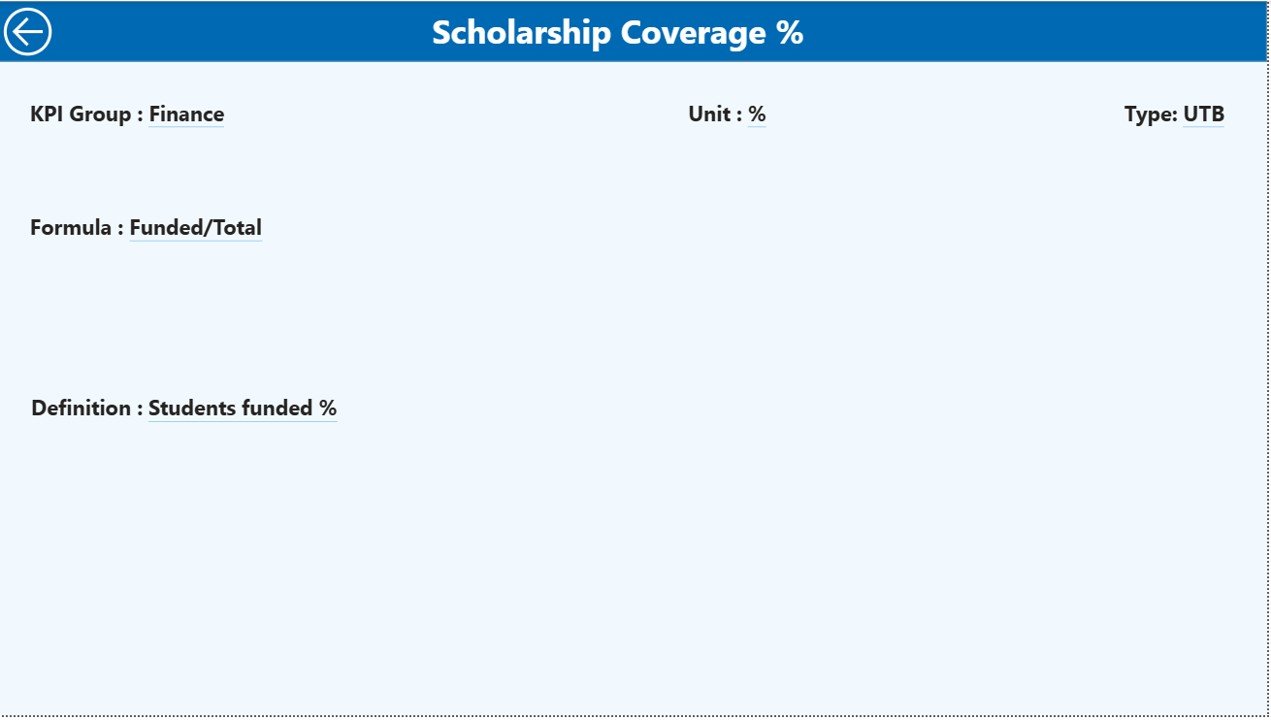
KPI Definition Page
The KPI Definition Page acts as a drill-through reference page.
What Does the KPI Definition Page Show?
- KPI Formula
- KPI Definition
- Unit and KPI Type
This page stays hidden by default. However, users can drill through from the Summary Page to view details. Moreover, a Back Button on the top-left allows easy navigation.
Because of this design, users always understand what each KPI means.
Click to buy Skill Development Missions KPI Dashboard in Power BI
What Excel Data Is Required for This Dashboard?
The Skill Development Missions KPI Dashboard in Power BI uses three Excel worksheets as its data source.
Input_Actual Sheet
This sheet stores actual performance data.
Columns in Input_Actual Sheet
- KPI Name
- Month (use the first date of the month)
- MTD Value
- YTD Value
Users only need to update actual numbers monthly. As a result, reporting stays consistent.
Click to buy Skill Development Missions KPI Dashboard in Power BI
Input_Target Sheet
This sheet stores planned or target values.
Columns in Input_Target Sheet
- KPI Name
- Month (use the first date of the month)
- MTD Target
- YTD Target
Because targets remain separate, performance comparison becomes accurate.
KPI Definition Sheet
This sheet defines each KPI clearly.
Columns in KPI Definition Sheet
- KPI Number
- KPI Group
- KPI Name
- Unit
- Formula
- Definition
- Type (LTB or UTB)
By maintaining this sheet, organizations ensure clarity and standardization.
What KPIs Can You Track in a Skill Development Missions Dashboard?
Organizations can track many KPIs depending on program goals.
Common Skill Development KPIs
- Enrollment Count
- Training Completion Rate
- Placement Rate
- Certification Success Rate
- Dropout Percentage
- Cost per Trainee
- Trainer Utilization Rate
- Program Coverage Ratio
Because the dashboard remains flexible, users can customize KPIs easily.
Advantages of Skill Development Missions KPI Dashboard in Power BI
A Skill Development Missions KPI Dashboard in Power BI offers several practical advantages.
- Clear Performance Visibility
The dashboard presents KPIs in a structured and visual way. Therefore, leaders understand performance instantly.
- Faster Decision-Making
Because data updates automatically, decisions no longer depend on delayed reports.
- Accurate Target Tracking
MTD and YTD comparisons help teams track progress against targets consistently.
- Improved Accountability
When KPIs stay visible, teams take ownership of results.
- Reduced Manual Effort
Excel updates replace manual reporting tasks. As a result, teams save time.
How Does Power BI Improve Skill Development Reporting?
Power BI adds strong analytical capabilities to skill development reporting.
- Interactive slicers improve analysis
- Drill-through pages add clarity
- Combo charts show trends clearly
- Visual indicators highlight performance status
Because of these features, reporting becomes more effective and engaging.
Best Practices for the Skill Development Missions KPI Dashboard in Power BI
To get the best results, organizations should follow proven practices.
- Define KPIs Clearly
Always maintain a clear KPI definition sheet. This avoids confusion later.
- Use Consistent Units
Ensure that KPI units remain consistent across actual and target data.
- Update Data Regularly
Monthly updates keep trends accurate and reliable.
- Use Meaningful KPI Groups
Group KPIs logically, such as Enrollment, Training, Placement, and Finance.
- Review Trends, Not Just Numbers
Always analyze trends instead of focusing on one month only.
How Can Decision-Makers Use This Dashboard Effectively?
Decision-makers can use this dashboard in many practical ways.
- Review monthly mission performance
- Identify underperforming programs
- Compare current year results with previous years
- Allocate resources based on KPI gaps
- Improve policy planning using data
Because of these uses, the dashboard supports both operational and strategic decisions.
How Is This Dashboard Different from Manual Excel Reports?
Manual Excel reports often create delays and errors. In contrast, this dashboard offers:
- Automation
- Real-time visuals
- Standardized KPIs
- Interactive exploration
Therefore, organizations move from static reports to dynamic insights.
Who Should Use a Skill Development Missions KPI Dashboard?
This dashboard suits many stakeholders.
- Government departments
- Skill development missions
- Training institutes
- NGOs and development agencies
- Program managers and analysts
Because of its flexibility, the dashboard adapts to different organizational needs.
Conclusion: Why Should You Use a Skill Development Missions KPI Dashboard in Power BI?
Skill development missions demand accuracy, transparency, and timely decisions. However, manual tracking limits performance visibility. A Skill Development Missions KPI Dashboard in Power BI solves this challenge effectively.
It centralizes data, simplifies analysis, and highlights performance gaps. Moreover, it enables faster decisions and continuous improvement. Therefore, organizations that adopt this dashboard gain better control over their skill development initiatives.
Frequently Asked Questions (FAQs)
What is a Skill Development Missions KPI Dashboard in Power BI?
It is a Power BI dashboard that tracks and analyzes KPIs related to skill development programs using Excel as a data source.
Can I customize KPIs in this dashboard?
Yes, you can easily add or modify KPIs by updating the KPI Definition and Excel input sheets.
How often should I update the Excel data?
You should update the data monthly to maintain accurate MTD and YTD analysis.
Do I need advanced Power BI skills to use this dashboard?
No, basic Power BI knowledge is enough because the dashboard is ready to use.
Can this dashboard support multiple programs?
Yes, by using KPI Groups and slicers, you can analyze multiple programs easily.
Does this dashboard support year-over-year comparison?
Yes, it includes both MTD and YTD comparisons with previous year data.
Click to buy Skill Development Missions KPI Dashboard in Power BI
Visit our YouTube channel to learn step-by-step video tutorials
Watch the step-by-step video tutorial: