The Smart Cities Development KPI Dashboard in Excel is a powerful, ready-to-use analytics template designed to help city planners, government agencies, and urban development teams monitor key performance metrics with clarity and speed. It turns complex smart city data into easy-to-understand visuals so users improve decisions, optimize infrastructure, and enhance citizen experience.
Click to buy Smart Cities Development KPI Dashboard in Excel
KEY FEATURES OF SMART CITIES DEVELOPMENT KPI DASHBOARD IN EXCEL
- 7-Sheet Structured Dashboard System with Summary, Dashboard, Trends, Inputs, Targets, Previous Year, and KPI Definitions.
- MTD & YTD Performance Tracking for every KPI with instant updates based on month filters.
- Actual vs Target vs Previous Year Analysis with clear conditional formatting arrows.
- Smart KPI Trend Charts for quick visual interpretation of progress.
- Easy Input Sheets for actual values, targets, and previous-year numbers.
- Full KPI Dictionary including KPI Group, Unit, Type, Formula & Definition.
- Ideal for Smart City Mission Teams, Urban Planners, Development Authorities, and Data Analysts.
Smart Cities Development KPI Dashboard in Excel — A Complete Guide to Smarter Urban Performance Tracking
Cities grow fast. Because of this rapid growth, government teams and urban planners must track hundreds of performance indicators every month. When they understand these metrics, they improve infrastructure, manage budgets better, enhance public services, and create a better experience for citizens. However, many organizations still track these KPIs manually, which slows down decision-making and hides important insights.
A Smart Cities Development KPI Dashboard in Excel solves these challenges. It turns raw data into clean visuals, trends, and comparisons. It provides the clarity that every smart city project team needs. Whether you track energy usage, water supply, waste management, mobility, safety, citizen satisfaction, or sustainability indicators—this dashboard gives you the complete picture.
In this guide, you will learn what the dashboard is, why it matters, how it works, and how every smart city can benefit from it.
What Is a Smart Cities Development KPI Dashboard in Excel?
A Smart Cities Development KPI Dashboard in Excel is a structured reporting tool that brings smart city performance indicators into one place. It helps teams evaluate progress, compare actual performance with targets, and understand trends across months and years.
Because the dashboard runs entirely in Excel, you don’t need complex software or technical skills. You open the file, enter your data, and the visual dashboard updates instantly.
The dashboard includes KPIs from multiple smart-city domains:
- Urban Mobility
- Water Management
- Energy Efficiency
- Waste Management
- Public Safety
- Digital Governance
- Sustainability
- Air Quality
- Citizen Services
This dashboard creates a single point of truth for every department. It supports faster decision-making and improves transparency.
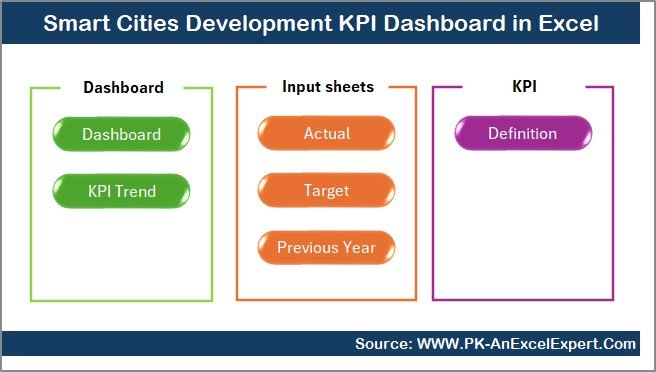
Structure of the Smart Cities Development KPI Dashboard
This Excel dashboard contains seven structured worksheets, each with a clear purpose. Below is a simple explanation of how each sheet works.
Summary Page
The Summary Page acts as the index of the entire dashboard. It contains six navigation buttons that jump directly to the major sheets. This makes it easy for new users and is ideal during review meetings.
You use this page to move smoothly across the dashboard instead of searching through tabs.
Click to buy Smart Cities Development KPI Dashboard in Excel
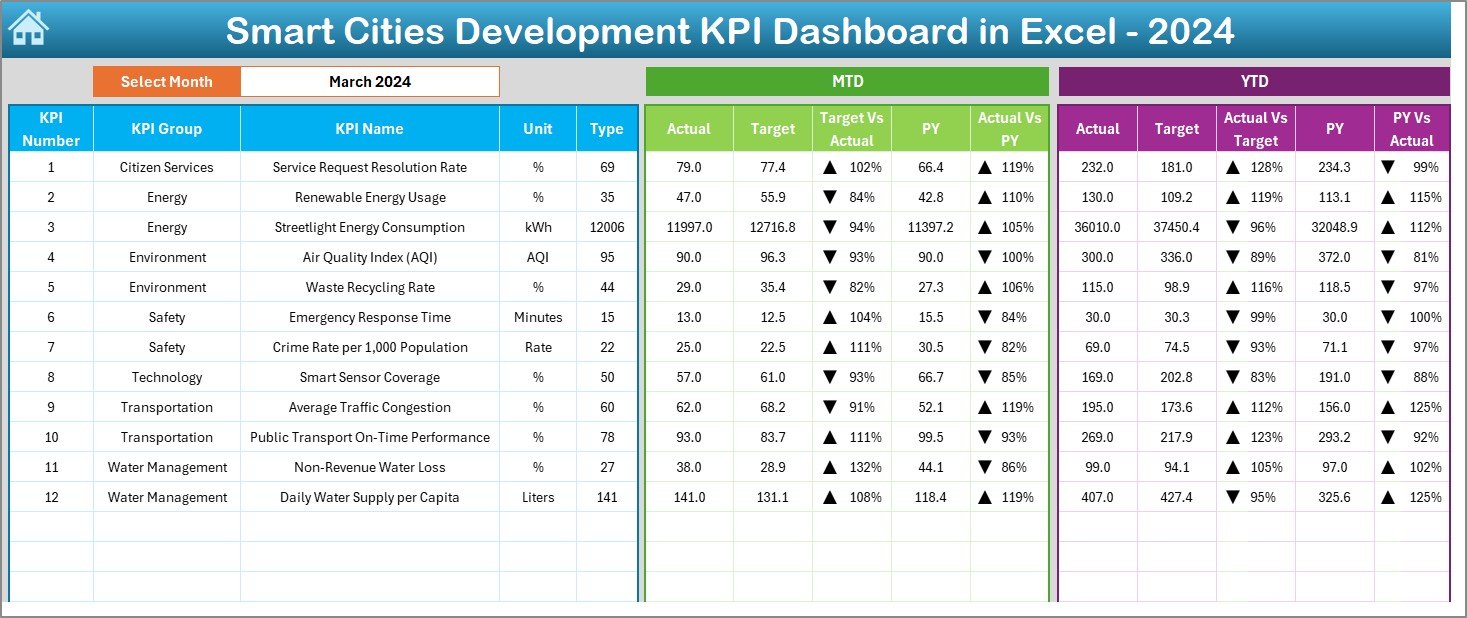
Dashboard Sheet
This is the main monitoring page. It shows all KPIs with MTD and YTD performance indicators.
You can select the Month from the dropdown in cell D3, and the entire dashboard updates instantly.
The page displays:
MTD Metrics
- Actual
- Target
- Previous Year
- Target vs Actual comparison
- Previous Year vs Actual comparison
- Up/Down arrows to show performance movement
YTD Metrics
- Actual
- Target
- Previous Year
- Target vs Actual comparison
- Previous Year vs Actual comparison
This page summarizes the health of smart city performance at a glance. Managers use this page during steering committee meetings and progress reviews.
Click to buy Smart Cities Development KPI Dashboard in Excel
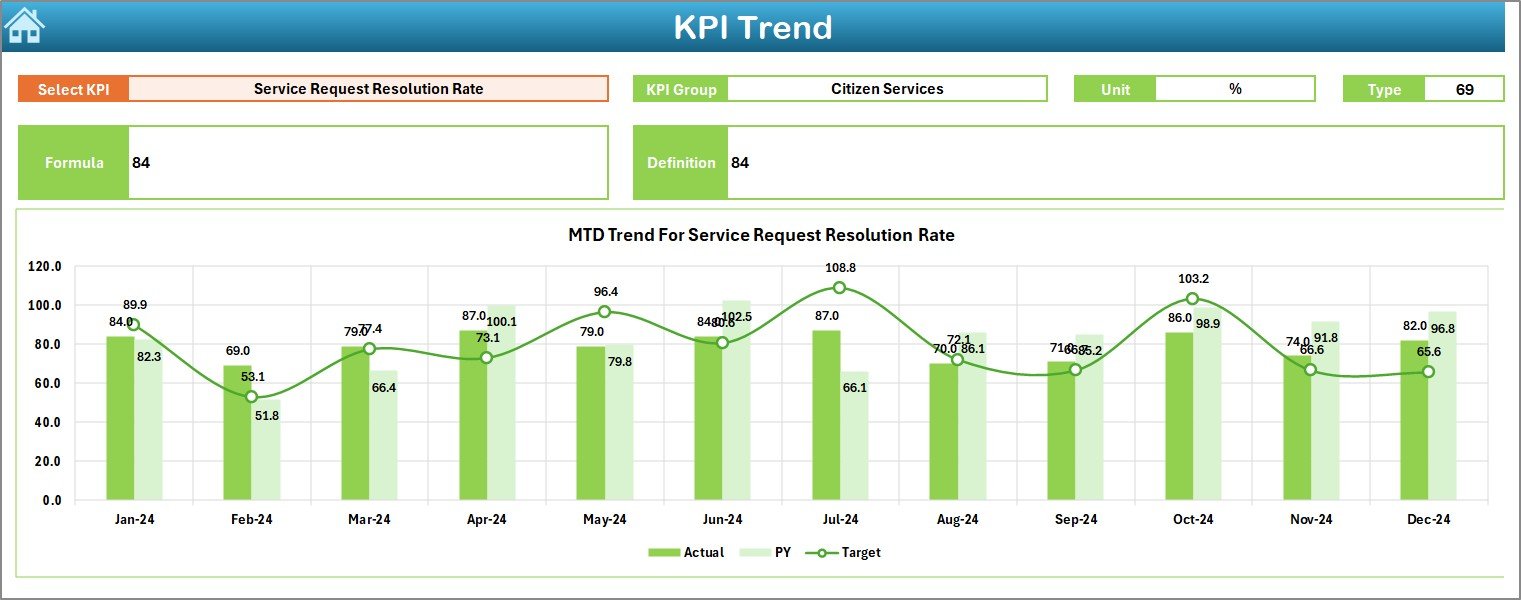
Trend Sheet
This sheet helps users understand the trend of each KPI across months.
You can select a KPI from the dropdown in Cell C3.
Once selected, the sheet displays:
- KPI Group
- Unit
- KPI Type (Upper the Better or Lower the Better)
- KPI Formula
- KPI Definition
- MTD Trend Chart
- YTD Trend Chart
Users track progress over time and evaluate if the city moves toward its development goals.
Click to buy Smart Cities Development KPI Dashboard in Excel
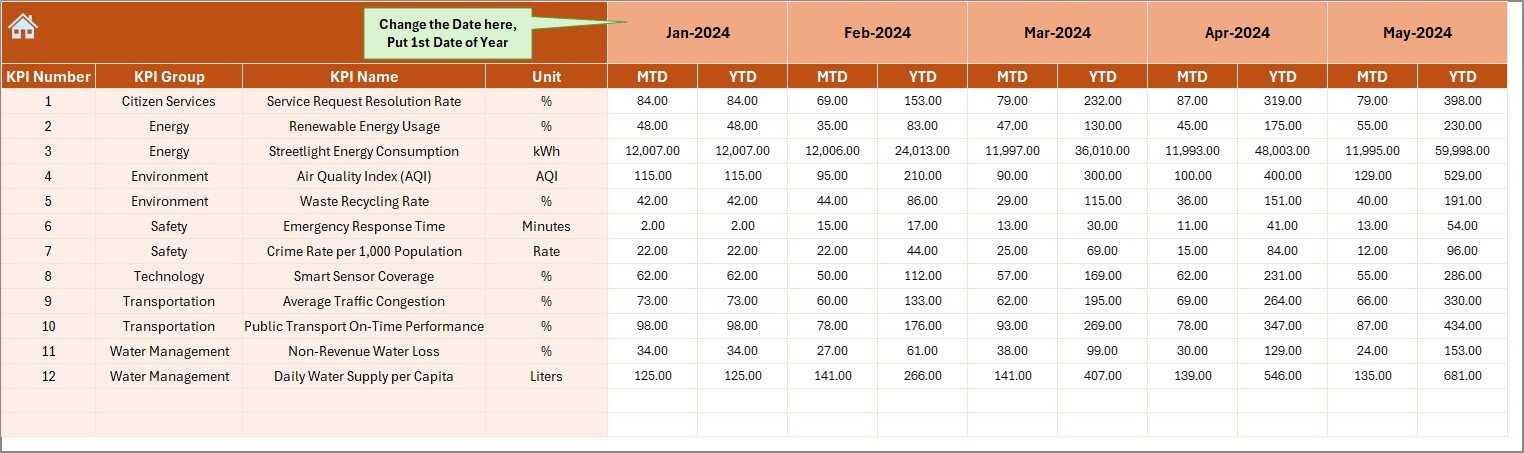
Actual Numbers Input Sheet
This sheet allows users to enter MTD and YTD actual numbers for each month.
You change the start month in Cell E1.
After that, the whole input sheet adjusts for the chosen year.
Urban development teams update this sheet every month before generating the dashboard.
Click to buy Smart Cities Development KPI Dashboard in Excel
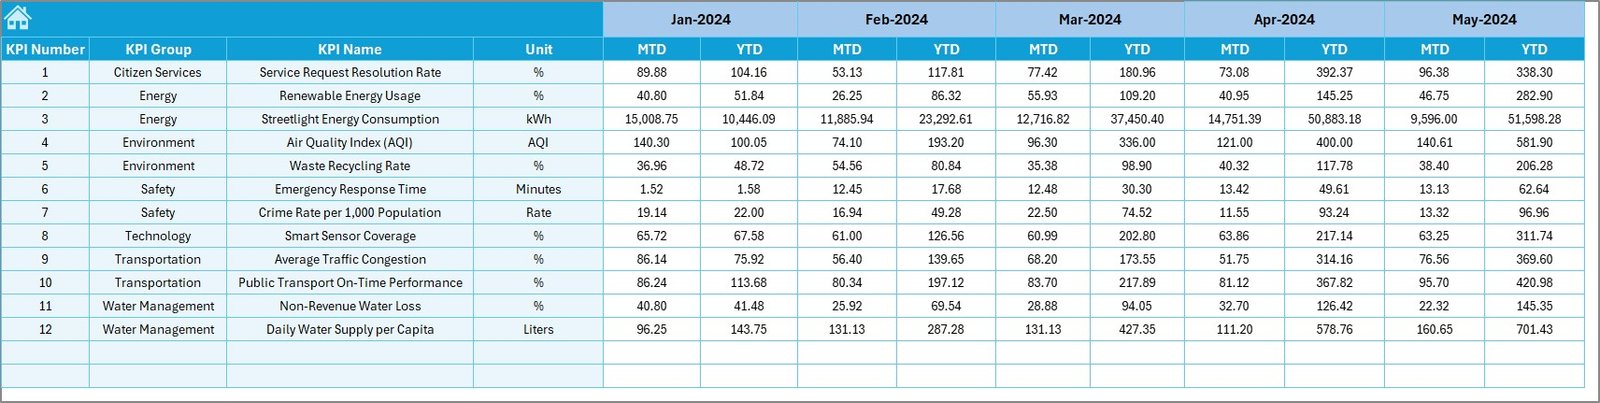
Target Sheet
This sheet captures monthly MTD and YTD targets for each KPI.
You enter targets for the entire year for all smart city indicators.
This ensures that the dashboard always compares performance accurately.
Click to buy Smart Cities Development KPI Dashboard in Excel
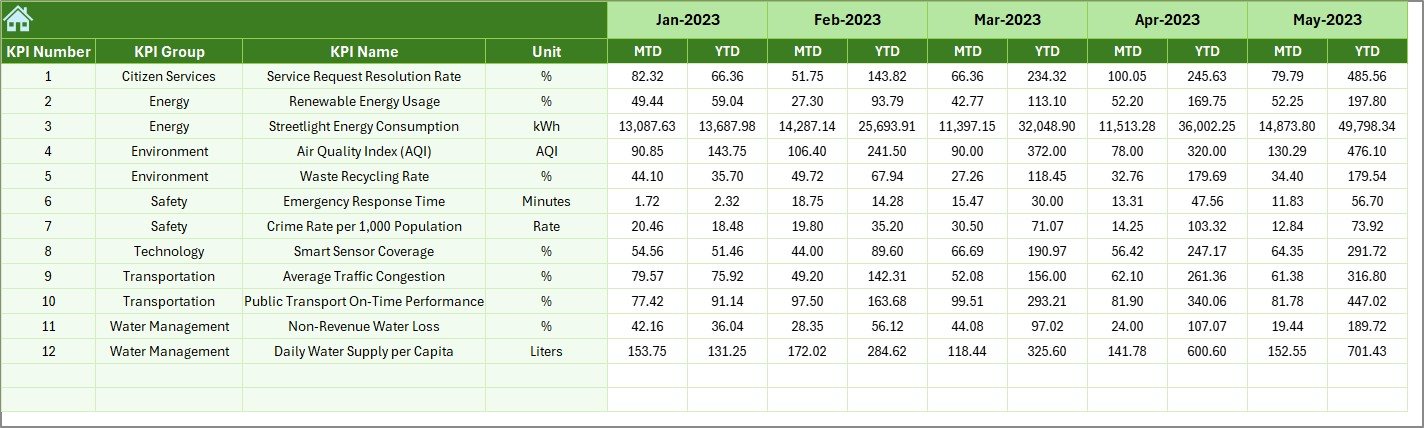
Previous Year Numbers Sheet
This sheet stores previous year’s actual values for every KPI.
This makes it easy to compare performance year-over-year and identify improvements.
Click to buy Smart Cities Development KPI Dashboard in Excel
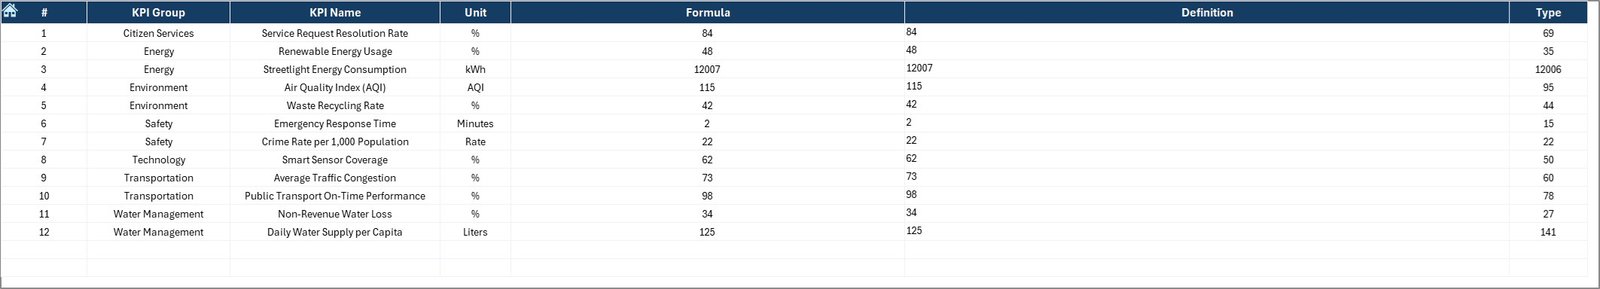
KPI Definition Sheet
This sheet acts as a knowledge base. It contains:
- KPI Name
- KPI Group
- Unit
- Formula
- KPI Definition
This helps new users understand every KPI clearly without needing external documents.
Click to buy Smart Cities Development KPI Dashboard in Excel
Why Do Smart Cities Need a KPI Dashboard?
Smart cities rely on data. When teams track the right indicators, they improve planning, reduce waste, and make better decisions. Because smart city data comes from many departments, it becomes difficult to manage without an automated dashboard.
Here are reasons why every smart city initiative needs this Excel dashboard:
- It brings all KPIs into one place
- It removes manual reporting errors
- It speeds up decision-making
- It supports transparency and accountability
- It enables quick comparison of actual vs target performance
- It shows long-term trends for planning
- It improves the efficiency of every department
Smart cities deal with complex datasets every month. This dashboard makes the process simple.
Which KPIs Can You Track in a Smart City Dashboard?
Smart cities monitor several categories of KPIs. Below are common examples:
Urban Mobility
- Traffic congestion index
- Average travel time
- Public transit ridership
- EV charging utilization
Water Management
- Water supply coverage
- Non-revenue water percentage
- Water quality index
Energy Efficiency
- Renewable energy usage
- Streetlight uptime
- Smart grid efficiency
Waste Management
- Waste collection efficiency
- Recycling percentage
- Landfill dependency
Public Safety
- Emergency response time
- Crime rate index
- CCTV coverage effectiveness
Digital Governance
- Online service completion rate
- Mobile app usage
- Citizen feedback resolution
Environmental Health
- Air quality index
- Green cover percentage
- Noise pollution levels
This dashboard supports all of these KPIs and more.
How This Dashboard Helps Smart City Teams Work Better
This Excel-based tool organizes everything in a simple, repeatable process. Because it uses structured worksheets, every department follows the same reporting method. As a result, city leaders receive clean and accurate reports every month.
The dashboard:
- Reduces reporting time
- Helps teams focus on insights
- Improves compliance with development plans
- Provides a clear comparison of performance
- Shows strengths and weaknesses in every segment
- Ensures that teams track the right indicators
Every smart city mission team benefits from using this tool daily.
Advantages of a Smart Cities Development KPI Dashboard in Excel
Centralized Data Management
The dashboard stores all performance indicators in one place, which reduces confusion between departments.
Immediate Visual Insights
Users quickly view MTD and YTD results with clear visuals and trend lines.
Better Target Tracking
Actual vs Target comparisons help teams measure if their smart city projects stay on track.
Improved Decision-Making
Clean charts allow leaders to take quick actions and remove delays.
Easy to Update
Users enter numbers in the input sheets, and Excel updates the visuals instantly.
No Special Software Needed
The dashboard runs entirely on Excel. Anyone can use it without technical training.
Transparent Monitoring
Stakeholders view consistent, standardized reporting across all urban development areas.
Best Practices for Using the Smart Cities KPI Dashboard
- Update data every month without delays
Timely updates help departments evaluate performance accurately.
- Enter clean and verified numbers
Accurate inputs lead to reliable KPI results.
- Define your KPIs clearly
Make sure every KPI includes a definition, formula, and unit for consistent understanding.
- Set realistic and measurable targets
Meaningful comparisons happen only when targets reflect ground reality.
- Review trend charts before making decisions
Trends reveal patterns that raw numbers do not show.
- Train all team members to use the dashboard
A shared reporting process improves transparency and consistency.
- Use the dashboard during review meetings
Visuals help stakeholders understand performance better than spreadsheets.
Who Should Use This Dashboard?
This Excel template serves many types of users:
- Smart City Mission teams
- Urban planning departments
- Project management units
- Municipal corporations
- Environmental departments
- Urban transport authorities
- IT and digital governance teams
- Consultants and analysts
Every team that works on city development can use this dashboard.
Conclusion
Smart cities succeed only when teams track the right performance indicators with accuracy and speed. The Smart Cities Development KPI Dashboard in Excel provides everything needed for structured reporting, performance evaluation, and urban planning. It keeps teams aligned with the city’s development goals and supports better decision-making with clean visuals and automated insights.
Whether you manage infrastructure, transport, environment, or digital governance, this dashboard becomes a valuable tool for your entire organization.
Frequently Asked Questions (FAQ)
- What is a Smart Cities KPI Dashboard in Excel?
It is a structured Excel tool that tracks key performance indicators across smart city functions like mobility, water, energy, safety, and governance. It helps teams measure performance using MTD and YTD comparisons and clear visuals.
- Who can use this dashboard?
Urban planners, government authorities, smart city mission teams, analysts, contractors, consultants, and monitoring units can use this dashboard.
- Do I need advanced Excel knowledge to use it?
No, you only enter numbers in the input sheets. The dashboard updates automatically.
- Which KPIs can I track with this tool?
You can track KPIs related to transport, safety, waste, water, environment, digital governance, sustainability, and more.
- Can I customize the KPIs?
Yes, you can change KPI names, units, groups, formulas, and definitions in the KPI Definition sheet.
- How does the month filter work?
You select a month from a dropdown, and the dashboard updates all visuals instantly.
- Is this template suitable for monthly reporting?
Yes, the dashboard is intentionally designed for detailed and accurate monthly reviews.
Visit our YouTube channel to learn step-by-step video tutorials
Watch the step-by-step video tutorial:
Click to buy Smart Cities Development KPI Dashboard in Excel