Modern smart cities run on data, transparency, and accountability. Every procurement decision directly affects public spending, service quality, compliance, and citizen trust. Therefore, city administrators must track procurement performance clearly and continuously. However, when procurement data remains scattered across spreadsheets, emails, and static reports, decision-makers lose visibility and control.
That is exactly where a Smart Cities Procurement Dashboard in Power BI becomes a powerful solution.
This in-depth and SEO-friendly guide explains what a Smart Cities Procurement Dashboard in Power BI is, why cities need it, how it works, its page structure, key metrics, advantages, best practices, and frequently asked questions. By the end of this article, you will clearly understand how this dashboard strengthens procurement governance in smart city environments.
Click to Purchases Smart Cities Procurement Dashboard in Power BI
What Is a Smart Cities Procurement Dashboard in Power BI?
A Smart Cities Procurement Dashboard in Power BI is a centralized business intelligence solution designed to monitor, analyze, and visualize procurement activities across city departments, procurement methods, requester teams, and time periods.
Instead of manually reviewing procurement files, city officials can use this dashboard to:
-
Track procurement compliance scores
-
Monitor in-progress purchase orders
-
Analyze negotiated savings
-
Review planned budgets by department and method
-
Identify procurement risks early
Moreover, because Power BI supports interactive visuals and slicers, users can explore procurement data dynamically and make faster, data-driven decisions.
Why Do Smart Cities Need a Procurement Dashboard?
Smart cities manage complex procurement ecosystems. Multiple departments, vendors, and procurement methods operate simultaneously. Therefore, city leaders need a unified view of procurement performance.
Key Challenges Without a Procurement Dashboard
Without a centralized dashboard, cities often face:
-
Limited visibility into compliance performance
-
Delays in identifying in-progress or stalled orders
-
Poor tracking of negotiated savings
-
Difficulty comparing procurement methods
-
Weak accountability across departments
As a result, costs increase, compliance risks grow, and governance weakens.
How a Power BI Procurement Dashboard Solves These Issues
A Smart Cities Procurement Dashboard in Power BI solves these challenges by:
-
Centralizing procurement data
-
Automating calculations and KPIs
-
Visualizing trends and variances clearly
-
Enabling quick drill-down analysis
-
Supporting transparency and audits
Therefore, city procurement teams gain clarity, speed, and control.
Click to Purchases Smart Cities Procurement Dashboard in Power BI
How Does a Smart Cities Procurement Dashboard in Power BI Work?
This dashboard connects procurement datasets to Power BI and transforms raw data into structured insights.
Typical Data Sources Include:
-
ERP or procurement systems
-
Purchase order databases
-
Vendor and contract records
-
Budget planning sheets
-
Compliance tracking files
After data integration, Power BI calculates KPIs, builds visuals, and allows interactive analysis using slicers such as city, department, procurement method, or month.
What Pages Are Included in a Smart Cities Procurement Dashboard in Power BI?
This Smart Cities Procurement Dashboard includes five professionally designed pages, each serving a specific analytical purpose.
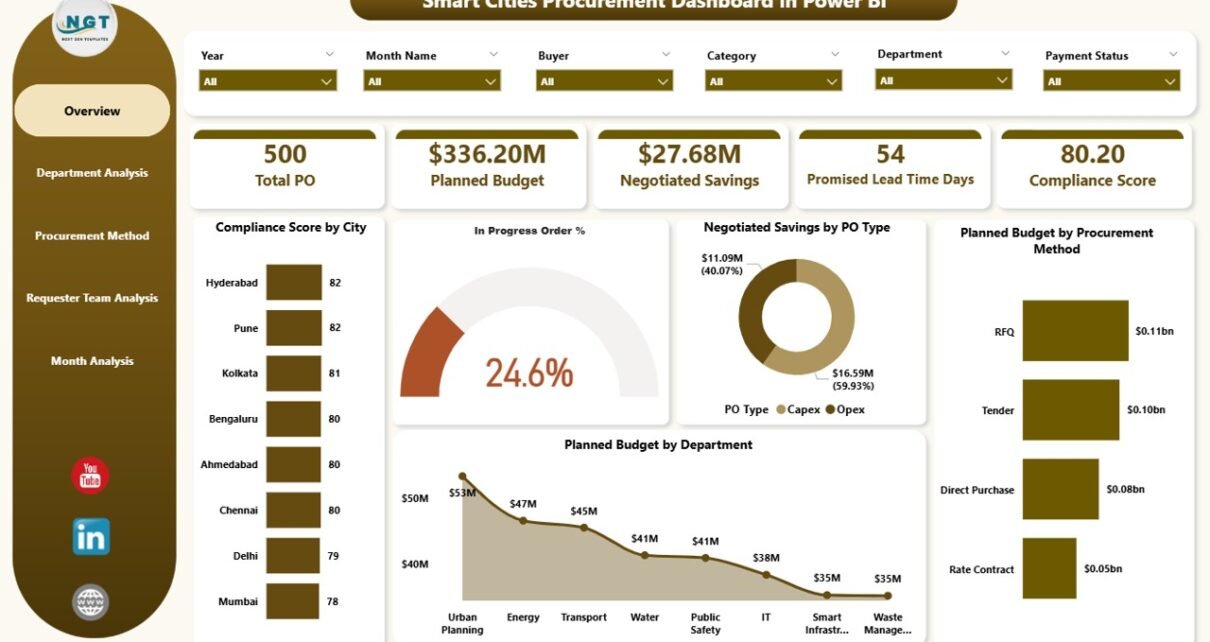
1. What Does the Overview Page Show?
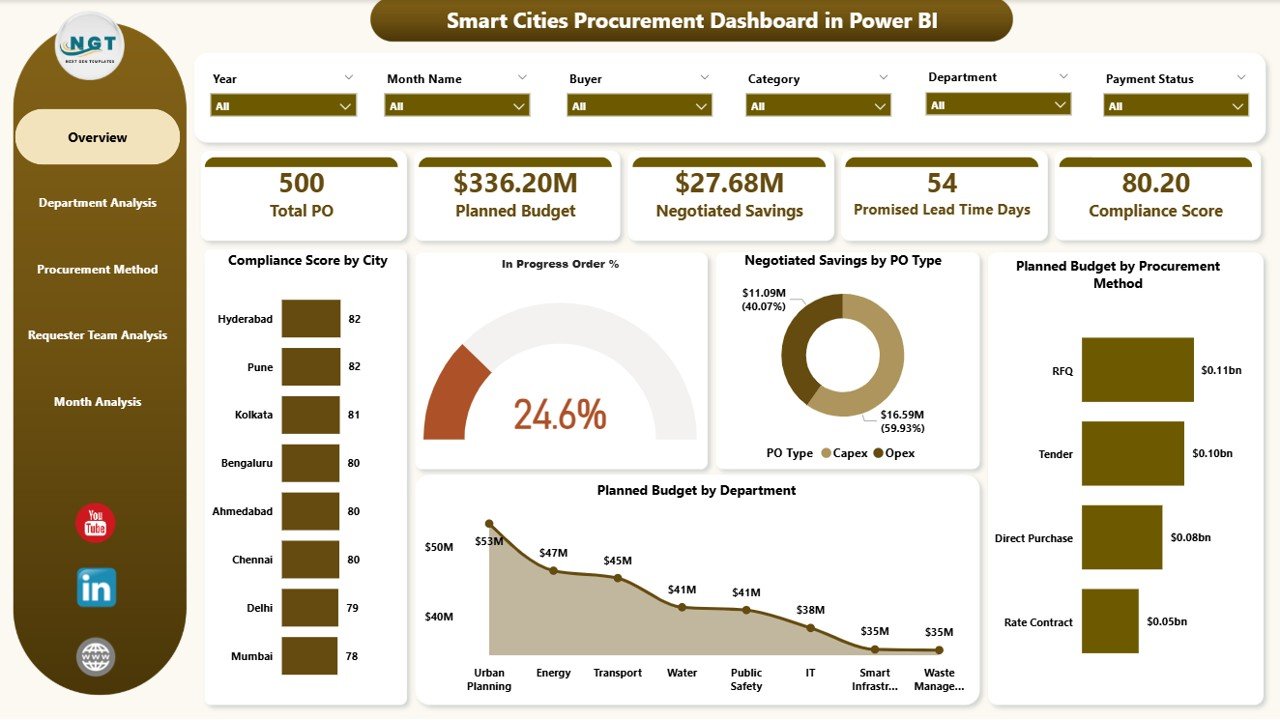
The Overview Page serves as the main entry point of the dashboard. It provides a high-level summary of procurement performance across the city.
Key Elements on the Overview Page
Slicers (Filters):
-
City
-
Department
-
Procurement Method
-
Time period
KPI Cards:
-
Compliance Score
-
In-Progress Order %
-
Negotiated Savings
-
Planned Budget
Charts on the Overview Page:
-
Compliance Score by City
-
In-Progress Order %
-
Negotiated Saving by PO Type
-
Planned Budget by Procurement Method
-
Planned Budget by Department
Why the Overview Page Matters
This page helps city leaders instantly understand procurement health. Moreover, it highlights problem areas that require deeper analysis.
2. How Does the Department Analysis Page Help?
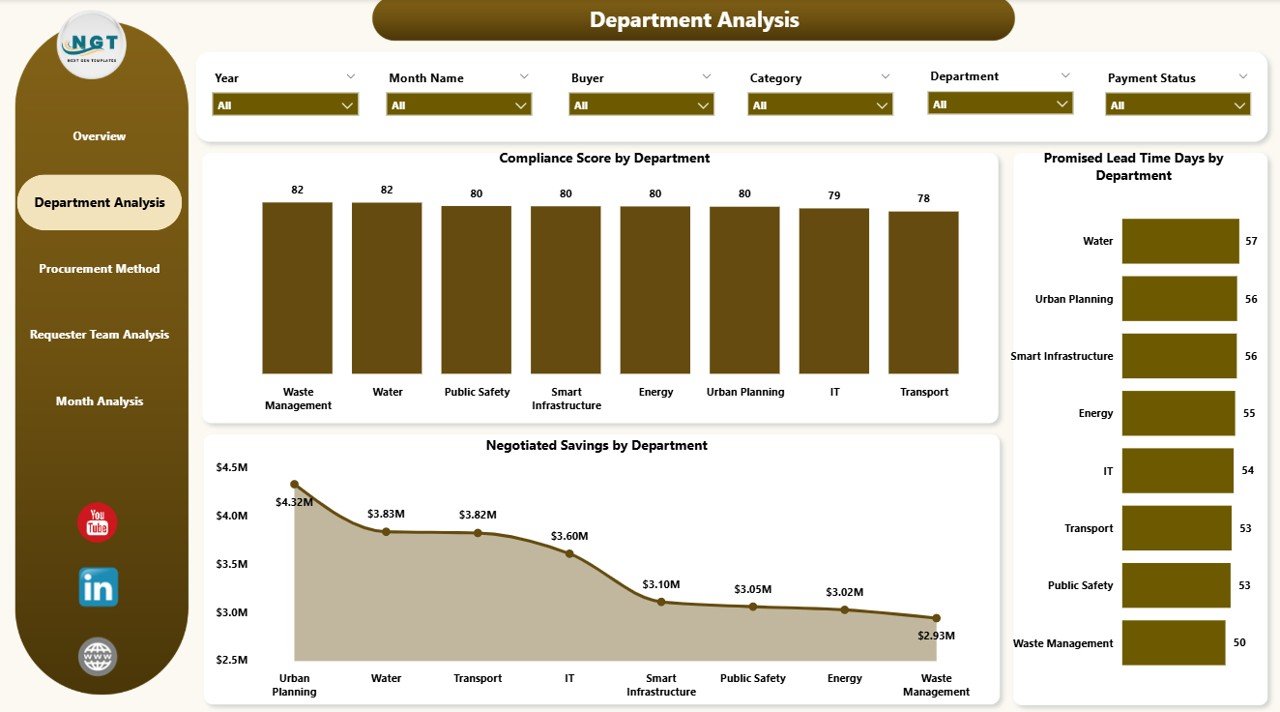
The Department Analysis Page focuses on procurement performance at the departmental level.
Charts on the Department Analysis Page
-
Compliance Score by Department
-
Promised Lead Time Days by Department
-
Negotiated Saving by Department
Benefits of Department Analysis
This page allows city administrators to:
-
Compare departments objectively
-
Identify compliance gaps
-
Monitor lead time efficiency
-
Track savings contribution by department
Therefore, departments become more accountable and performance-driven.
3. Why Analyze Procurement Methods Separately?
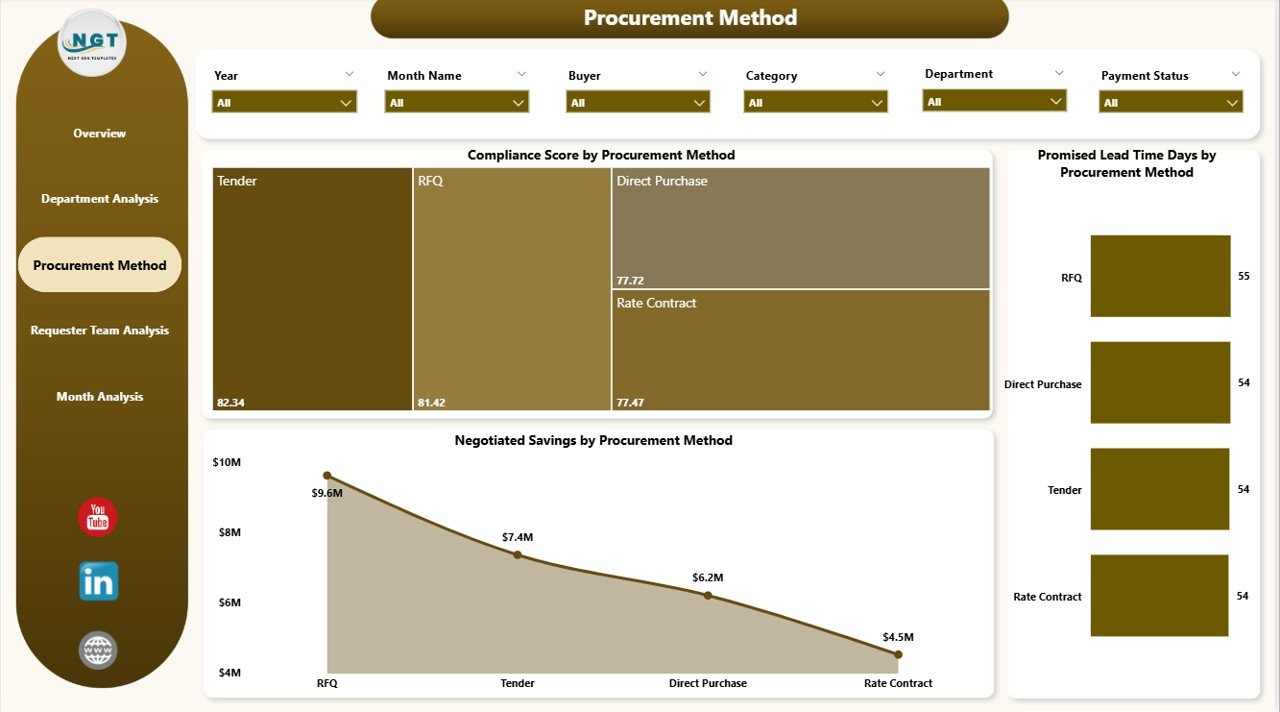
Different procurement methods produce different outcomes. Therefore, cities must evaluate their effectiveness.
The Procurement Method Analysis Page delivers this insight clearly.
Charts on the Procurement Method Page
-
Compliance Score by Procurement Method
-
Promised Lead Time Days by Procurement Method
-
Negotiated Saving by Procurement Method
Insights Gained from This Page
Using this page, procurement teams can:
-
Identify the most compliant procurement methods
-
Compare lead times across methods
-
Understand which methods generate higher savings
As a result, cities can optimize procurement strategies and policies.
4. What Is the Purpose of Requester Team Analysis?
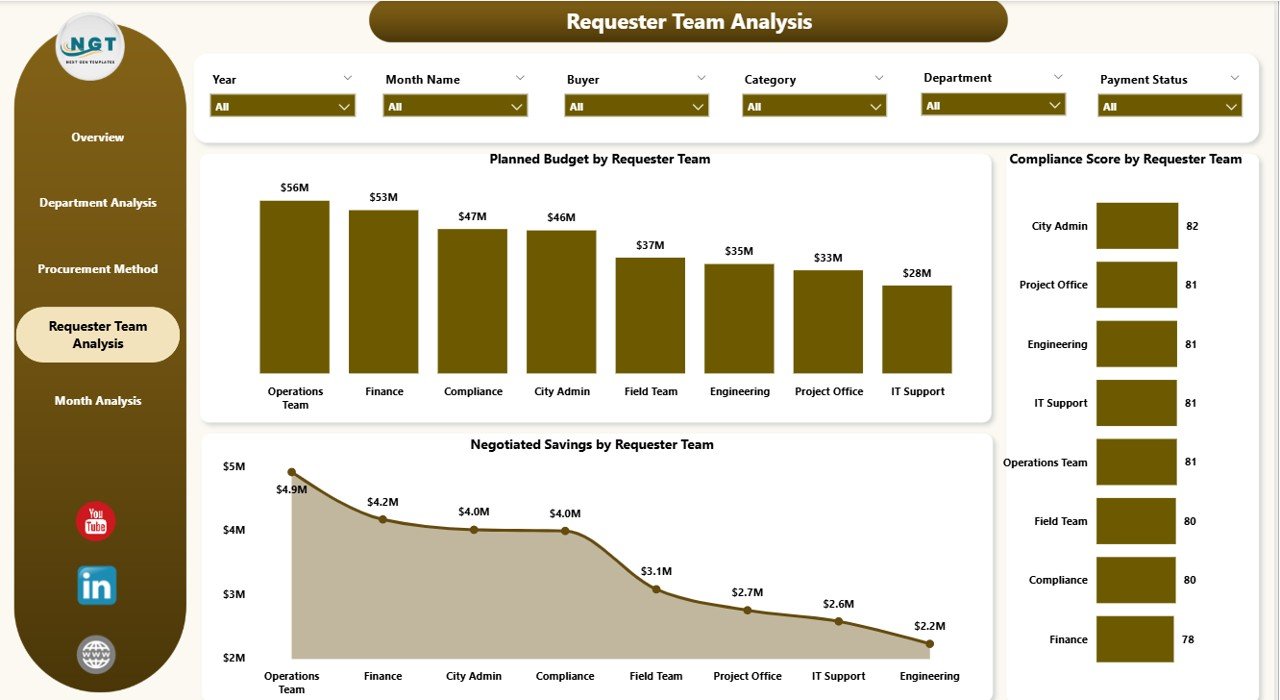
Requester teams initiate procurement requests. Therefore, their behavior directly impacts procurement efficiency.
The Requester Team Analysis Page evaluates performance at the request-initiation level.
Charts on the Requester Team Analysis Page
-
Planned Budget by Requester Team
-
Compliance Score by Requester Team
-
Negotiated Saving by Requester Team
Why This Page Is Important
This page helps cities:
-
Identify high-risk requester teams
-
Improve procurement discipline
-
Encourage responsible budget planning
-
Promote compliance awareness
Consequently, procurement performance improves from the ground up.
Click to Purchases Smart Cities Procurement Dashboard in Power BI
5. How Do Monthly Trends Improve Decision-Making?
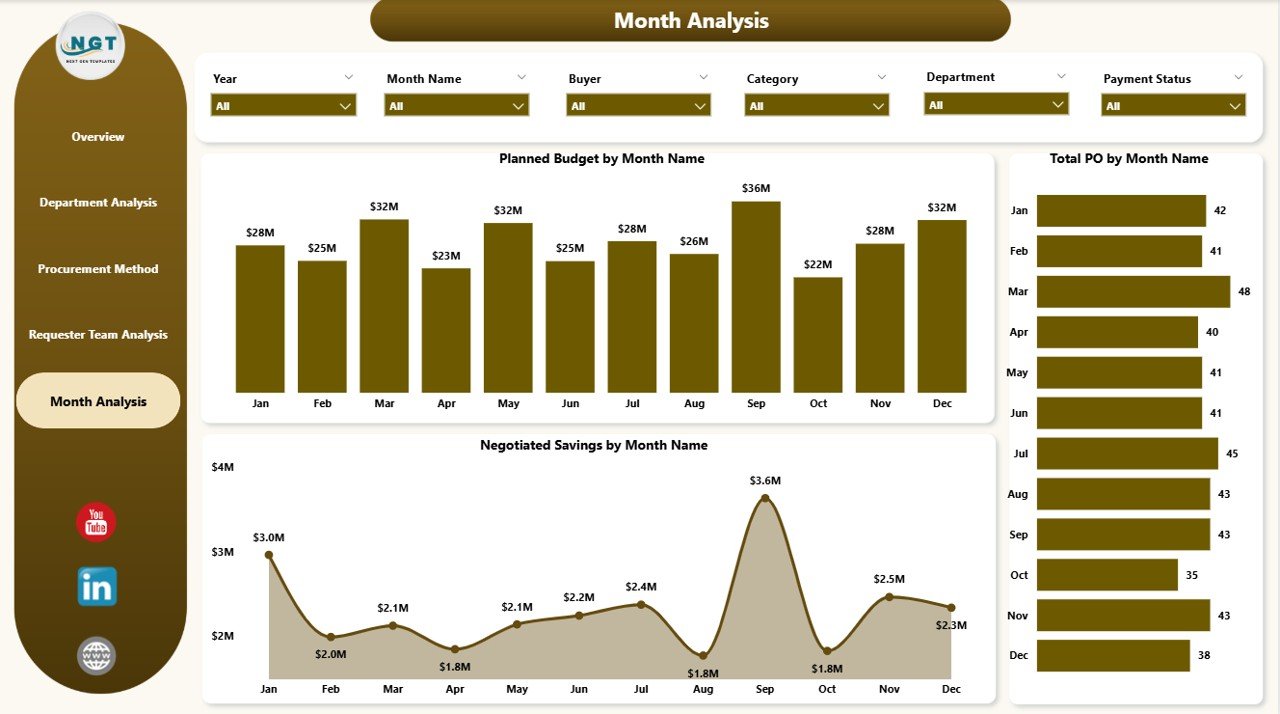
The Monthly Trends Page tracks procurement performance over time.
Charts on the Monthly Trends Page
-
Planned Budget by Month
-
Total Purchase Orders by Month
-
Negotiated Saving by Month
Value of Monthly Trend Analysis
With this page, decision-makers can:
-
Identify seasonal procurement patterns
-
Track budget utilization trends
-
Measure savings growth over time
-
Forecast future procurement needs
Therefore, cities can plan budgets and resources more effectively.
What Are the Key KPIs in a Smart Cities Procurement Dashboard?
This dashboard tracks critical procurement KPIs, including:
-
Compliance Score
-
In-Progress Order %
-
Promised Lead Time (Days)
-
Negotiated Savings
-
Planned Budget
-
Total Purchase Orders
These KPIs ensure procurement transparency, efficiency, and accountability.
Advantages of Smart Cities Procurement Dashboard in Power BI
A Smart Cities Procurement Dashboard in Power BI delivers measurable benefits across governance, finance, and operations.
1. Improved Transparency and Accountability
Because data remains centralized and visual, stakeholders can track procurement performance openly and consistently.
2. Faster and Better Decision-Making
Interactive visuals allow instant drill-downs. Therefore, leaders make informed decisions without delays.
3. Enhanced Compliance Monitoring
Clear compliance metrics highlight risks early. As a result, cities reduce audit issues and regulatory penalties.
4. Better Budget Control
Planned budget analysis prevents overspending and improves fiscal discipline.
5. Optimized Procurement Strategies
Procurement method analysis helps cities choose the most effective approaches.
6. Increased Negotiated Savings
By tracking savings clearly, procurement teams improve negotiation strategies and outcomes.
Who Can Benefit from a Smart Cities Procurement Dashboard?
This dashboard supports multiple stakeholders, including:
-
City Administrators
-
Procurement Managers
-
Finance and Budget Teams
-
Compliance and Audit Officers
-
Smart City Program Leaders
-
Policy Makers
Each role gains tailored insights without complex technical skills.
Best Practices for the Smart Cities Procurement Dashboard in Power BI
To maximize dashboard value, cities should follow these proven best practices.
1. Standardize Procurement Data
Always use consistent naming conventions, categories, and formats across departments.
2. Define Clear KPIs
Align KPIs with city procurement goals and compliance standards.
3. Use Slicers Wisely
Provide slicers for city, department, procurement method, and time to improve usability.
4. Update Data Regularly
Schedule frequent data refreshes to maintain accuracy and relevance.
5. Train Stakeholders
Ensure users understand how to interpret visuals and KPIs correctly.
6. Monitor Trends Continuously
Use monthly trends to detect risks early and adjust strategies quickly.
How Does This Dashboard Support Smart City Goals?
Smart cities focus on transparency, efficiency, sustainability, and citizen trust. This procurement dashboard directly supports those goals by:
-
Improving governance
-
Enhancing fiscal responsibility
-
Reducing procurement risks
-
Strengthening compliance frameworks
-
Enabling data-driven policies
Therefore, procurement transforms from an administrative function into a strategic advantage.
Conclusion: Why Every Smart City Needs a Procurement Dashboard in Power BI
A Smart Cities Procurement Dashboard in Power BI empowers cities to manage procurement with clarity, confidence, and control. It replaces manual reporting with automated insights, improves transparency, and strengthens governance.
By using this dashboard, city leaders can monitor compliance, optimize budgets, improve procurement efficiency, and build public trust. In a data-driven urban future, such dashboards are no longer optional—they are essential.
Frequently Asked Questions (FAQs)
What is a Smart Cities Procurement Dashboard in Power BI?
It is an interactive analytics dashboard that tracks and visualizes city procurement performance using Power BI.
Can this dashboard work with existing procurement systems?
Yes. Power BI connects easily with ERP systems, databases, and Excel files.
Is Power BI suitable for government and public sector use?
Yes. Power BI supports security, scalability, and compliance required by public institutions.
How often should procurement data be updated?
Ideally, cities should update procurement data daily or weekly for accurate monitoring.
Can non-technical users use this dashboard?
Yes. The dashboard uses simple visuals, slicers, and intuitive navigation.
Does this dashboard support audits and compliance reviews?
Absolutely. Clear KPIs and historical trends make audits faster and more transparent.
Visit our YouTube channel to learn step-by-step video tutorials


