In today’s world, solar energy stands at the heart of the renewable revolution. As the demand for clean, sustainable, and affordable energy rises, solar businesses, energy consultants, and project managers must rely on accurate data to make informed decisions. That’s where the Solar Energy KPI Scorecard in Excel comes in — a powerful, ready-to-use template that tracks every vital performance metric of solar operations.
This article explores everything you need to know about this Excel-based scorecard — its structure, key features, advantages, best practices, and frequently asked questions. Whether you’re managing a solar power plant, monitoring rooftop installations, or analyzing performance trends, this guide will help you get the most out of your solar data.
Click to Purchases Solar Energy KPI Scorecard in Excel
☀️ What Is a Solar Energy KPI Scorecard in Excel?
A Solar Energy KPI Scorecard is a structured Excel-based tool that measures the performance of key solar energy metrics — from energy generation and utilization to maintenance efficiency and cost-effectiveness. It allows you to visualize, compare, and analyze performance data in a single, easy-to-read dashboard.
Instead of working through multiple spreadsheets or complex software, this scorecard brings clarity, transparency, and automation to your solar performance tracking. It’s suitable for solar farms, renewable energy consultants, and companies managing multiple solar projects.
With this scorecard, you can:
-
Track performance across months, quarters, and years.
-
Compare Actual vs Target vs Previous Year (PY) data.
-
Visualize KPIs using color-coded indicators and trend charts.
-
Identify underperforming panels or sites.
-
Make data-driven operational and financial decisions.
📊 Structure of the Solar Energy KPI Scorecard in Excel
The Solar Energy KPI Scorecard template includes four main worksheets that together form a complete performance monitoring system. Let’s explore each one in detail.
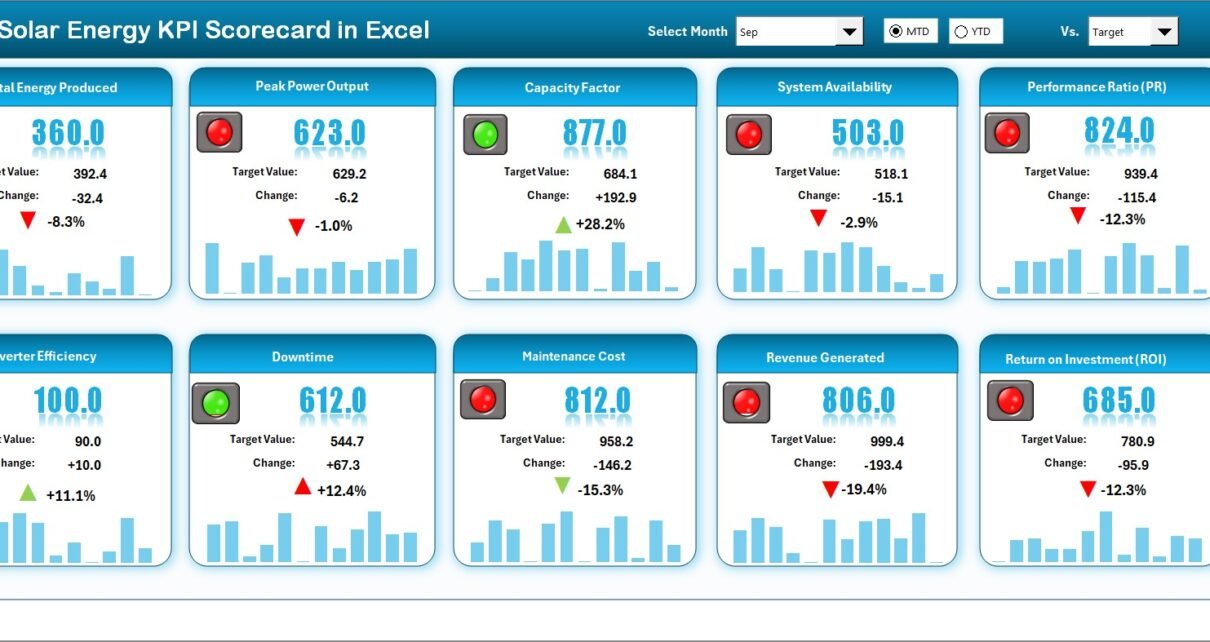
1. Scorecard Sheet (Main Dashboard)
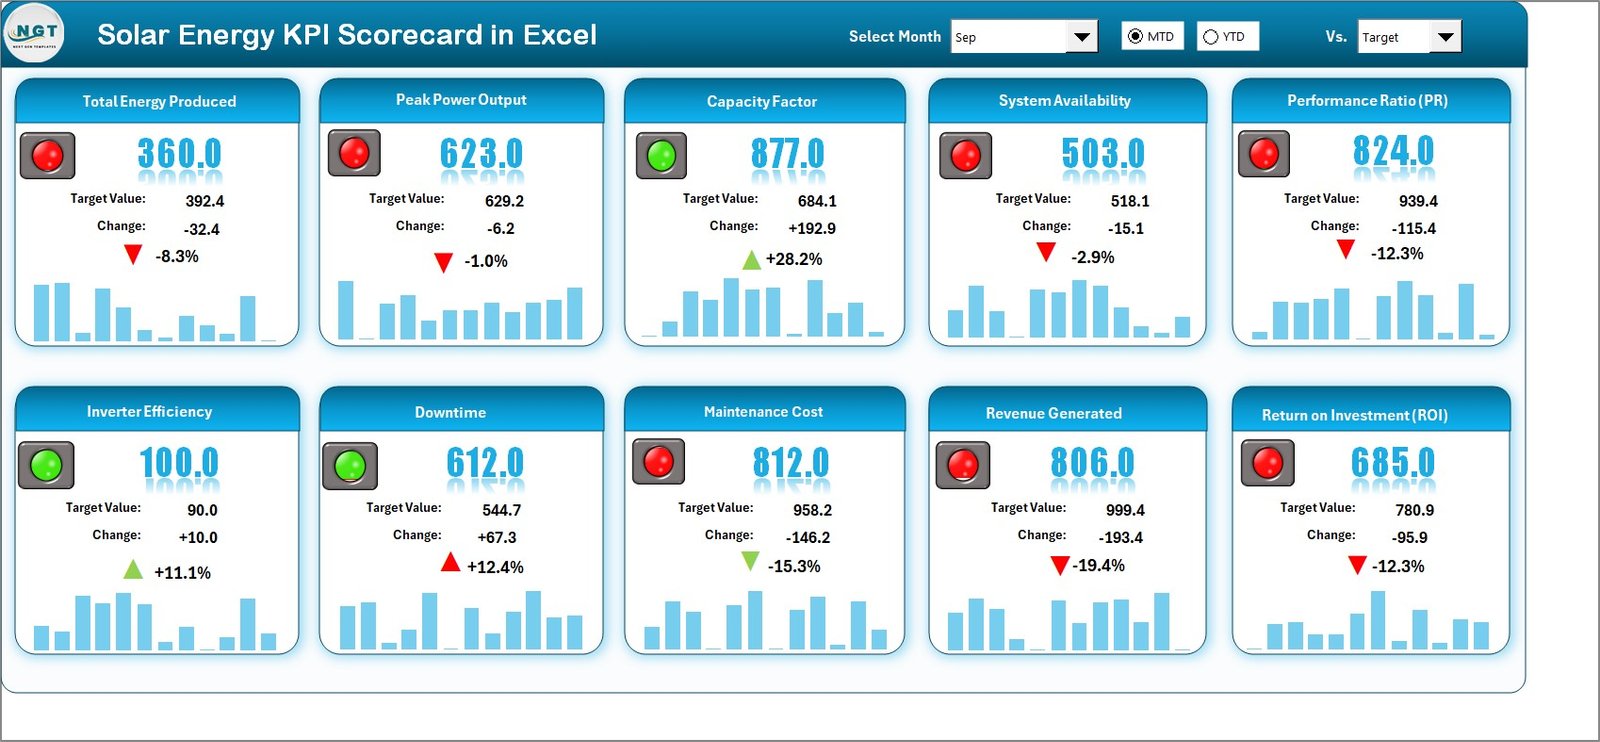
This is the central interface of the scorecard and serves as the control panel for monitoring solar energy KPIs. Everything you need — from dropdown selectors to KPI visuals — is available here.
🔑 Key Features:
-
Dropdown Menus: Choose the desired month, and toggle between MTD (Month-to-Date) and YTD (Year-to-Date) performance views.
-
Actual vs Target Values: Compare how your solar systems are performing against the set benchmarks.
-
Visual Indicators: Quickly identify performance status using color codes — 🟢 Green (Target Achieved), 🟡 Yellow (Close to Target), 🔴 Red (Below Target).
-
Comprehensive KPI Overview: Instantly view all essential metrics, including generation, efficiency, downtime, and cost.
-
Performance Summary Cards: Present top-level metrics such as Total Energy Generated (kWh), Conversion Efficiency (%), and System Availability (%).
This page transforms data into insight — enabling decision-makers to act fast.
Click to Purchases Solar Energy KPI Scorecard in Excel
2. KPI Trend Sheet Tab
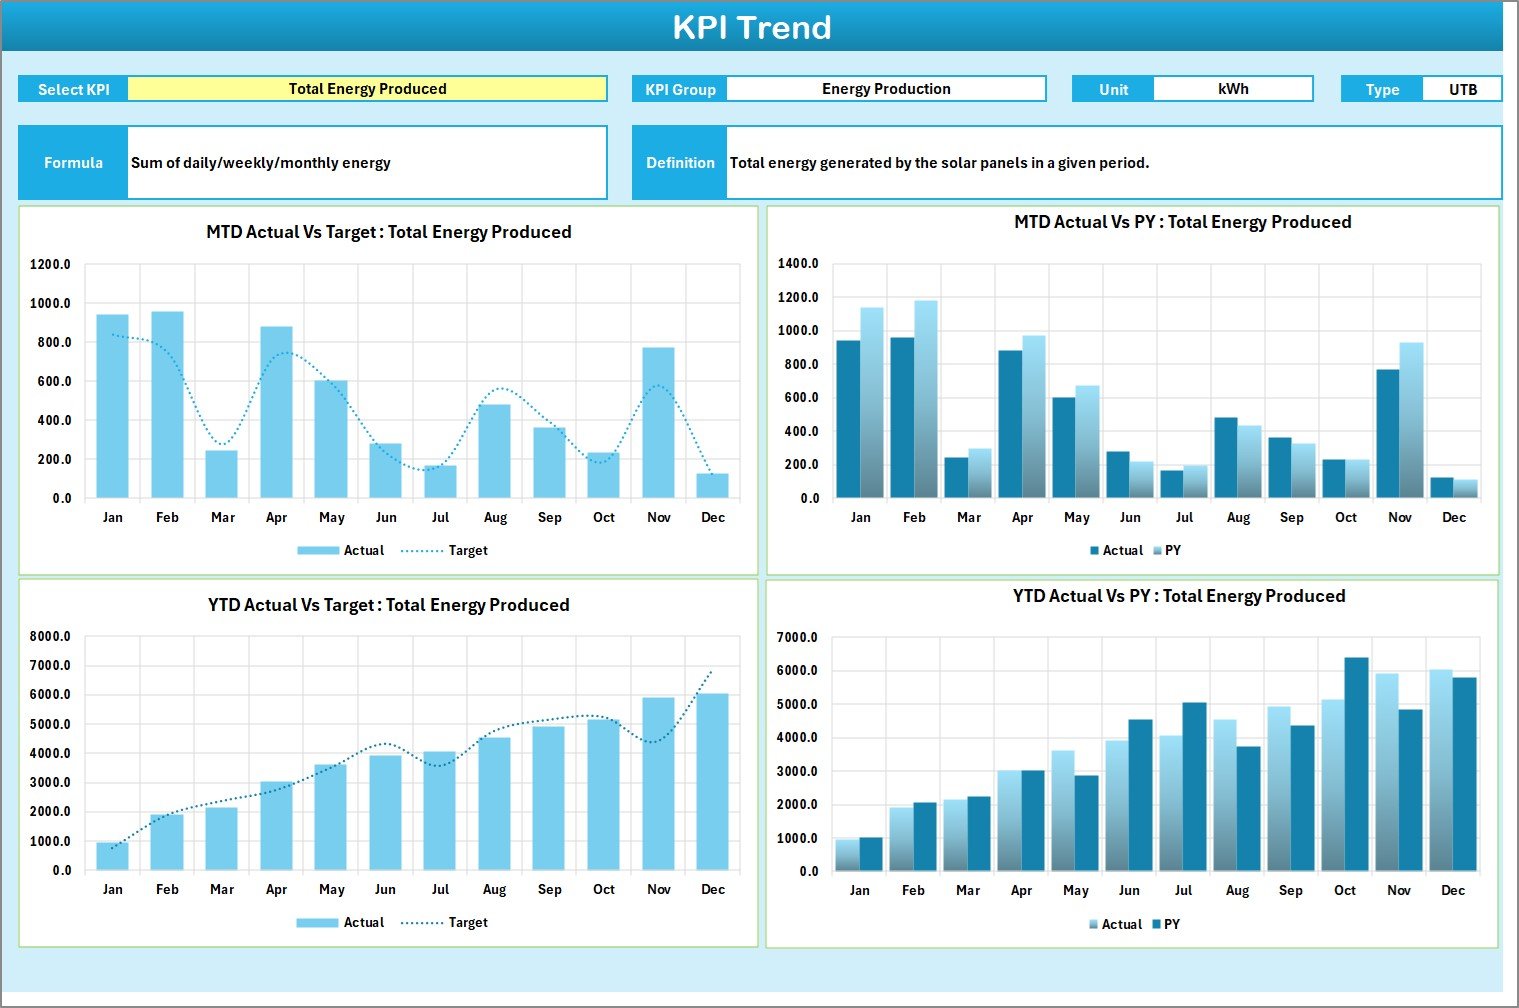
This sheet provides deep trend analysis of each KPI. You can choose any KPI from the dropdown in cell C3, and instantly see its performance patterns over time.
📈 Key Elements:
-
KPI Group, Unit, and Type: Displays details like energy, maintenance, or cost — including whether a KPI is “Upper the Better” or “Lower the Better.”
-
KPI Formula and Definition: Understand exactly how each metric is calculated.
-
Trend Charts: Visualize MTD and YTD performance for Actual, Target, and Previous Year (PY) data.
-
Comparative Insights: Spot trends, seasonal variations, and improvements over time.
This tab helps analysts and engineers monitor performance consistency and identify problem areas.
3. Input Data Sheet
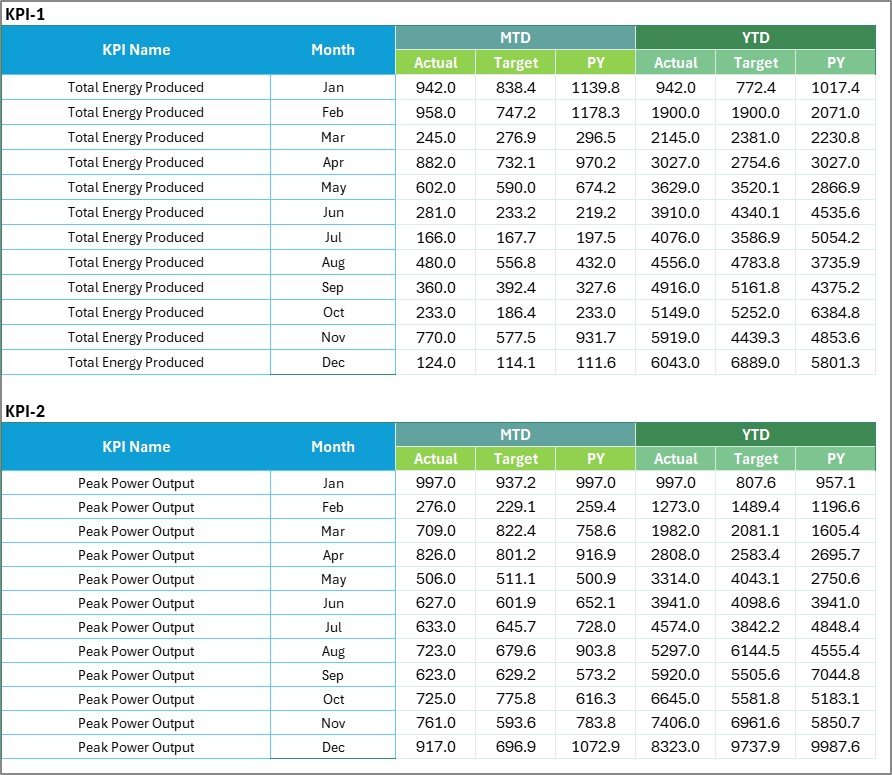
The Input Data Sheet is where all your raw data lives. It’s designed to make data entry simple, flexible, and error-free.
🧾 Data Entry Highlights:
-
Actual and Target Values: Enter real-time or monthly data points for each KPI.
-
Automatic Calculations: Formulas auto-update scorecards and charts.
-
Flexible Design: Add or remove KPIs as per project requirements.
-
Real-Time Updates: Keep data current without changing the structure.
The input sheet acts as the data foundation for the entire system — feeding live metrics into the scorecard and trend sheets.
4. KPI Definition Sheet Tab
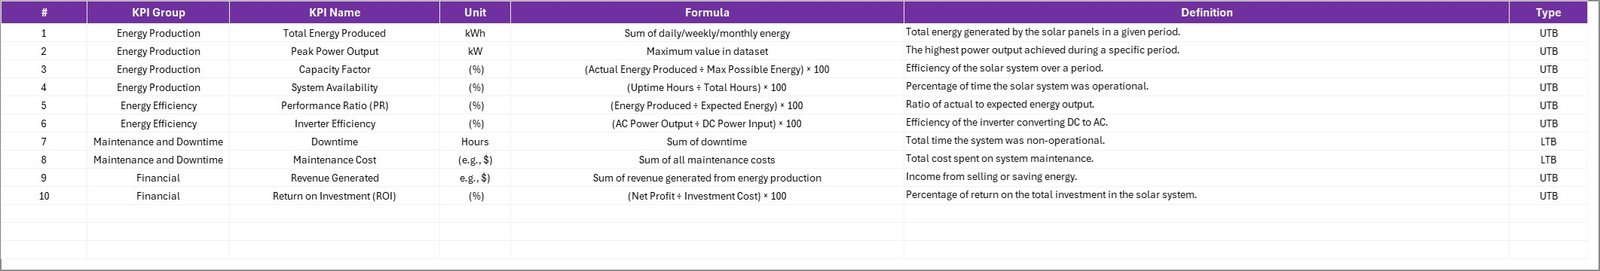
Every KPI needs a clear definition, formula, and measurement logic. That’s why this sheet serves as the reference dictionary for your solar performance metrics.
📘 You Can Define:
-
KPI Name & Group (e.g., Energy Generation, Efficiency, Cost)
-
Unit of Measurement (e.g., kWh, %, USD)
-
Formula Used for Calculation
-
KPI Definition & Description
-
Performance Type: Whether Higher is Better or Lower is Better
This ensures everyone in your organization understands how each metric is measured and interpreted — promoting consistency across teams.
⚙️ How the Solar Energy KPI Scorecard Works
The scorecard functions through a series of linked formulas, conditional formatting, and pivot-based charts.
-
Data Entry: Input actual and target numbers in the Input Data Sheet.
-
Automatic Calculations: Excel formulas instantly update key metrics.
-
Dynamic Dashboard: The Scorecard sheet updates visuals and charts.
-
Trend Analysis: Select KPIs to view progress over time.
-
Performance Evaluation: Identify which metrics need attention.
The simplicity of Excel makes this solution both affordable and user-friendly — no coding or complex software required.
Click to Purchases Solar Energy KPI Scorecard in Excel
🌞 Advantages of the Solar Energy KPI Scorecard in Excel
Implementing this scorecard brings several operational, financial, and strategic benefits.
1. Easy to Use
Anyone familiar with Excel can use this template. It eliminates the need for costly BI software while offering powerful analytics.
2. Customizable
You can easily modify KPI names, units, and charts according to your solar project’s requirements.
3. Real-Time Monitoring
The scorecard updates instantly when new data is entered, ensuring you always have up-to-date performance insights.
4. Data-Driven Decision-Making
Visuals, traffic lights, and trend charts simplify complex data, helping teams make quick, informed decisions.
5. Comprehensive Analysis
It combines technical and financial metrics to provide a holistic view of solar operations.
6. Sustainability Reporting
By tracking carbon savings and renewable output, it supports sustainability and ESG reporting needs.
7. No Subscription Required
It’s a one-time purchase template — no monthly fees, no external dependencies.
🚀 Opportunities for Improvement in Solar KPI Tracking
Even though Excel-based systems are flexible, there are always opportunities to improve performance tracking.
-
Automate Data Collection: Link sensors, IoT systems, or data loggers to the scorecard for real-time updates.
-
Integrate with Power BI: Visualize KPI trends using Power BI for more interactive dashboards.
-
Add Predictive Analytics: Use forecasting to predict generation and maintenance needs.
-
Expand KPI Library: Include more environmental and financial KPIs, such as Cost per Installed kW or Customer Satisfaction.
-
Use Cloud Collaboration: Host the scorecard on OneDrive or Google Drive for multi-user access.
Continuous improvement ensures long-term efficiency and higher ROI.
💡 Best Practices for Using the Solar Energy KPI Scorecard in Excel
To maximize the effectiveness of your KPI scorecard, follow these best practices:
-
Define Clear KPI Targets: Set realistic monthly and annual goals for every KPI.
-
Update Data Regularly: Enter fresh data weekly or monthly to ensure accuracy.
-
Standardize Units: Always use consistent measurement units like kWh, %, or USD.
-
Review Trend Charts: Monitor MTD and YTD performance to identify deviations early.
-
Use Conditional Formatting Wisely: Highlight critical areas needing attention.
-
Back Up Data: Save historical performance data to compare across years.
-
Train Team Members: Ensure all users understand KPI definitions and interpretations.
-
Conduct Monthly Review Meetings: Discuss underperforming metrics and improvement plans.
By following these practices, you can maintain reliable data integrity and actionable insights.
🧭 Who Can Use This Template?
This scorecard is ideal for anyone involved in solar energy management and reporting, including:
-
Solar energy companies
-
Renewable energy consultants
-
Power plant operators
-
Sustainability analysts
-
Energy auditors
-
Educational institutions teaching renewable management
It bridges the gap between complex solar analytics and simple data visualization.
📈 Example Use Case: Solar Plant Performance Tracking
Click to Purchases Solar Energy KPI Scorecard in Excel
Let’s consider a solar power company managing three plants across India. Each plant generates monthly data for generation, downtime, and efficiency. By entering this data into the Solar Energy KPI Scorecard, the company can:
-
Compare plant-wise performance.
-
Identify the site with maximum efficiency loss.
-
Track monthly trends in generation and maintenance cost.
-
Evaluate financial KPIs like ROI and Payback Period.
-
Prepare sustainability reports showing carbon emission reduction.
This practical application ensures continuous improvement and informed decision-making.
🧮 Technical Highlights of the Scorecard
-
Dynamic Formulas: Automated calculations for MTD and YTD performance.
-
Color-Coded Alerts: Red, Yellow, Green indicators for instant visibility.
-
Pivot-Ready Design: Use pivot tables to create custom views and charts.
-
Excel Compatibility: Works seamlessly on Excel 2013, 2016, 2019, and Microsoft 365.
-
Fully Editable: All formulas, ranges, and labels are open for customization.
🏁 Conclusion
The Solar Energy KPI Scorecard in Excel is a comprehensive, affordable, and intelligent solution for tracking renewable energy performance. It combines the simplicity of Excel with the power of analytics — allowing users to monitor, analyze, and improve solar energy operations efficiently.
By integrating well-defined KPIs, real-time data updates, and visual insights, this scorecard transforms numbers into actionable intelligence. Whether you manage a single solar installation or multiple energy projects, this tool provides the clarity you need to make smarter, data-driven decisions for a greener future. 🌍
Click to Purchases Solar Energy KPI Scorecard in Excel
❓ Frequently Asked Questions (FAQs)
1. What is the purpose of a Solar Energy KPI Scorecard?
It helps measure and analyze key solar energy performance indicators like energy generation, efficiency, and maintenance to ensure optimal output and cost efficiency.
2. Can I customize the KPIs in the template?
Yes, all KPIs, formulas, and visuals are fully editable. You can add or remove KPIs as per your project requirements.
3. Does the scorecard support MTD and YTD analysis?
Absolutely. You can toggle between Month-to-Date and Year-to-Date modes to view performance over different time periods.
4. Can this Excel scorecard be used on Mac?
Yes, it works on both Windows and Mac versions of Excel that support standard formulas and charts.
5. How often should I update the data?
Ideally, update your data monthly to maintain consistent and accurate performance tracking.
6. Can I link this Excel scorecard with Power BI?
Yes. You can connect it to Power BI to build a more advanced, visual dashboard while retaining Excel as your primary data source.
7. Does it calculate ROI automatically?
Yes, if you input cost and revenue data, the template calculates Return on Investment (ROI) automatically.
8. Is the scorecard suitable for small solar setups?
Definitely. It’s scalable and works equally well for small rooftop installations or large solar farms.
Click to Purchases Solar Energy KPI Scorecard in Excel
Visit our YouTube channel to learn step-by-step video tutorials